Market Volatility
Harmonic Volatility Indicator provides the market volatility of currency and stock helping you to identify low and high market volatility. Harmonic Volatility Indicator is the first volatility algorithm applying the Fibonacci analysis to the market volatility analysis. Harmonic volatility indicator is another level of price action tool, which combines robust Fibonacci ratios (0.618, 0.382, etc.) with the market volatility. Originally, Harmonic Volatility Indicator was developed to overcome the limitation and the weakness of Gann’s Angle, also known as Gann’s Fan. We have demonstrated that Harmonic Volatility Indicator can be applied in a similar manner to Gann’s Angles (or Gann’s Fans) to your chart. At the same time, since the volatility is important information for traders, Harmonic Volatility Indicator can bring many other benefits for your trading. Harmonic Volatility Indicator can be incorporated to your existing technical analysis. It is also very effective in spotting mature trend or breakout phase. You can use this tool to identify the significant support resistance levels, trend reversal point and breakout trading.
Possible Trading Strategies
You can expand your trading with different ideas using Harmonic Volatility Indicator like below:
- Possible Trading Setup 1 – Harmonic Volatility Indicator as zone trading (reversal and breakout trading setup)
- Possible Trading Setup 2 – Harmonic Volatility Indicator and common oscillators (reversal trading setup)
- Possible Trading Setup 3 – Harmonic Volatility Indicator and Market Profile (reversal trading styles and possible to trade with breakout mode)
- Possible Trading Setup 4 – Harmonic Volatility Indicator and Harmonic Pattern Plus and Market Profile (reversal trading setup)
Market Volatility Indicator Setting
These inputs control the global setting of the indicator.
- Number of Daily Session: 0 means indicator will not draw any daily volatility lines. 1 means that indicator will draw one set of daily volatility lines. You can create multiple session of daily volatility lines. However, too many sessions can slow down your MetaTrader. So use the right number for your computer.
- Number of Weekly Session: It is the same as daily session input.
- Number of Monthly Session: It is the same as daily session input.
- Starting Index: 0 is default value. For 0, indicator will start to draw from session 0.
- Use White Chart: True means that you will use white background chart.
- Use Individual Line Color: If this is false, then you will use global color scheme. If this is true, then you can use individual color scheme
- Daily Line Color: Color of daily line
- Weekly Line Color: Color of weekly line
- Monthly Line Color: Color of monthly line
- Show Probability Lines: switch on and off the curved probability line
- Show Final Projection: switch on and off the trading zone box
- Projection Margin: size of trading Zone (0.05 = 5%, 0.0618 = default)
Market Profile Settings
- Use Market Profile: Switch on and off market profile from your chart
- Session: choose from daily, weekly or monthly only
- SessionsToCount: Number of sessions for which to count the Market Profile
- Color for Market Profile: color for market profile
- Color for Median: color for median value
- Color for Value Area: color for value area
Setting for Each Probability Line
Each probability line can be switched on and off according to your preferences. You have the same setting for nine lines.
- Use Line 1: You can switch on and off the line
- Probability Line 1: You can set the ratio of the line
- Probability Line 1 Color: Color for line
- Probability Line 1 Width: width for line
- Probability Line 1 Style: style for line
Important Note
This indicator is Graphic Intensive. Therefore, when you use too many session for harmonic volatility indicator and market profile, this can slow down your MetaTrader. So try to use right amount of session suit for your computer specs if you are going to use this indicators for many symbols. This product is the off the shelf product in the store. Therefore, we do not take any personal modification or personal customization request. For our products, we do not provide any code library or any support for your coding. Also check difference between Fibonacci Volatility Indicator, Harmonic Volatility Indicator and Double Harmonic Volatility Indicator.
Keyboard Short Cut
Press Keyboard D: Redraw Harmonic Volatility indicator from your chart.
Timeframe Choice
When Daily Market Profile session is on, you can not use H4, D1, W1 and MN1 timeframe.
YouTube Video about Market Volatility Indicator
YouTube Link: https://www.youtube.com/watch?v=sVaMwXAlYRs
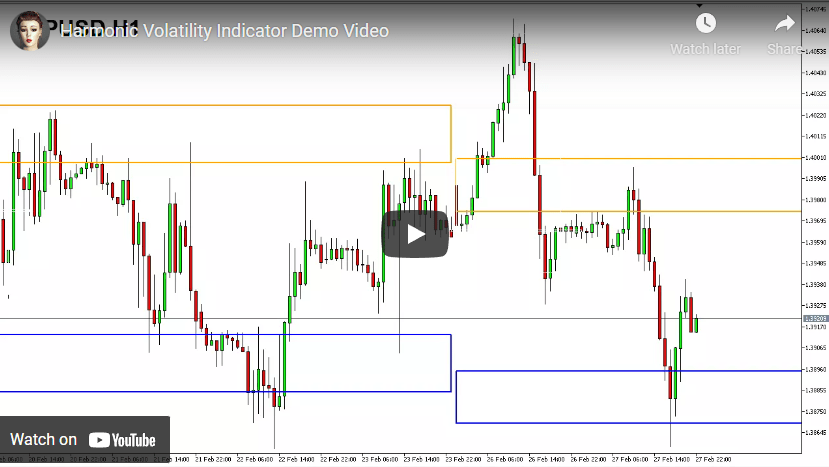
Market Volatility Indicator YouTube