Support and Resistance
Support and Resistance are price levels to watch out during the trading hours. Support and resistance are basic but most important concept for Price Action. The support and resistance price levels are often tested before development of new trend. Or support and resistance can stop the existing trend causing trend reversal at this point. Good support and resistance indicator is almost valueless tool for your trading and investment. Many typical trading strategies like breakout or trend reversal can be played well around these support and resistance levels. Precision Support and Resistance is the support and resistance indicator designed for the price action trader. In addition to support and resistance level detection, Precision Support and Resistance comes with additional features to increase your trading performace. They include decision candle detection, Intra Candle Probability Calculation, Pivot Analysis and Ladder Analysis. Any of these features can be switched on and off in your trading.
Support and Resistance Features
- Highly accurate support and resistance identification, Pivot Point Analysis, Round number detection
- Great tool to start the Price Action and Pattern Trading
- Sound Alert, Email, Push Notification on the critical Support and Resistance level or Pivot levels.
- Suitable for both breakout strategy and trend reversal strategy and even scalping
- Additional features including daily pivot analysis, decision candle detection, probability and ladder analysis
- Great performance for all currency pairs
Support and Resistance Detection
We use the density and geometry approach to compute support and resistance levels. Quite often you will observe that detected support and resistance levels predict very accurately where price penetrate hard or where price reverse back hard. According to you preference, some sensible trading strategy can be developed.
Decision Candle Detection
Decision candle detection module alerts traders the possible big movement. Decision candle is the typical pattern appearing before onset of the strong reversal or strong continuation of the current trend. Therefore, it is recommended to watch out the appearance of this decision candle in your trading especially if they are around important support and resistance level.
Intra-Candle Probability Calculation
Intra-Candle probability is the statistical prediction of future range of close price within candle bar. This tool will display 1%, 5%, 10%, 32%, 50%, 80% levels. The pair of lines will be drawn above and below the open price of the current candle. 50% probability means that the chance of the close price being outside this lines is the 50% from open price of the candle. Instead of doing some guess work, you can precisely estimate when the price will touch support and resistance level or when the price will touch moving average line or when the price will touch Bollinger band lines, etc.
Pivot Analysis
We added the standard pivot analysis technique. Pivot analysis can be used in two purpose. Firstly you can use pivot level to double confirm support and resistance levels. Secondly you can use pivot level to confirm rough trend if that is your interest. For example, if price closed below S1 or S2 in yesterday, then you can say that current trend is downmarket. The built in Pivot analysis provide daily pivot only and you can choose how many number of days you want to display the pivot levels.
Ladder Analysis
Simply speaking ladder analysis will answer the question like what is the probability of the close price will stay outside the specified level of your interest. For example, you believe that the level 1.2400 is important and you want to find out what is the chance of the close price will actually end above this important level. Then you can use this Ladder Analysis to find the probability.
Round Number Detection
Round Number, also called psychological number, is very important support and resistance levels used by many traders. Adding the round number can yield a lot of benefits for your trading. For example, you can use round number to double confirm your reversal entry or price breakout entry. If you don’t want to see the round number levels in your chart, just set Round Number Spacing = Zero in the input setting.
Support and Resistance Setting
Default setting works well for most of currency pairs and timeframe. Changing input parameters are not overly complicated. Below is some description for important parameters.
General Settings
- Use White Background Chart: true or false
- Button Text Size: 8 = default, 0 = no buttons
- Use Support and Resistance: Switch on and off S/R
- Use Decision Candle: Switch on and off Decision Candle
- Use Probability Module: Switch on and off Probability Module
- Use Pivot Module: Switch on and off Pivot Module
- Use Ladder Module: Switch on and off Ladder Module
Support Resistance Setting
- Time frame for SR detection
- Window: default=10
- Depth: 1000
- Use Equal Number of Support and Resistance
- S/R Maximum Distance in Pips
- S/R Minimum Distance in Pips
- S/R Filter Level: default=3
- S/R Line Width
- S/R Line Length
- Line colour for support
- Line colour for resistance
Decision Candle Setting
- Bars to scan
- Line Color for box
- Line Width for box
- Enable sound alert if pattern is found
- Send email if pattern is found
- Send notification if pattern is found
Probability Analysis Setting
- Standard Devision Period
- Projection Horizon
- Line color for level
- Line Width for level
- Price Label Size
- Text Font Size
- Text color
- Open Price Line color
- Use Line 1
- Use Line 2
- Use Line 3
- Use Line 4
- Use Line 5
- Use Line 6
Pivot Settings
- Days to display
- Line Color for middle pivot line
- Line color for resistance
- Line color for supports
- Line width
- Price Lable size
- Text Font Size
- Text Color
Ladder Analysis Settings
- Ladder Level 1: enter the price level for your analysis
- Ladder Level 2: enter the price level for your analysis
- Ladder Level 3: enter the price level for your analysis
- Ladder Level 4: enter the price level for your analysis
- Ladder Level 5: enter the price level for your analysis
- Ladder Level 6: enter the price level for your analysis
- Ladder Level 7: enter the price level for your analysis
- Ladder Level 8: enter the price level for your analysis
- Ladder Level 9: enter the price level for your analysis
- Ladder Level 10: enter the price level for your analysis
- Line length in candle bars
- Line width
- Line Price Label Size
- Ladder offset 1: control distance between ladder lines
- Ladder offset 2: control distance between ladder lines
- Line color
Support And Resistance Running Mode
In version 7.2 onwards, you can use two different mode for Support Resistance detection. You can control the mode using Auto Lock input.
Mode 1 (Auto Lock = true): less responsive to market change. This means that the support and resistance will be updated less frequently.
Mode 2 (Auto Lock = false): more responsive to market change. This means that the support and resistance will be updated more frequently. To make use of this feature best, you have to use Lock and unlock feature of each support and resistance levels. How to lock and unlock each support and resistance levels are show in the screenshot.
Why Mode 1 and Mode 2 is different ?
Understand the principle of that support become resistance once the price move below support. Likewise, the resistance become support once the price move above the resistance. This relationship is taking account in Mode 2. Therefore it is more responsive. Mode 1 (Auto Lock = true) does not take account for this (it will change colour but not the support and resistance level itself.).
When you are using Mode 2, it is better you should lock the tactically important support and resistance levels for your trading. To do so, just double click over the support and resistance line in your chart. To remove the locked levels, simply delete it by yourself from chart or just unselect the rectangle box then it will remove the box and other lines from your chart.
If you are consider yourself as the less tactical person or starters, then just go for the Mode 1 (Auto Lock = true). Then you have to do less on locking and unlocking with the tactical levels. I personally prefer to trade only on certain support and resistance levels. But who knows that you are doing something totally different. In that case, just go for Mode 1. Once your trading skills get better, then go for Mode 2 gradually according to your own preferences.
Important Note
This product is the off the shelf product in the store. Therefore, we do not take any personal modification or personal customization request. For our products, we do not provide any code library or any support for your coding.
YouTube Video about Support and Resistance Indicator
YouTube Link: https://www.youtube.com/watch?v=bNhesdSpres
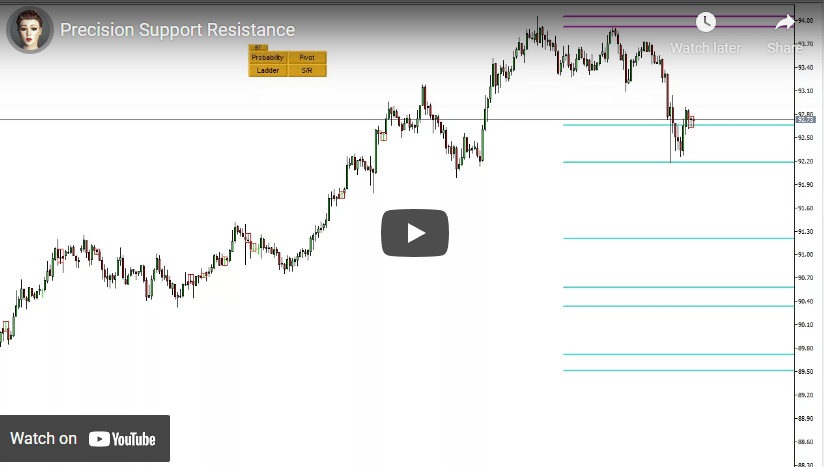
Support and Resistance Indicator YouTube