Study Profitable Chart Patterns for Forex
Studying profitable chart patterns for forex trading involves analyzing historical price movements to identify recurring patterns that may indicate potential future price movements. Here’s a step-by-step guide on how to study profitable chart patterns for forex:
- Understand the Basics: Before delving into chart patterns, it’s crucial to have a solid understanding of forex trading basics, including currency pairs, pip movements, and market dynamics.
- Learn Chart Patterns: Familiarize yourself with common chart patterns such as triangles, flags, pennants, head and shoulders, double tops/bottoms, and wedges. Each pattern signifies a potential trend continuation or reversal.
- Use a Reliable Trading Platform: Choose a reputable forex trading platform that offers advanced charting tools and indicators. MetaTrader 4 (MT4) and MetaTrader 5 (MT5) are popular choices among forex traders due to their comprehensive charting features.
- Study Historical Price Data: Analyze historical price charts of different currency pairs across various timeframes (e.g., 1-hour, 4-hour, daily) to identify recurring chart patterns. Pay attention to how price behaves within these patterns and the subsequent price movements.
- Identify Patterns: Look for chart patterns that have formed or are forming on the price charts. Pay attention to the shape, duration, and location of these patterns within the price action.
- Confirm with Indicators: Use technical indicators such as moving averages, Relative Strength Index (RSI), and MACD (Moving Average Convergence Divergence) to confirm the signals provided by chart patterns. Indicators can help validate the strength of a pattern and potential entry/exit points.
- Risk Management: Implement proper risk management techniques to protect your capital. This includes setting stop-loss orders to limit potential losses and adhering to position sizing principles to avoid overexposure to any single trade.
- Backtesting and Practice: Before trading with real money, practice identifying chart patterns on historical data through backtesting. This helps validate the effectiveness of your trading strategy and builds confidence in your ability to recognize profitable patterns.
- Stay Informed: Stay updated on market news, economic events, and geopolitical developments that may impact currency markets. Fundamental analysis can complement technical analysis and provide additional insights into potential market movements.
- Continuous Learning: Forex markets are dynamic, and trading strategies need to evolve with changing market conditions. Continuously educate yourself on new trading techniques, patterns, and market trends to stay ahead of the curve.
- Seek Guidance: Consider joining online trading communities, forums, or seeking guidance from experienced traders to gain insights and exchange ideas about profitable chart patterns for forex trading.
Remember that while chart patterns can provide valuable insights into market sentiment and potential price movements, they are not foolproof indicators. It’s essential to combine chart pattern analysis with other forms of technical and fundamental analysis and practice prudent risk management to improve your chances of success in forex trading.
When we study the profitable chart patterns like Fibonacci price patterns, Harmonic patterns and Elliott Wave patterns, we can observe interesting points about these price patterns. Firstly, all the previous pattern theory used points and lines as the main reference in their pattern structure. For example, in Harmonic Pattern, the main reference to its structure is the XABCD points. This letter is assigned to each point of the pattern. In Elliott Wave pattern, the main reference to its structure is Wave 12345 and Wave ABC. Each number in Elliott Wave represents the swing line at each wave.
The main logic of zigzag price path is that one triangle is built up from three zigzag points or two price swings. Hence, in X3 pattern, the main reference to the pattern structure is the triangles of the pattern instead of points and lines. When you have too many point and line references in your pattern structure, we will feel not easy as the number of lines and points are increasing in our chart. Hence, we are limited to study more complex patterns with points and lines. When you study the triangles of the pattern directly, you can study more complex pattern structure with less overhead cost. Secondly, Fibonacci price pattern, Harmonic pattern, and Elliott Wave theory are Fibonacci number oriented.
Thirdly, the classic patterns have its fixed structure. For example, Harmonic pattern uses five points of XABCD (i.e. three triangles) and Elliott Wave pattern uses Wave 12345 (i.e. four triangles) as an impulse wave and Wave ABC (i.e. two triangles) as corrective wave. X3 price patterns allow you to extend the pattern structure into more number of triangles because we think the profitable patterns can come from both simple and complex structure.
Chart Patterns study is the ultimate weapon for your trading in comparison to the common technical indicators like the moving average or oscillator, etc. Chart Pattern is the tool to solve the market geometry for the Forex and Stock market trader in the intuitive way. We went beyond any individual in developing the powerful Pattern detection indicators and scanner in last 10 years. These tools are already appreciated by top professional trader in the world. We supply these powerful pattern detection indicator and pattern scanner in both MetaTrader 4 and MetaTrader 5.
1) Harmonic Pattern Plus
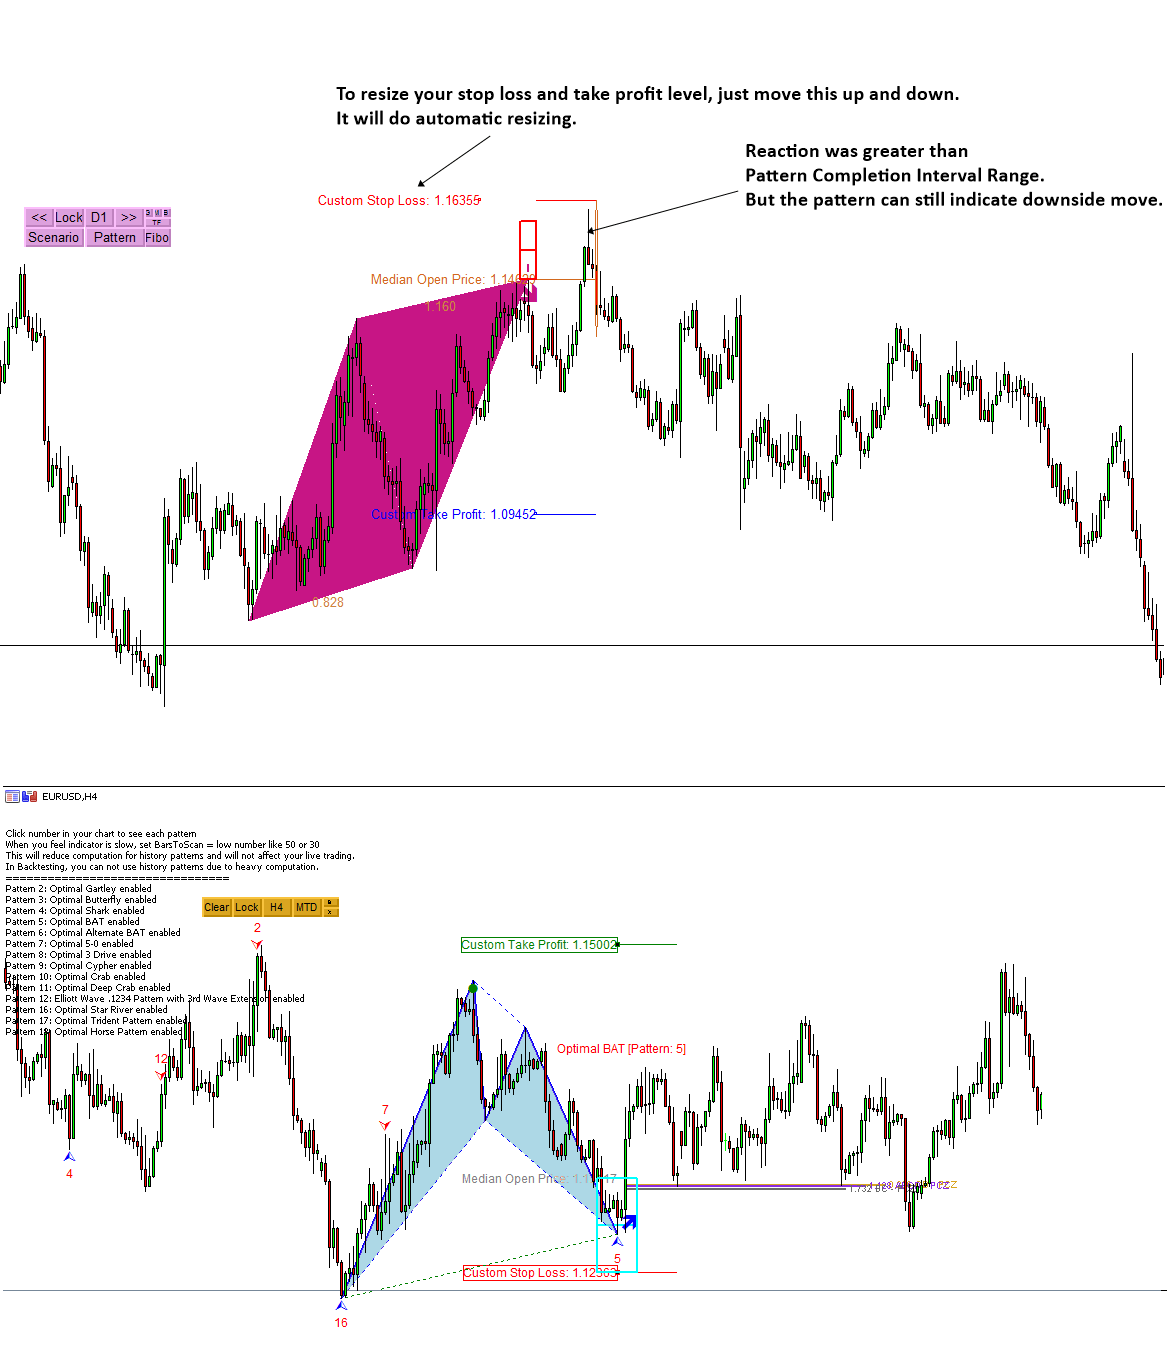
One of the first automated Harmonic Pattern detection tool released in 2014. It can detect 11 most popular harmonic patterns with well-defined trading entries and stops. Pattern Completion Interval, Potential Reversal Zone and Potential Continuation Zone are supported. In addition, other dozens of powerful features are added like Japanese candlestick detection, etc. Because of affordable price, this harmonic pattern detection indicator is loved by many traders.
https://www.mql5.com/en/market/product/4488
https://www.mql5.com/en/market/product/4475
https://algotrading-investment.com/portfolio-item/harmonic-pattern-plus/
2) Harmonic Pattern Scenario planner
It is an advanced Harmonic Pattern indicator. On top of the features of Harmonic Pattern Plus, you can also predict future harmonic patterns through simulation. This is the tactical harmonic pattern tool designed for Professional harmonic pattern trader. Because of affordable price, this harmonic pattern detection indicator is loved by many traders.
https://www.mql5.com/en/market/product/6240
https://www.mql5.com/en/market/product/6101
https://algotrading-investment.com/portfolio-item/harmonic-pattern-scenario-planner/
3) X3 Chart Pattern Scanner
X3 Chart Pattern Scanner is our next generation Pattern Scanner. This is non-repainting and non-lagging Harmonic Pattern Indicator. On top of that, this tool can detect Elliott Wave Pattern and X3 Chart Patterns. It can detect over 20 Chart Patterns. The bonus is that you can also detect around 52 Japanese candlestick patterns. In addition, we have added the powerful channel function for more accurate buy and sell decision making.
https://www.mql5.com/en/market/product/41993
https://www.mql5.com/en/market/product/41992
https://algotrading-investment.com/portfolio-item/profitable-pattern-scanner/
Together with above indicators, you can also use Volume Spread Zone analysis. Our volume spread analysis is free tools you can use. This means absolutely free to download and to use.
https://algotrading-investment.com/2019/09/06/harmonic-pattern-with-volume-zone-oscillator/
Related Products


