Stock Market Prediction Application with Fractal Decomposition
To help your understanding with the Fractal Decomposition Analysis (FDA), we provide the light practical application for Stock market prediction. This application can be used for Forex market prediction too. In this chapter, we will be demonstrating this Stock Market Prediction Application in detail. Direct Download for this application is available from the link below:
www.algotrading-investment.com/FreeDownload/StockMarketPrediction.zip
(Current Version 7.8 for Stock Market Prediction Application)
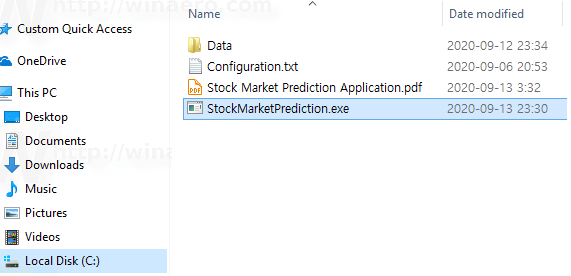
Figure 4.11-1: Contents inside the unzipped Stock Market Prediction Application
Once you have unzipped the download, you will find StockMarketPrediction.exe file inside the Folder. You need to know few things about the application. Firstly, the application was built from Dot Net Framework 4.5 for the time being. Hence, you need to have the Windows OS with Dot Net Framework 4.5 or later version installed. For your information, we do not have much knowledge on how this Dot Net Framework can run on other OS like Mac or Linux. Secondly, I can swear that there is no harmful virus inside this light application. However, some antivirus software can always cause some false positive alert (i.e. wrong alert) since many antivirus software are not so friendly toward the Dot Net Framework Application. Antivirus software Vendors ask contacting them in the case of false positive alert. However, there are literally thousands of antivirus software vendors and we cannot contact all of them to release one free software. Hence, when you get the false positive alert, you can ignore them. This application is safe to use for sure. Thirdly, this is the free software. Hence, there is no restriction on the usage. You are free to use and free to share on online. When you use this free application for trading, use it at your own risk.
Now let us run the Stock Market Prediction executable file. When you run the executable file, you will get to see the simple user interface. Usage of this application is simple like using the vending machine. Use of this application consists of two steps. Firstly, input data. Secondly, the application will output the prediction results for the Fractal Decomposition analysis.
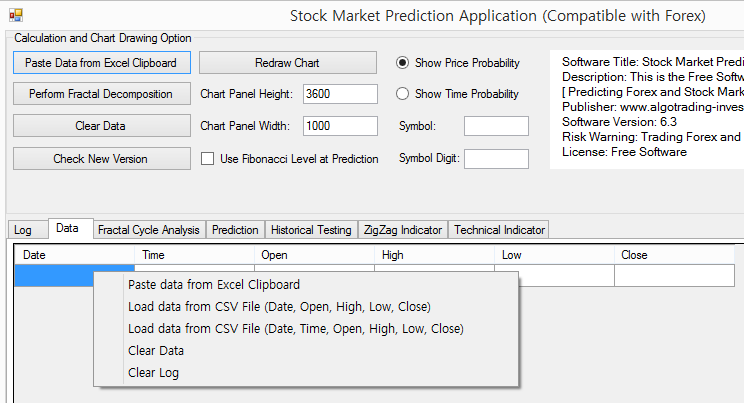
Figure 4.11-2: Data loading option menu with the right mouse click in the Data Tab page
To fulfil the data input step, the best way is to gather the Forex or Stock market data in the order of Date, Time, Open, High, Low, and Close in Excel. This should be not so hard as the most of Forex and Stock market data are provided in the similar manner. However, in some daily data, they might provide the five columns only like Date, Open, High, Low, and Close. In that case, you can just create Time column between Date and Open price column in Excel. Just fill the time column with 00:00:00 (hh:mm:ss) or 00:00 (hh:mm) or some other time if you prefer. Fortunately, the application is not sensitive with date and time format. As long as you have the six columns of data in the order of Date, Time, Open, High, Low, and Close in the worksheet in Excel, you can copy them using the “Paste Data from Excel Clipboard” option.
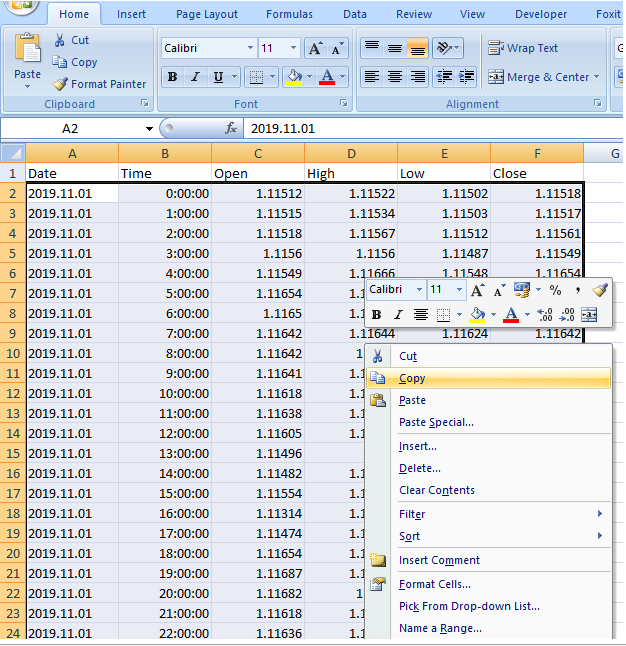
Figure 4.11-3: Forex market data preparation in Excel
Once, you have gathered Date, Time, Open, High, Low, and Close in Excel. Make sure that you have the oldest data on top and the newest data on the bottom. For Fractal Decomposition Analysis, we need at least 1000 data sets. For example, that is nearly 5 years of Daily Stock market data assuming 200 trading days in one year. Select the data in Excel from top left to bottom right using mouse. Do not include the column header. Then, click on the mouse right button to bring the pop up menu. Click “Copy” in the pop up menu. Clicking on the copy menu will load the selected data in your clipboard.
Now go to the application and click “Paste Data from Excel Clipboard” button. This will paste the copied data into the application. You can visually check the loaded data in the application. Make sure that the same data are loaded from the Excel.

Figure 4.11-4: Data loaded in the application before Fractal Decomposition Analysis
If the data is loaded correctly, click on “Perform Fractal Decomposition” button. This will trigger the Fractal Decomposition Analysis on the data you have just loaded from the Excel. In the Fractal Decomposition Analysis page, it will output the Zig Zag indicator drawn on the candlestick chart and the turning point probability. You can use the vertical scroll to access other fractal cycles.
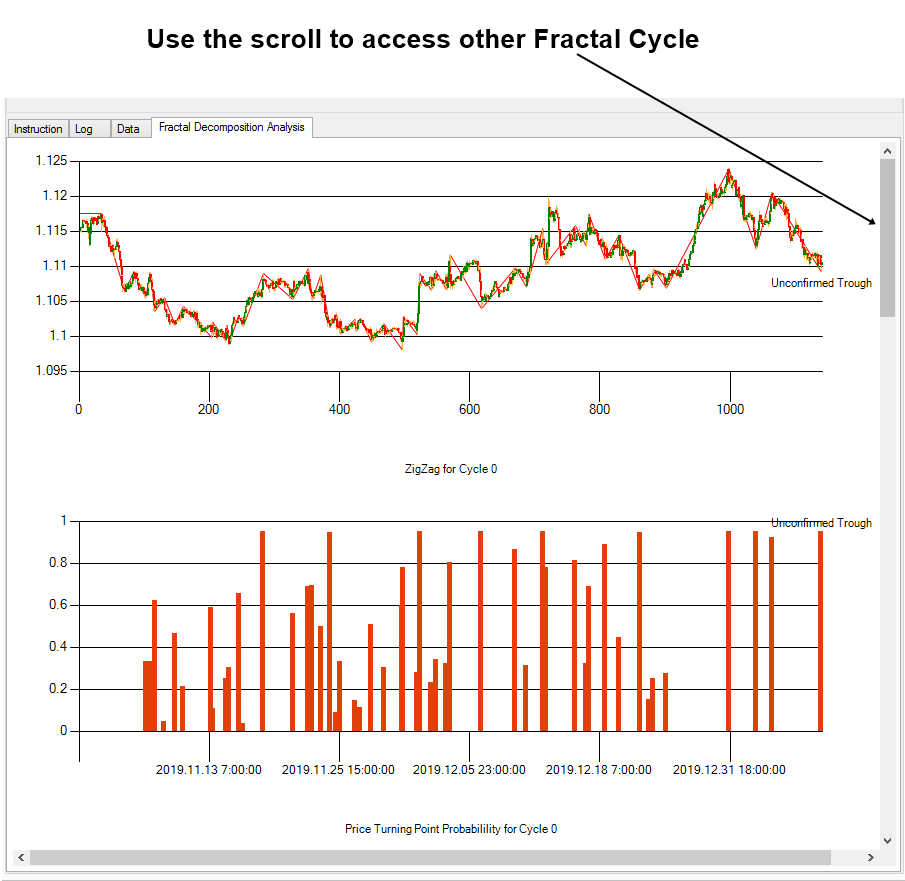
Figure 4.11-5: First Fractal Cycle in the Fractal Decomposition Analysis
For your information, Cycle 0 indicates the smallest fractal cycle in FDA. The application supports up to four Fractal Cycle Analysis for the time being. Hence, Cycle 3 is the biggest cycle you can access. However, occasionally, you will get only three Fractal Cycles in the output. It is because the algorithm will get rid of any insignificant cycle from the analysis. Do not get surprise even if you get the three cycles only.
Calculated turning point probability is corresponding to each peak and trough of the ZigZag indicator. The turning point probability will be displayed in between 0.0 and 1.0. However, the application will not display anything over 0.95 (i.e. 95%). In practical application, our interest for the prediction is at the last extreme point. We want to know what will happen in that peak or trough. The application will label the last extreme point as unconfirmed peak or trough in the chart. You will make your analysis around this unconfirmed extreme point. The corresponding turning point probability will tell a lot about what can happen at that unconfirmed extreme point.
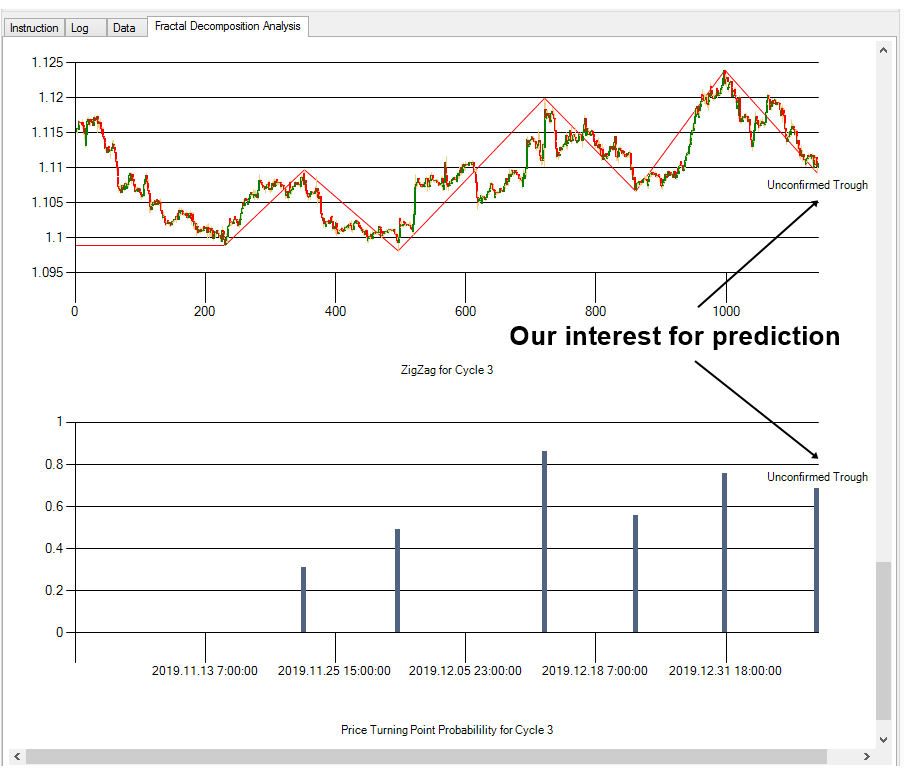
Figure 4.11-6: Last Fractal Cycle in the Fractal Decomposition Analysis
We have already extensively discussed how to use the turning point probability in previous chapters. We will not repeat them here. However, the starting point is that you can pick the breakout trading opportunity in the low probability area and you can pick the reversal trading opportunity in the high probability area.
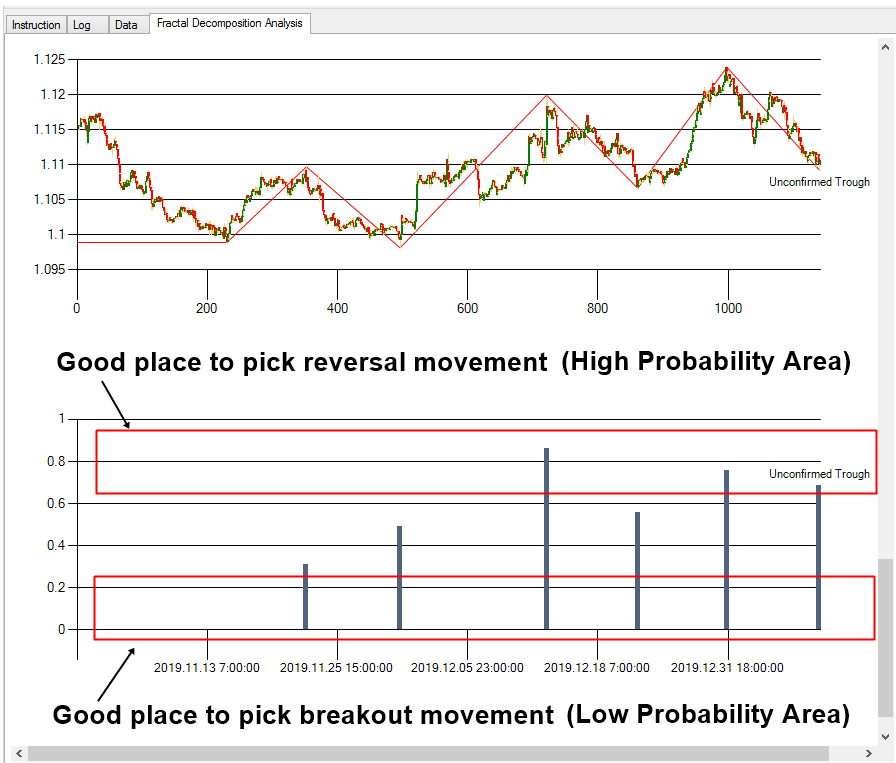
Figure 4.11-7: Breakout and Reversal Trading Range recommended by the turning point probability
Good thing about this application is that it can display the turning point probability in time too. When you click on the radio button “Show Time Probability”, the application will display the corresponding turning point probability for time for each peak and trough in the Zig Zag indicator. To go back to the price probability, just click on the radio button “Show Price Probability”.

Figure 4.11-8: You can choose between Price Probability and Time Probability
Beside the automatic Fractal Decomposition Analysis, there are some additional features in the application. For example, it could draw chart in the scale as you wish. In the default setting, the chart scale is set to 3,000 x 1,000 resolutions (height x width). If you want to have a bigger chart, then change the height and width of Chart Panel. The chart resolution can go up to 10,000 x 10,000 resolutions. However, we cannot guarantee that it always works. In some personal computer, the available resolution size might be limited depending on your graphic card and some other factors. If your computer does not support the resolution, then the application can crash. If you do not want to change the chart resolution, then you can also use the zoom-in feature. The zoom-in can be done by selecting the chart area. The zoom-in can be cancelled when the small circle button is clicked.

Figure 4.11-9: Zoom-in feature in the application
This application can also locate the turning point probability matrix (i.e. the joint probability between each cycle) at any zigzag point. To do so, click on any column graph, and then it will locate the turning point probability matrix and the vertical line to indicate the location of the calculated data point. The turning point probability matrix is much more convenient because you can have the bird eye view on all four cycles. With the vertical line, you can check which zigzag point in each cycle is overlapping together.
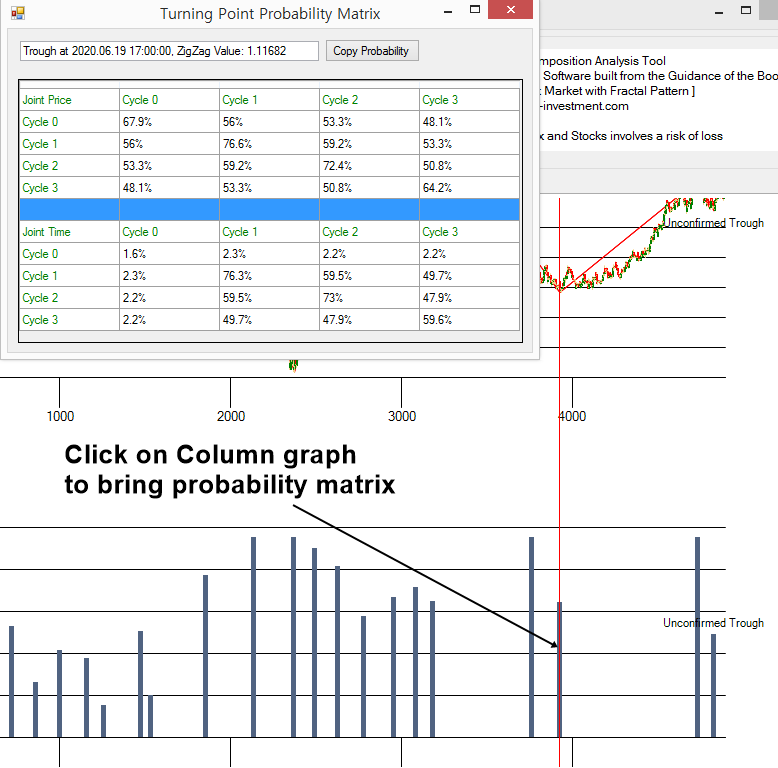
Figure 4.11-10: Click on Column Graph to bring the turning point probability matrix
In Prediction tab page, you can access the turning point prediction made for the latest peak and trough in your data. This Prediction tab page probably contains the most important information for your trading. Left Y-axis indicates the turning point probability in price dimension. Right Y-axis indicates the corresponding price level at each turning point label. Turning point prediction in time dimension is also shown in X-axis. When we predict the turning point at peak, the turning point prediction in time will be drawn in the bottom axis. When we predict the turning point at trough, the turning point prediction in time will be drawn in the top axis. It follows the explanation of the Fibonacci Probability Graph we made earlier.
In the chart in the Prediction tab page, you can also cross-reference the location of one chart to another chart. For example, when you select the area with the mouse left click and drag in the chart at Cycle 0, then the same location will be highlighted in the rest of chart including Cycle 1, Cycle 2 and Cycle 3. This feature is useful as you can make sense with the location of the turning point in small cycle and in the greater cycle too.
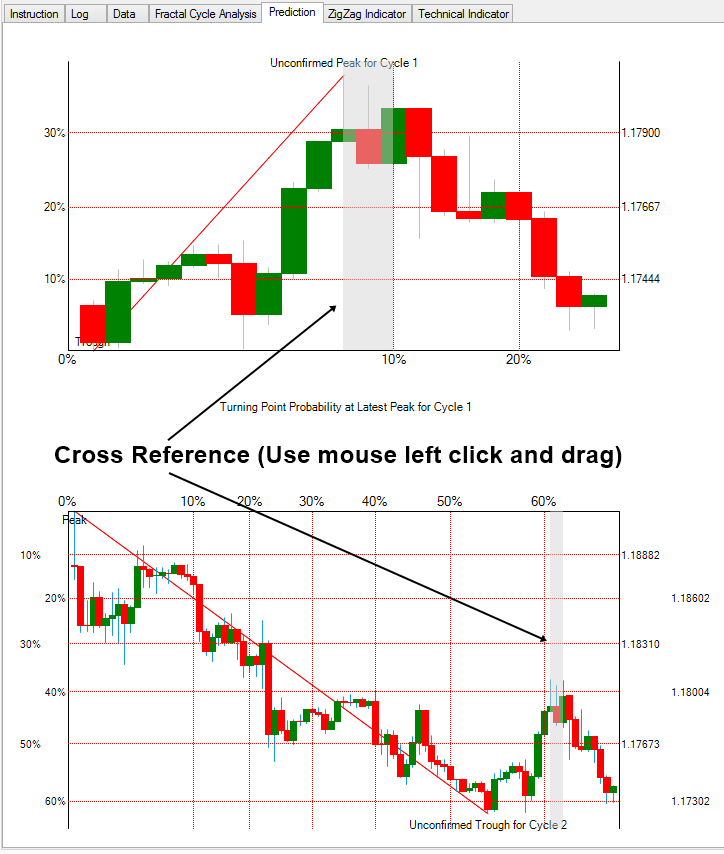
Figure 4.11-11: Turning point prediction shown in the Prediction Tab page
In addition, you can project the Fibonacci price level in the chart. To do so, tick on the “Use Fibonacci Level at Prediction” box. This also works after the full computation is done already. For example, once the box is ticked, click on “Redraw Chart button”. It will redraw the entire chart with the Fibonacci price level instead of the probability. To bring back the probability, untick on the box. Then click on “Redraw Chart” button.
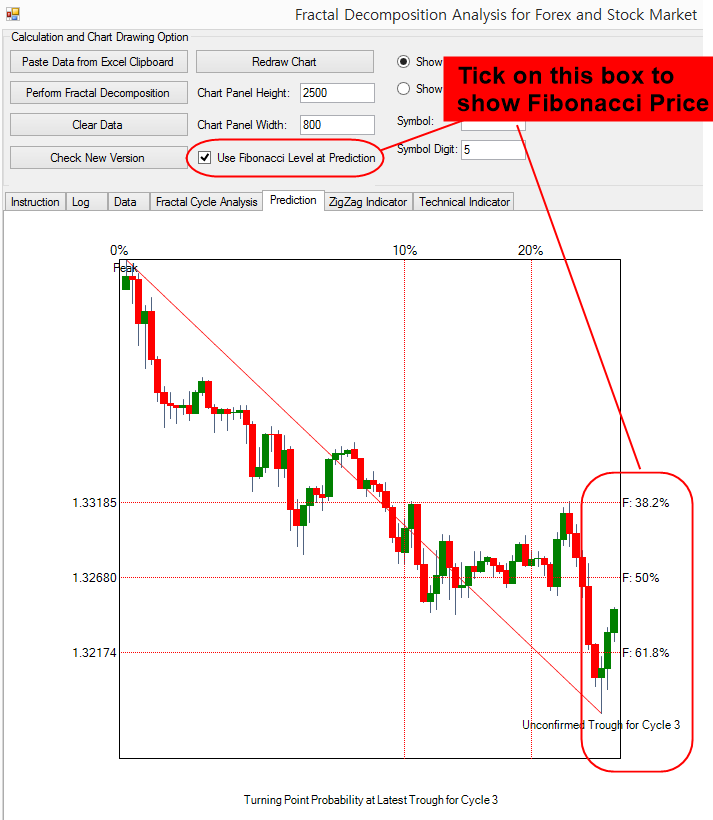
Figure 4.11-12: Projecting Fibonacci Price Level in Prediction tab page
After learning to access on turning point probability and geometric analysis, you might want to tune your trading strategy. To tune your trading strategy, you can use Historical Testing tab page. In Historical Testing tab page, you can check all past turning points for each cycle. To check older turning point, move the track bar to left. When you tune your trading strategy, check both turning point probability and Fibonacci price levels. You can do that by ticking or unticking on “Use Fibonacci Level at Prediction” box.
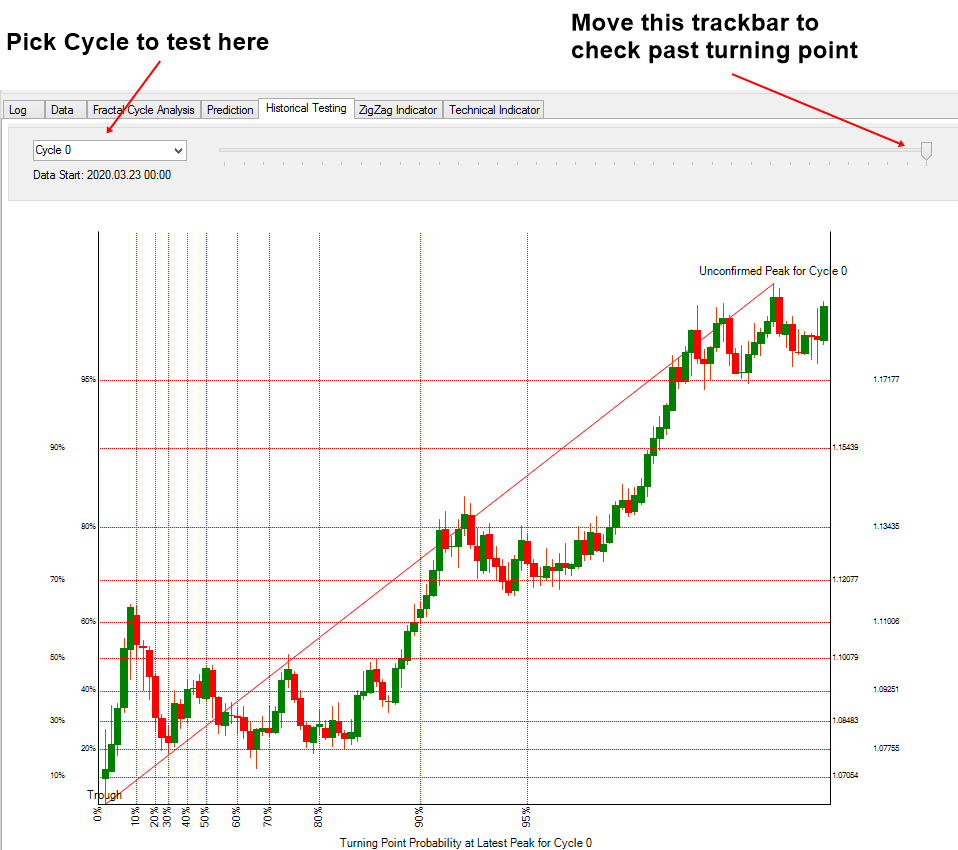
Figure 4.11-13: Historical Testing tab page
In the chart in the Historical Testing tab page, data starts from left side. It will start from one turning point, which is either peak or trough. Then the next turning point, which is either peak or trough, is our interest to predict. Since this is testing with historical data, we already know the resulting price move. The resulting price move will be drawn up to as far as it went in the same direction. After the testing with past turning points, you will find that combination of probability and Fibonacci price level will perform better than just using either probability or Fibonacci price level alone.
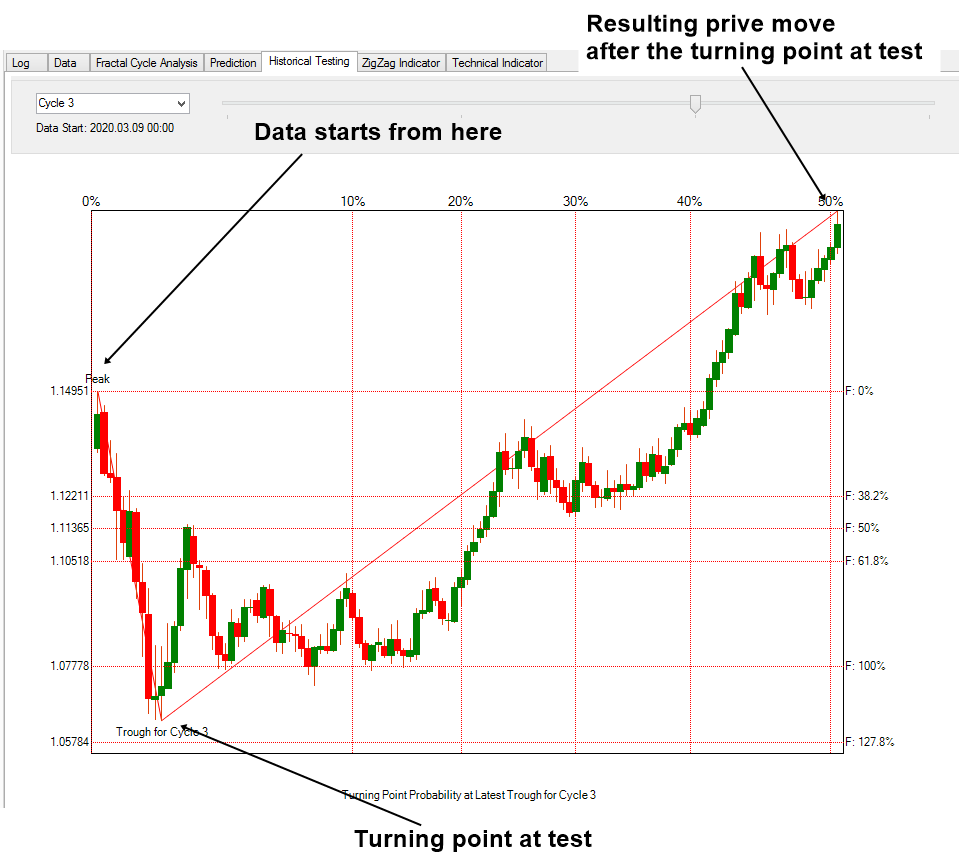
Figure 4.11-14: Testing the past Trough for Cycle 3 in Historical Testing tab page
If you want to drill down your analysis for your trading, we recommend bringing the ZigZag indicator data to Excel. You can do that in the ZigZg indicator tab page. Use the right mouse click to bring the popup menu. For example, with the ZigZag indicator data, you can detect any price pattern that are derived from the Fractal Wave like the Support, Resistance, Elliott Wave, Harmonic Pattern, and X3 Price pattern.
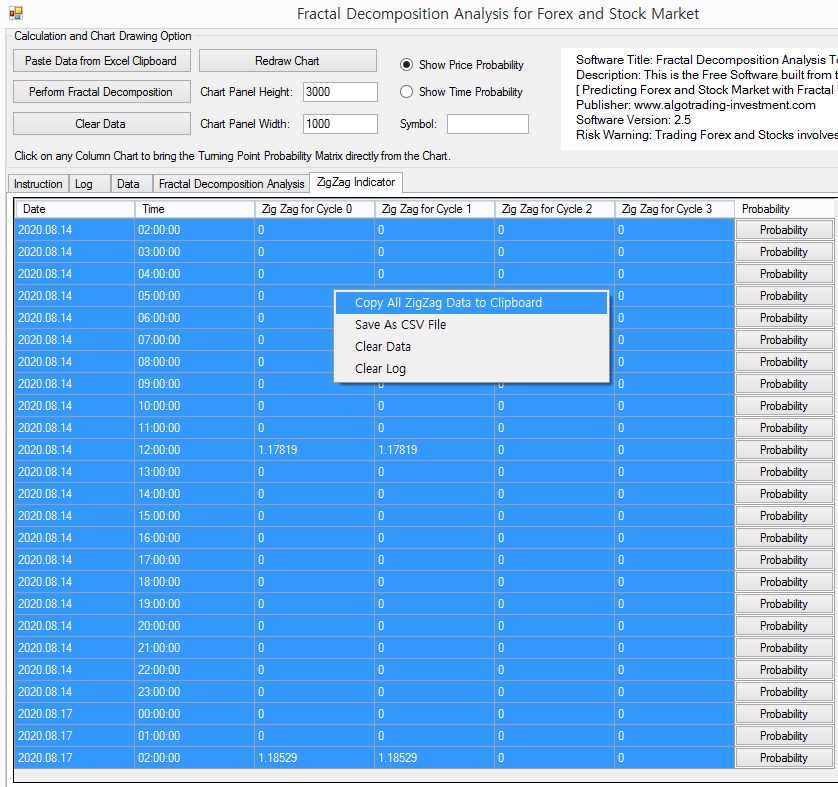
Figure 4.11-15: You can copy the ZigZag indicator data into your Excel via the Clipboard
In addition, you can use some technical indicators along with the turning point prediction. To add or to remove the technical indicators, you need to use Configuraion.txt file. Configuraion.txt file is zipped together with Fractal Decomposition Analysis.exe file. You can simply edit this file in the Notepad or any text editor. Indicator column, the first column, is used to type the indicator name and their parameters. For example, type SMA for simple moving average and EMA for exponential moving average. Decimal column, the second column, is used to specify the decimal places for the indicator calculation. From third column to seventh column indicates displaying the indicators in the chart in the Fractal Cycle Analysis tab page. Integer value 1 indicates drawing whereas integer value 0 indicates not drawing. Hence, if you want to enable the particular indicator in the chart, set them as 1. Some technical indicator like RSI, CCI and ADX requires the separate window to draw them. You can draw those technical indicators in sub window. This tool provides the sub window up to two. You can add up to twelve indicators in this tool. If the indicator is not recognized by the tool, then they will be ignored in the calculation stage.

Figure 4.11-16: Configuration.txt file opened in the Notepad
Once you include the available indicators in Configuration.txt file, the tool will output the calculations into Technical Indicator tab page. Like the ZigZag indicator, you can copy these values into Excel clipboard. Then, you can perform further analysis if you wish.

Figure 4.11-17: Computed indicator values in Technical Indicator tab page
Although this application does not provide the full Fibonacci Probability chart and Mother Wave detection, the application should be able to provide you the functionality around the Fractal Decomposition and Fractal Cycle Analysis. Most importantly, it provides the turning point probability in both price and time dimension. Although you will not make your trading decision exclusively on the statistical prediction alone, statistical prediction provides huge advantage for your trading. With the statistical prediction, you can detect the extreme movement in the market accurately. In such case, you might point out the opportunity for the statistical arbitrage. This type of opportunity can happen at some extreme and conservative probability level.
The turning point probability is highly compatible with the market geometry analysis. You will not experience the compatibility problem like other statistical methods. For example, it is hard to utilize the prediction from the multiple regression while you are applying Elliott Wave or Harmonic Pattern analysis as well as other technical indicators for your trading. However, you can do all these seamless with the turning point probability because the statistical prediction is made at the point where we also draw Fibonacci pattern, Elliott Wave, Harmonic pattern and X3 price patterns. Remember how we taught that your intuition works in real life in this book. The geometric prediction, introduced in this book, mimic how the human intuition works in the scientific way. The core principle behind the geometric prediction is to combine the geometric and statistical analysis to create the simple and effective day trading method. With this tool, you can combine the statistical prediction from the turning point probability with the Fibonacci Ratio Analysis.

Figure 4.11-18: Statistical Prediction from Turning Point Probability
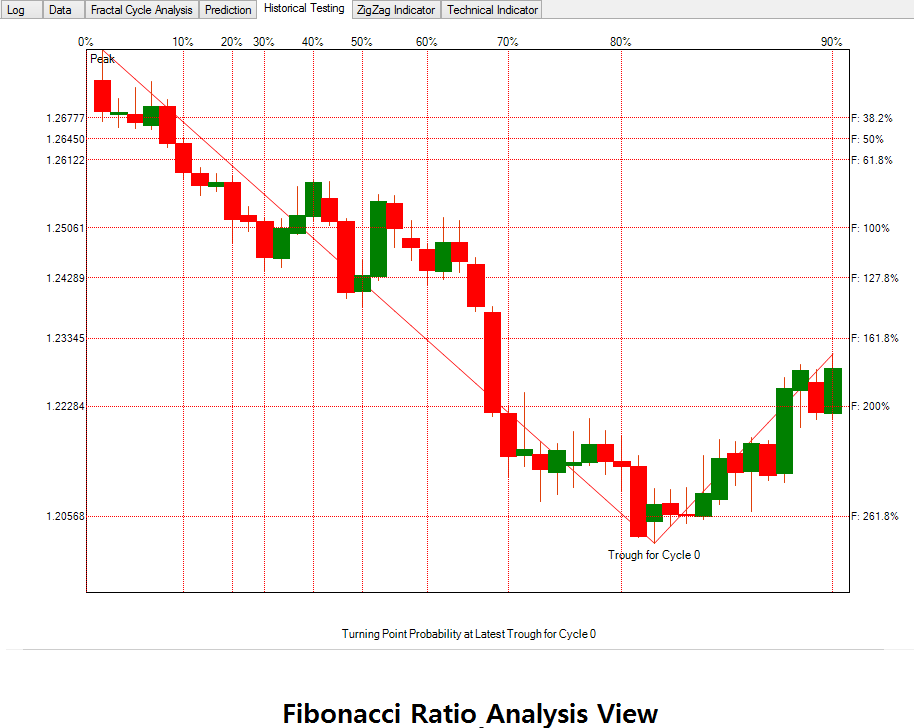
Figure 4.11-19: Geometric Analysis with Fibonacci Ratio
This tool is free for forever. Another good thing is that this tool is simple to use. You can use free financial market data source like Yahoo Finance and Google Finance to load any stock market data you want. In addition, MetaTrader 4 and MetaTrader 5 also provide the free Forex market data. You can save them as csv file or some sort in your hard drive. Then you can load them using “Load data from CSV File” menu. To bring the entire data loading option, use the right mouse click from Data tab page. When you load the data from the CSV file, you need to check how the data is formatted.
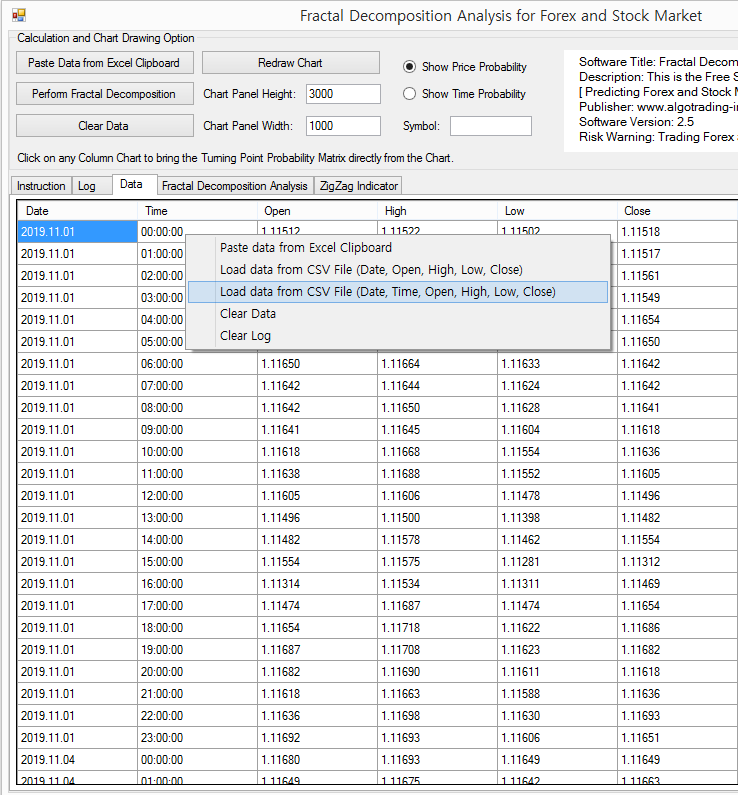
Figure 4.11-20: Load data from the CSV file
For example, we provided the some sample csv files including EURUSD_H1.csv and S&P500_Daily.csv file. EURUSD_H1.csv file was saved from MetaTrader 5 platform and S&P500_Daily.csv file was saved from Yahoo Finance. For EURUSD_H1.csv, use Date, Time, Open, High, Low, Close option. For S&P 500_Daily.csv file, use Date, Open, High, Low, Close option. If you are doubt, then open the csv file from the Notepad. You will find how they are structured. Choose the right option for the data structure. This free application can load csv file with three delimiters including tab, comma, and semicolon. It will automatically choose the right delimiter before loading the data. When the csv data structure is not supported, then try to load the data with the Excel clipboard option. You should also understand that you would need some data to calculate the multiple Fractal cycles. We recommend at least 1000 data points for minimum. You can load more data if you wish. However, more data you load, the tool can slow down because it requires using more CPU and memory of your computer.
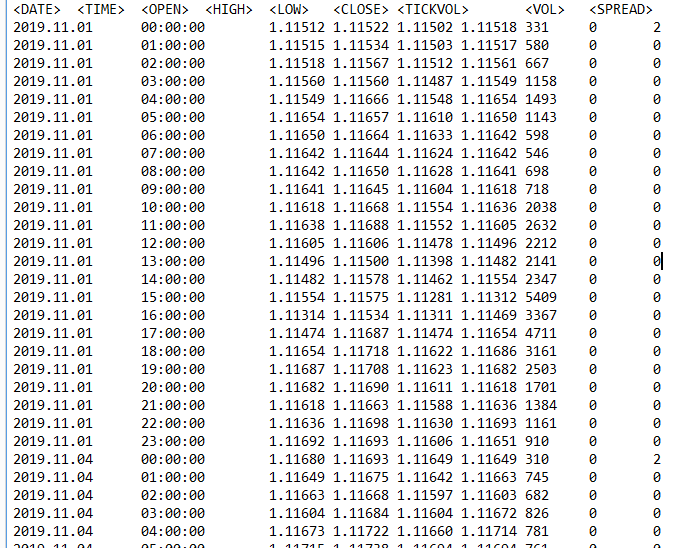
Figure 4.11-21: EURUSD_H1.csv file was opened in Notepad to check the data structure
Although this is probably the minor point, you can also control the number of decimal places in your chart. Sometimes, this is necessary. For example, in the US Stock market data, usually two decimal places might be sufficient. However, this is not the case for the Forex market. In the Forex market, you often need five decimal places. If you need to control the decimal places in the chart in the Prediction tab page, change the value in the “Symbol Digit” box. When you enter 5, it will show the numbers in the five decimal places.
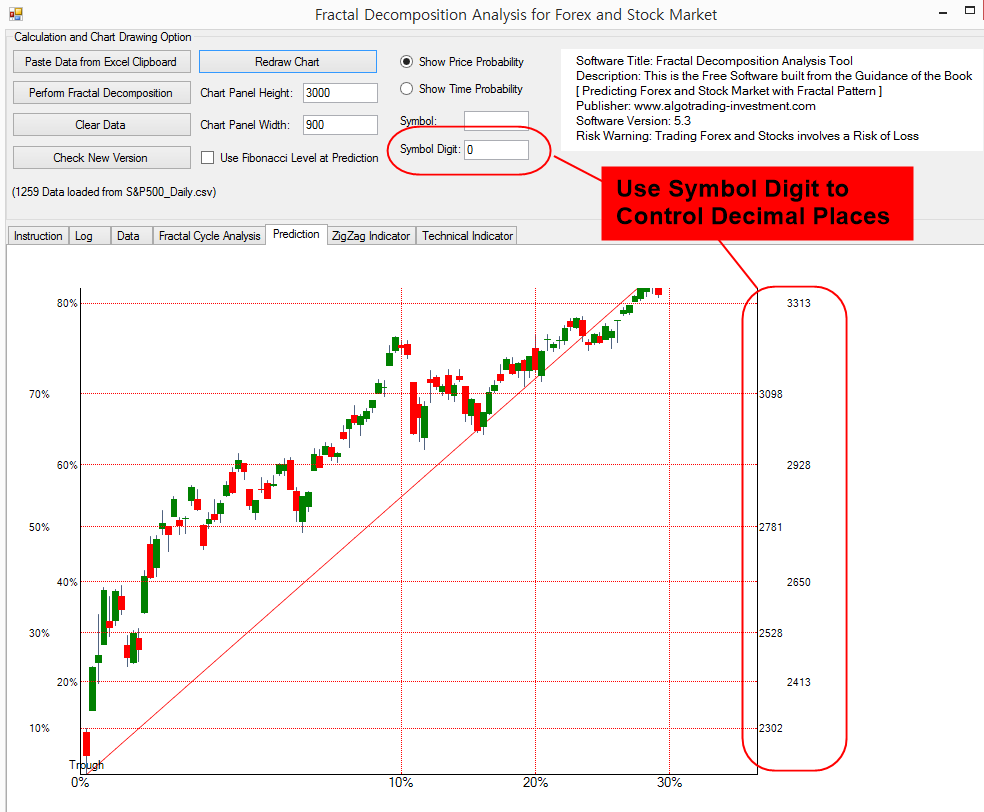
Figure 4.11-22: Control Decimal places of the labels in chart using Symbol Digit
The video tutorial below can be helpful in using the Fractal Decomposition Analysis Tool for Forex Market.
The video tutorial below can be helpful in using the Fractal Decomposition Analysis Tool for Stock Market.
You can also download this Free tool from several Software Distribution Site too. If you find it more convenient, then please use the link below:
About this Article
This article is the part taken from the draft version of the Book: Predicting Forex and Stock Market with Fractal Pattern. This article is only draft and it will be not updated to the completed version on the release of the book. However, this article will serve you to gather the important knowledge in financial trading. This article is also recommended to read before using Fractal Pattern Scanner, which is available for MetaTrader or Optimum Chart.
Below is the landing page for Fractal Pattern Scanner for MetaTrader 4 and MetaTrader 5. The same products are available on www.mql5.com too.
https://www.mql5.com/en/market/product/49170
https://www.mql5.com/en/market/product/49169
https://algotrading-investment.com/portfolio-item/fractal-pattern-scanner/
Below is the landing page for Optimum Chart. Optimum Chart, the powerful buy and sell trading signal generator.
https://algotrading-investment.com/2019/07/23/optimum-chart/
Related Products


