Turning Point
In Forex and Stock market, a turning point is a price level in which the market can change its direction from bearish to bullish or from bullish to bearish. If one can identify the turning point accurately, then he can make a good profit from his trading or from his investment. However, we can only identify the potential turning point using the techncial analysis. The trajectories of Financial Market movement are very much like the polynomial curvatures with the presence of random fluctuations. It is quite common to read that scientist can decompose the financial data into many different cyclic components. If or any if the financial market possess at least one cycle, then the turning point must be present for that financial market data. With this assumption, most of financial market data should possesses the multiple of turning points because they consists of many cyclic components typically. Here, we present the useful turning point detector for your trading. With added Market Profile features, you can detect the potential turning point with reasonable accuracy.
Turning Point Indicator Features
- You can apply this indicators to any time frame or any currency pairs
- Very simple to use
- Market Profile Calculation for daily, weekly and monthly
- Sound, Email alerts and Push notification.
- Fully automatic turning point detection with advanced mathematic algorithm
- Simple and easy to use
- Easy to expand with other trading system
- Great tool to add on your Price Action Trading Collection
Turning Point Indicator Description
Our turning point detector consists of abnormal movement detection system (main) and market range detector (supplementary). Abnormal movement detection have following user inputs:
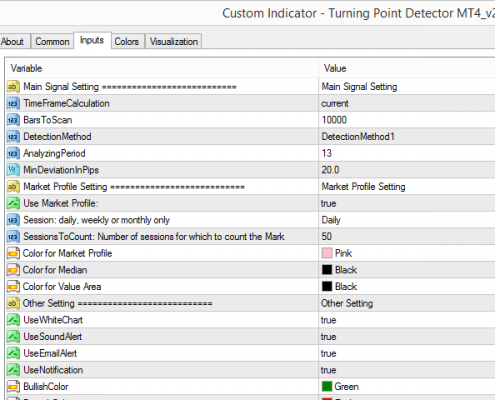
- TimeFrameCalculation: Timeframe to perform abnormal movement detection.
- BarsToScan: number of bars to apply the calculation
- DetectionMethod: There are three detection methods you can choose.
- AnalyzingPeriod: 13 is the default settings. Most of time, default setting works fine.
- MinDeviationInPips (=Minimum Deviation in Pips): this is the minimum condition to be qualified for abnormal condition. Typically, it is good to use one standard deviation of that currency pairs.
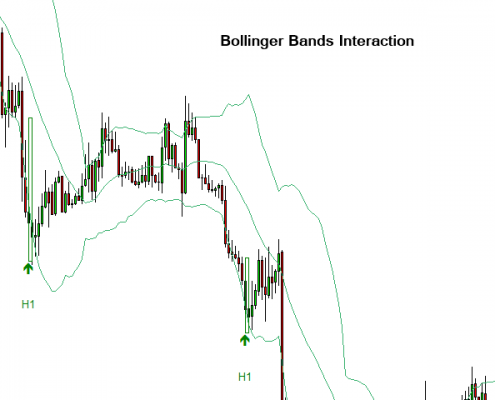
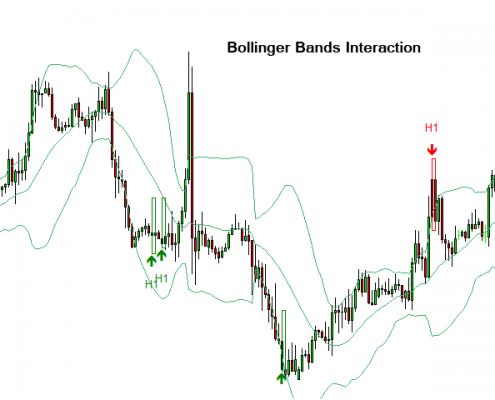
To detect market range, you can use Market Profile or Bollinger Bands or something else if you wish, the market profile have the following user inputs:
- Use Market Profile: true or false only. Set false, not to use Market Profile
- Session: daily, weekly or monthly only
- Sessions To Count: Number of sessions for which to count the Market Profile
Bollinger bands are one of the standard technical indicator for free of charge.
To construct the Market Profile, user should select timeframe accordingly:
- Daily Market Profile: M5 to H1 timeframe can be used. M30 is recommended.
- Weekly Market Profile: M30 to H4 timeframe can be used. H1 is recommended.
- Monthly Market Profile: H1 to D1 timeframe can be used. H4 is recommended.
There are also some other inputs:
- UseWhiteChart: true of false to set white background or use default black background chart
- UseSoundAlert: Use sound alert
- UseEmailAlert: Use email alert
- UseNotification: Use Push Notification
- BullishColor: Bullish Colour
- BearishColor: Bearish Colour
- LabelOffsetInPercent: timeframe label (i.e. H1, H4, D1, etc) offset in percentage of chart height
- ArrowWidth: directional arrow width
- LineWidth: Width of line for abnormal movement marker (Set to 0, disable the marker)
- DrawRectangle: Draw rectangle to market abnormal movement
- FillRectangle: Fill Rectangle (true or false only)
How to use
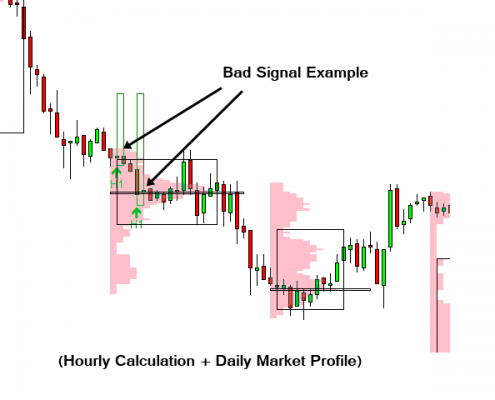
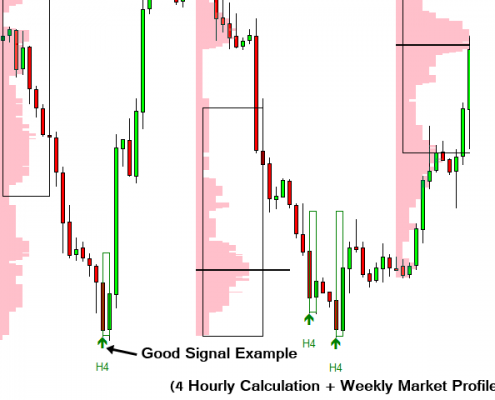
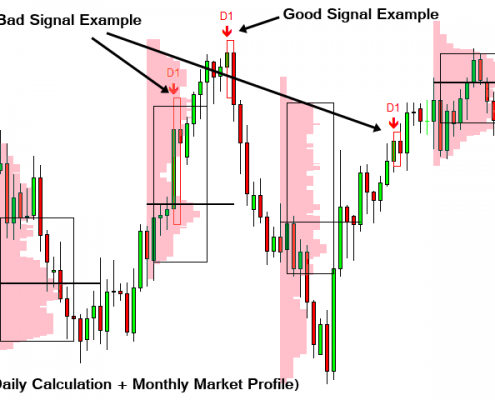
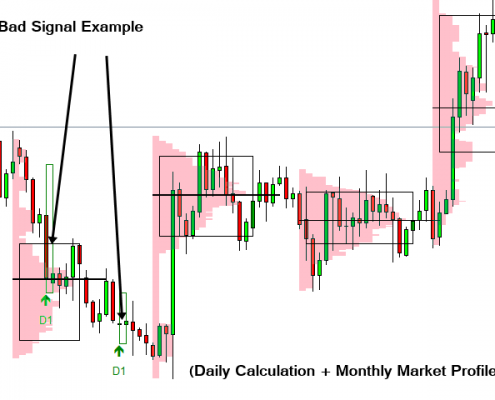
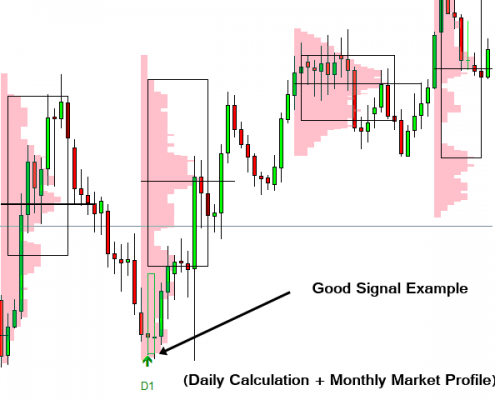
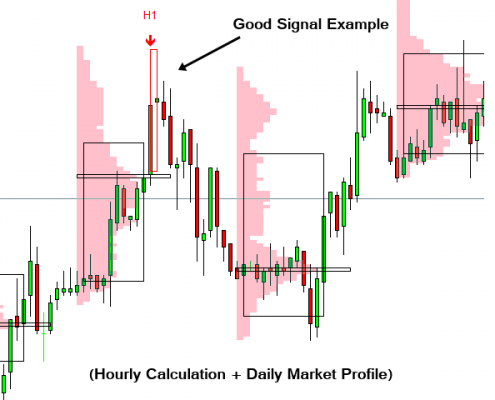
You might use the default setting for minimum deviation in pips. According to our experience, you can set sensible number for minimum deviation in pips such as one standard deviation or some commonly used values. For example, 20 pips (MinDeviationInPips) works well for major currency pairs in H1 timeframe. Detected abnormal movement is good sign of turning point. However, we recommend using it when the arrow appears reasonably outside the range. Also you might use several turning point detector with several time frame to one chart. For example, you can apply our Turning Point Detector in H1 and D1 timeframe to one chart. When you use multiple timeframe calculation, you must use sensible timeframe for Market profile too.
Further Note
Must understand that our Turning Point Detector is not the bullet proof system. If this system is carefully used with additional judgement, then this can become your favourite turning point indicator and can become part or all of your strategy. Please check it in the strategy tester before buying. You can use our Turning Point Detector alone or you can combine the Turning Point Detector with any of below trading system:
- Harmonic Pattern Plus
- Harmonic Pattern Scenario Planner
- Price Breakout Pattern Scanner
- Pair Trading Station
- Mean Reversion Supply Demand
Important Note
This product is the off the shelf product in the store. Therefore, we do not take any personal modification or personal customization request. For our products, we do not provide any code library or any support for your coding.
YouTube Video about Turning Point Indicator
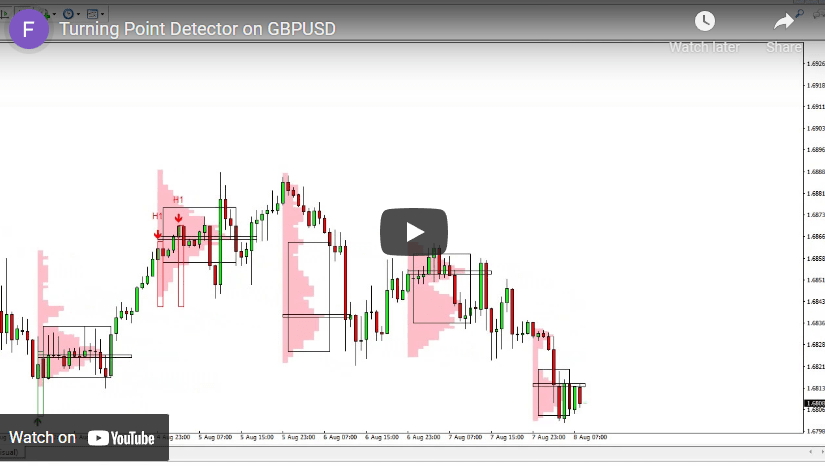
YouTube Link: https://www.youtube.com/watch?v=YJLzcgaA8qo
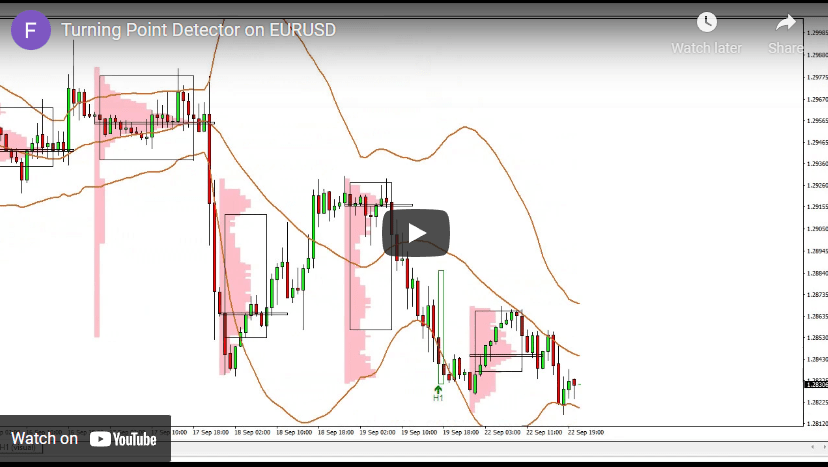
YouTube Link: https://www.youtube.com/watch?v=eUbilLd9HGA


