X3 Chart Pattern
X3 Chart Pattern is a framework for creating and trading various price patterns or chart patterns in Forex and Stock market. X3 Chart Pattern is based on the idea that price movements are driven by three factors including trend, momentum, and cycle. X3 Chart Pattern is advanced technique over other chart pattern technique like Harmonic Pattern, Elliott Wave Theory, and Chart Pattern as X3 Chart Pattern provides the systematic way of creating the profitable pattern like the big data analysis or data mining. For example, X3 Chart Pattern consists of three processes: formulating profitable pattern, testing profitable pattern and applying the pattern in real world to trade. Since X3 Chart Pattern help you to create and to test the profitable pattern efficiently, you can turn over the existing and new profitable pattern quickly into real world trading. Finally, you can trade X3 Chart Pattern using the trading zone concpet managing your risk and reward.
Creating Profitable Pattern
“X3 Chart Pattern” was born together with the RECF pattern framework, known as defining profitable pattern. X3 Chart pattern was initially developed to conduct the scientific research over the existing price patterns like Fibonacci price pattern, Harmonic Pattern and Elliott Wave Theory. Then it was developed further to improve over the limitations and weakness of the existing price patterns.
Firstly, all the previous pattern theory used points and lines as the main reference in their pattern structure. For example, in Harmonic Pattern, the main reference to its structure is the XABCD points. This letter is assigned to each point in the price pattern. In Elliott Wave, the main reference to its pattern structure is Wave 12345 and Wave ABC. Each number and letter in Elliott Wave represent the price swing at each wave. The building block of the ratio analysis over the price pattern is a triangle, which is made up from three zigzag points or two price swings. Hence, in the X3 Chart pattern, the main reference to the pattern structure is the triangles of the pattern instead of points and lines. When you have too many point and line references in the pattern structure, we will feel not easy as the number of lines and points are increasing in our chart. Hence, we are limited to study more complex patterns with points and lines. When you study the triangles of the price pattern directly, you can study more complex pattern structure with less overhead cost as well as with shorter expression.
Secondly, Fibonacci price pattern, Harmonic pattern, and Elliott Wave theory are Fibonacci number oriented. In regards to this point, here is some data present. We have created the distribution of Retracement ratios present in several currency data. This retracement ratio was counted after the price series was transformed to Peaks and Troughs. We can tell that some Fibonacci ratios are placed on top of distribution but some of the non-Fibonacci ratio like 0.55 or 0.66 was placed higher over 0.500 and 0.618 for EURUSD daily timeframe. In GBPUSD, the Golden ratio 0.618 occurrences is far below the 0.500 ratio. In USDJPY, it is rather 0.750 ratio was placed on top of this distribution.
Thirdly, the classic patterns have its fixed structure. For example, Harmonic pattern uses five points of XABCD (i.e. three triangles) and Elliott Wave pattern uses Wave 12345 (i.e. four triangles) as an impulse wave and Wave ABC (i.e. two triangles) as corrective wave. X3 Chart pattern allows you to readily modify their ratios to suit for the real world trading if you are not happy with the old ratios and if you feel the need for the improvement. In addition, X3 Chart pattern allows you to extend the pattern structure into more number of triangles readily. These features in X3 Chart pattern are important because the scientific trading is all about improving and fine-turning of what we have over time.
With the three points, we can tell that X3 chart pattern can provide the wider opportunity to find the profitable patterns. Still X3 chart patterns are based on the fractal wave analysis. Hence, X3 patterns share many similarities with Fibonacci price pattern, Harmonic pattern and Elliott wave patterns in terms of the trading application. Although under the X3 chart pattern framework, you could develop and create numerous price patterns to trade, we introduce five X3 chart patterns for the illustrative examples. These price patterns include Trident Pattern, Horse Pattern, Eagle pattern, Phoenix pattern, and star river pattern.
Testing Profitable Pattern for Existing Chart Pattern
In this section, we will cover how to turn the existing chart patterns like Harmonic Pattern and Elliott Wave Theory into X3 Chart Pattern to test and to put them in real world trading in Forex and Stock market.
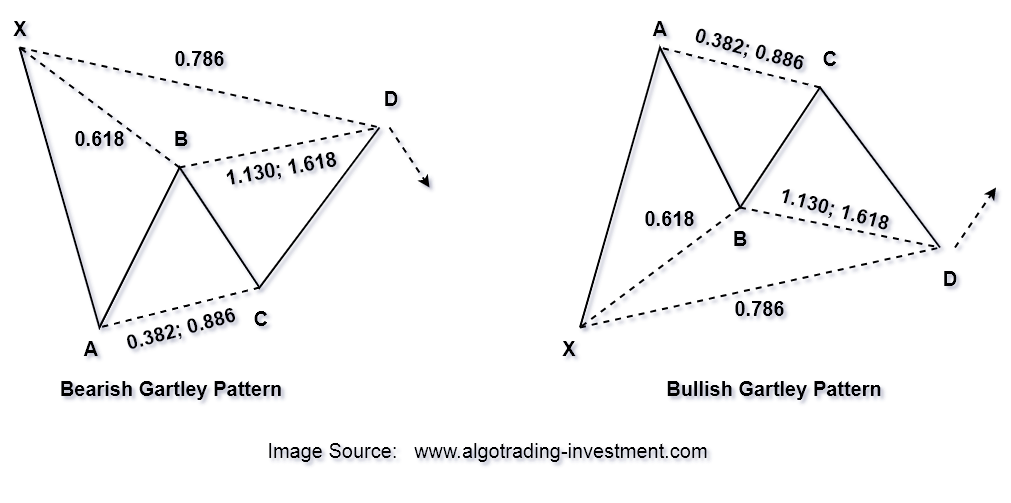
All the Harmonic Patterns can be formulated into X3 Chart Pattern to test and to put in real world trading. For example, Gartley Pattern can be formulated into two lines of text below in X3 Chart Pattern. Gartley Pattern has the three-triangle structure. The three triangles are enclosed by one bigger triangle with one closing retracement ratio. Pattern definition of Gartley Pattern can be described as below:
C0: 0.786 to T0: 3,
R0: 1.130 or 1.618, R1: 0.382 or 0.886, R2: 0.618
Now all you have to do is to put these two lines of text in the X3 Chart Pattern indicator and test them how they performed in the chart directly, also called “backtesting chart pattern with historical data”. If you think the pattern is less optimal in terms of the trading performance in backtesting in the chart, then you can fine tune the structure and retest in the chart. All you have to do is just to change the number slightly in the two line of texts below.
C0: 0.782 to T0: 3,
R0: 1.130 or 1.618, R1: 0.382 or 0.886, R2: 0.7
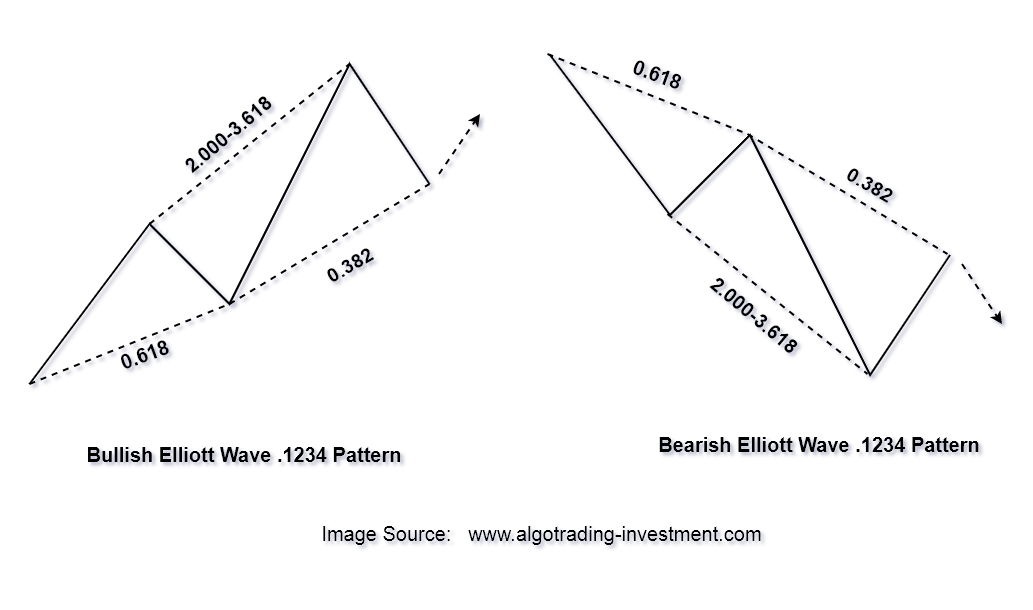
All the Elliott Wave Theory can be formulated into X3 Chart Pattern to test and to put in real world trading. For example, Elliott Wave .1234 pattern has the three triangles structure and there is no closing retracement ratio over the three triangles. We have set our retracement ratio 1 to 2.000-3.000 to ensure that Wave 3 is longer than the other wave.
R0: 0.382, R1: 2.000-3.618, R2: 0.618
Now all you have to do is to put one line of text in the X3 Chart Pattern indicator and test them how they performed in the chart directly, also called “backtesting chart pattern with historical data”. If you think the pattern is less optimal in terms of the trading performance in backtesting in the chart, then you can fine tune the structure and retest in the chart. All you have to do is just to change the number slightly in the one line of texts below.
R0: 0.382, R1: 2.000-3.618, R2: 0.618
Testing Profitable Pattern for New Chart Pattern
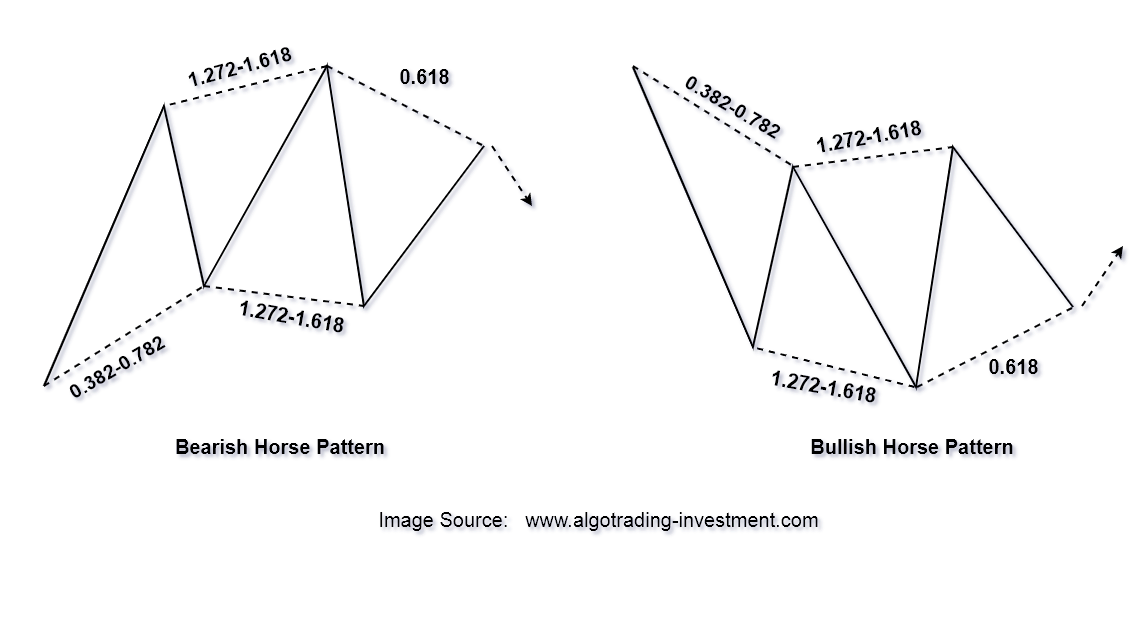
X3 Chart Pattern can be used to create totally new profitable pattern. For example, Horse Pattern can be considered as the refinement of the diamond pattern found in 231 page of the Gartley’s Book: “Profits in the Stock Market”. Gartley pattern is so popular harmonic pattern. However, diamond pattern is much less popular. So we decided to bring the diamond pattern from the same arthur to the trading community with profitable pattern structure. Horse Pattern has the structure of four triangles. It does not have closing retracement ratio over four triangles. This is the structure of Horse Pattern expressed in the pattern definition:
R0: 0.618, R1: 1.272-1.618, R2:1.272-1.618, R3: 0.382-0.782
Now all you have to do is to put one line of text in the X3 Chart Pattern indicator and test them how they performed in the chart directly, also called “backtesting chart pattern with historical data”. If you think the pattern is less optimal in terms of the trading performance in backtesting in the chart, then you can fine tune the structure and retest in the chart. All you have to do is just to change the number slightly in the one line of texts below.
R0: 0.618, R1: 1.618, R2:1.272, R3: 0.382-0.782
Although we have brought the horse pattern from the Gartley’s Book: “Profits in the Stock Market”, you do not have to bring the profitable pattern from the book always. You can even bring the profitable pattern from your own theory. When you create new profitable pattern, all the question you have to ask is ” is the pattern profitable in backtesting with historical data in the chart and is that pattern ready to trade in real world Forex and Stock market ?” If they are ready, then put them in your trading to make profits.
Trading Profitable Pattern in Forex and Stock Market (Understand Trading Zone)
In this section, we will compare the Trading Zone vs Support Resistance in terms of technical analysis used in Forex and Stock market. First of all, let us cover some basics of support and resistance. Support and resistance are the important technical analysis that help traders identify potential price movements to ensure picking up the right entry and exit points in the Forex market. Support Resistance are based on the idea that prices tend to bounce back or break through certain levels where the balance of supply and demand shifts. We provide the classic information on how support and resistance work. You will read this information in mind that we will introduce trading zone concept after.
- Support is a price level where the price tends to stop falling and reverse, because the demand is greater than the supply. Support indicates a concentration of buyers who are willing to buy at that level.
- Resistance is a price level where the price tends to stop rising and reverse, because the supply is greater than the demand. Resistance indicates a concentration of sellers who are willing to sell at that level.
- Support and resistance levels can be used to determine the overall trend and sentiment of the market, as well as the optimal time to enter or exit a trade. Traders can trade the bounce or the break of these levels, depending on their strategy and risk appetite.
- Support and resistance levels are dynamic and can change over time, depending on the market conditions and the trader’s perspective. Support Resistance can also be broken or violated, which can signal a continuation or reversal of the trend.
These four points are the some basis for support and resistance. Over years, we have done a lot of experiments in Forex and Stock market using the technical analysis. We found that support and resistance are the great tool but with one obvious disadvantage. The disadvantage is that levels or lines are difficult to manage the trading risk. When we think more than 50% of trading practice comes down to the risk management, the classic support and resistance might have some limitation.
Hence, trading zone in technical analysis is the extended concept to improve the classic support and resistance levels. The trading zone is the great tool to decide your trading entry and exit as well as managing your risk and reward. Deciding entry and exit with the trading zone is almost the same as using the support and resistance. Only difference is that they provide the sizable price range so that you can manage your entry and exit with your planned risk reward ratio. Trading zone is not new idea but this trading zone can improve your support and resistance trading. We strongly recommend to use the trading zone for your technical analysis.
Especially, when the trading zone is drawn around the significant peak and trough, the value for the trading zone is precious. When you use Harmonic Pattern or X3 Chart Pattern, the trading zone can be identified using the Pattern Completion Interval. The detailed process is well described in the Book: Guide to Precision Harmonic Pattern Trading (2016). When you use the supply demand analysis, the zone is identified from the base location. Especially, it is even better if the trading zone is non repainting. The non repainting zone become the powerful tool to decide the entry and exit for your trading because they stay in the location always as the reference.
https://play.google.com/store/books/details?id=8SbMDwAAQBAJ
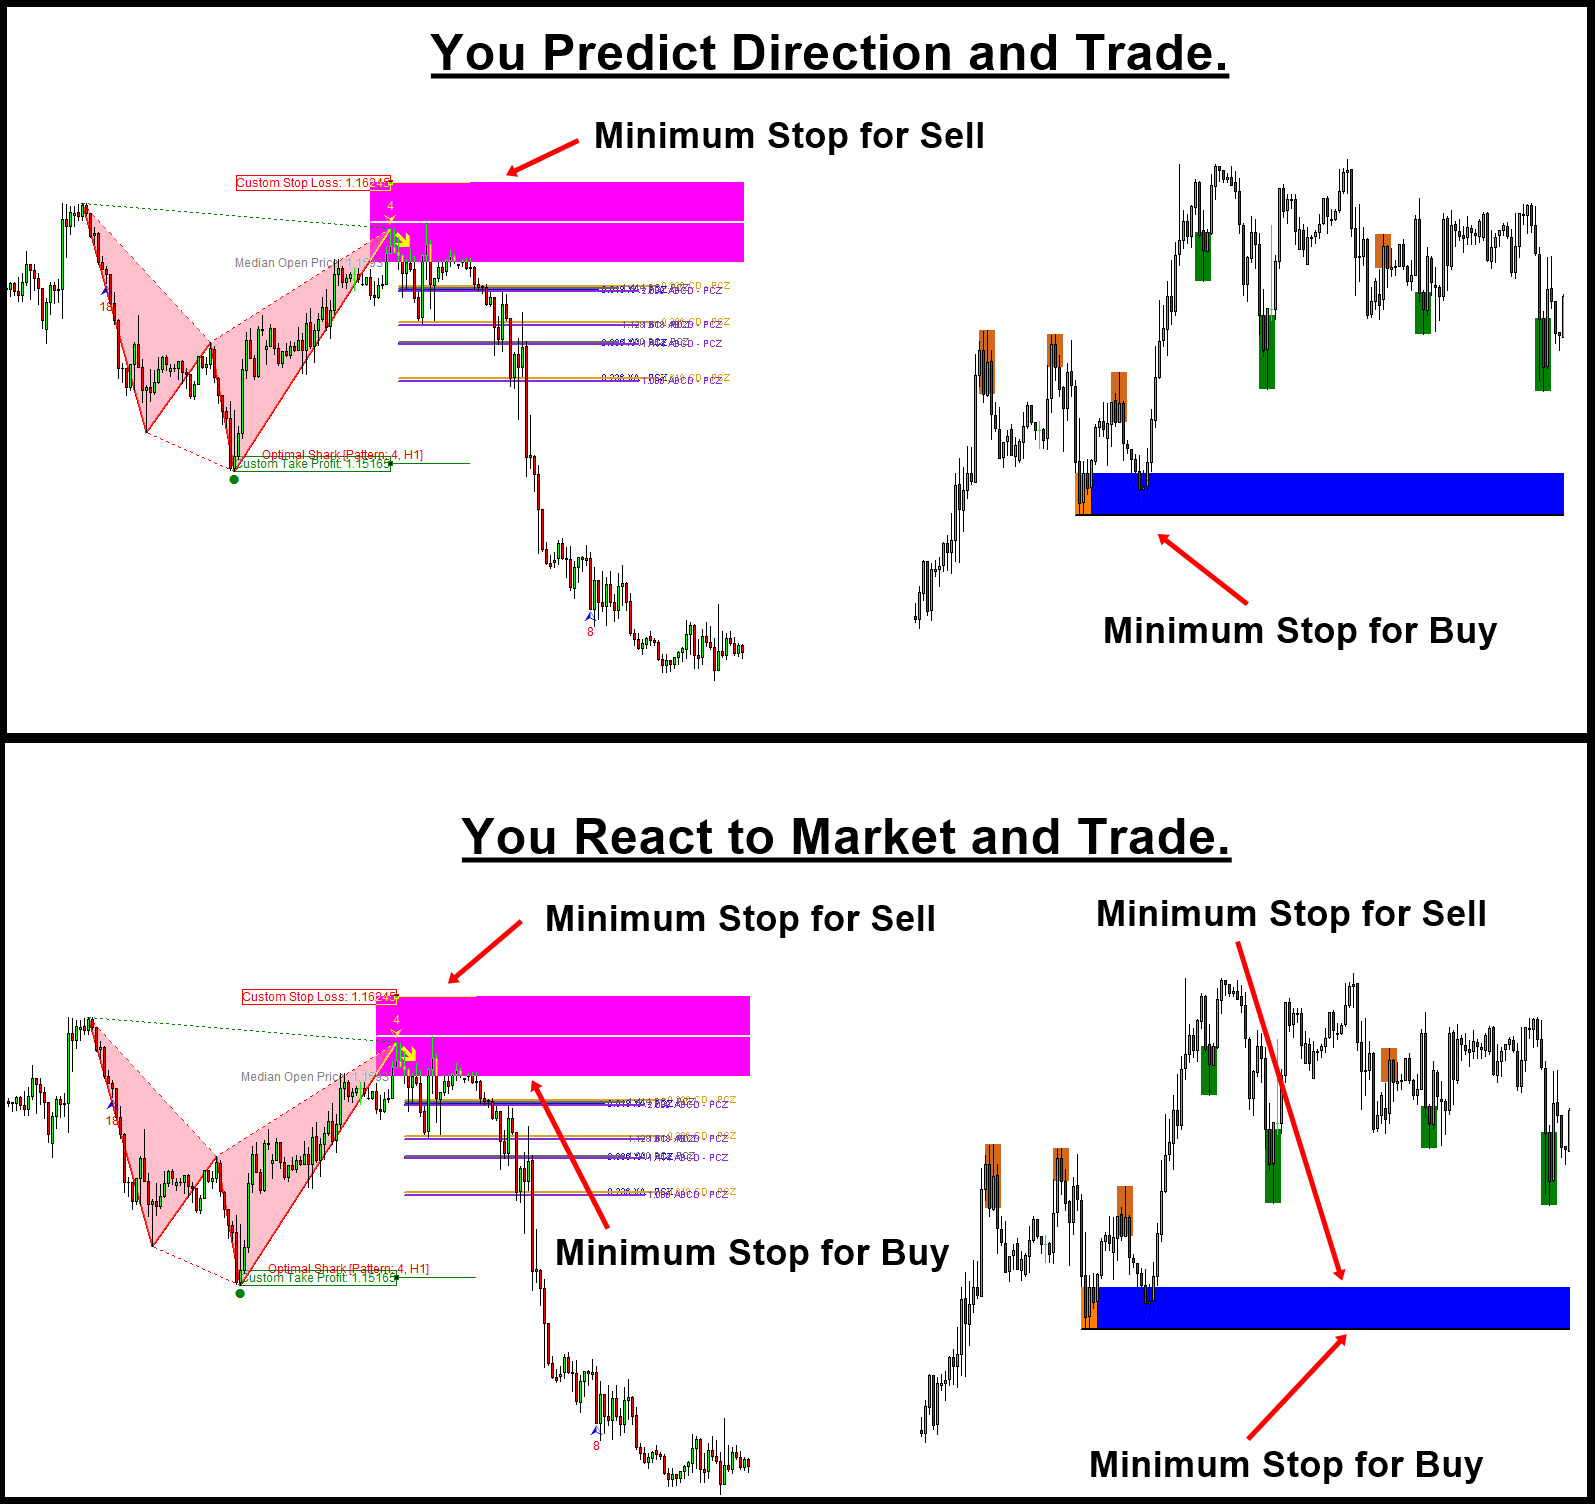
The trading zone is useful if your trading strategy is based on predicting the market direction. In such a case, the trading zone can provide a sensible place for stop loss. Then you can scale up your take profit target according to your anticipated location. Even if your trading strategy is not based on predicting market direction, the trading zone is still useful. For example, let’s say that you never want to predict the market, but you want to react the market so that you will trade in the direction in which the price is pushed by crowd like support and resistance style. In this case, the trading zone acts like the horizontal support resistance. But the managing your reward and risk is much easier than other mean of support and resistance.
I used the word minimum stop loss instead of the stop loss because sometimes, you might need to make your stop loss slightly bigger than the actual zone. The margin for the stop loss will be depending on your reward to risk ratio. How this reward to risk system works is well described in the latest book: Technical Analysis in Forex and Stock Market (2021).
https://play.google.com/store/books/details?id=pHlMEAAAQBAJ
For your trading in Forex and Stock market, we provide the detailed performance for each X3 Chart Pattern. You can download PDF file for each pattern from the link below. Or you can visit the YouTube video to check each pattern from the link below. Each PDF or YouTube video will provide you a proof for the X3 Chart Pattern. At the same time, you can use this proof to improve the given structure of the X3 Chart Pattern.
Horse Pattern: https://algotrading-investment.com/2022/06/30/horse-pattern-x3-chart-pattern/
Eagle Pattern: https://algotrading-investment.com/2022/06/30/eagle-pattern-x3-chart-pattern/
We also provide the great trading education about X3 Chart Pattern. You can have a look at following books to learn how to best use X3 Chart Pattern for your trading in Forex and Stock market. From these books, you will also find the X3 Chart Pattern framework that helps you to study, prove and improve X3 Chart Pattern to maximize your trading performance.
Guide to Precision Harmonic Pattern Trading
Link: https://algotrading-investment.com/portfolio-item/guide-precision-harmonic-pattern-trading/
Science Of Support, Resistance, Fibonacci Analysis and Harmonic Pattern
Profitable Chart Patterns in Forex and Stock Market

Related Products


