Prediction with Fibonacci Analysis for Free
This short article will provide some guide on how to use the Forex Prediction with Fibonacci Analysis for your Forex Trading at full potential. First of all, anyone can access the Forex market prediction from the link below for free. It will show you the Forex Predictions scanned across all symbols in one page, which is handy for Forex trader.
Click to Access Free Forex Market Prediction
or use the link below to access Free Forex Market Prediction
https://algotrading-investment.com/Operation/DataFolder2/ScanTurningPointPredictionV1.html
In the prediction web page, you will find a prediction table with some columns. The table will show you what is the latest status of the market + it will also tell what is the chance that the market can make a turning point probability. For your information, the trend probability can be obtained by 1 – turning point probability as a rule of thumb. These two probabilities can help you to locate your reversal trading and trend trading (or breakout trading) in the right timing.
Next, let us check the what is real benefit of these Forex Prediction. Not all the market prediction is friendly and useful for your trading. Most of statistical predictions are not compatible with the actual trading strategy used by the real world trader. However, the turning point probability (and also the trend probability = 1 – turning point probability) is useful because the predictions were measured from the Fractal Wave. Remember that many good and important technical analysis are derived from Fractal Wave too. For example, Support, Resistance, Fibonacci Ratio Analysis, Harmonic Pattern, Elliott Wave Theory, X3 Chart Pattern, Symmetric Triangle Pattern, Rising Wedge Pattern, Falling Wedge pattern, Double Top, Double Bottom, Channel, Renko Chart and so on are such technical analysis derived from Fractal Wave. You can consider the turning point probability as the quantified version of the price patterns. Hence, using the turning point probability along with these price pattern is really beneficial in assessing the trend strength and risk for your trading.
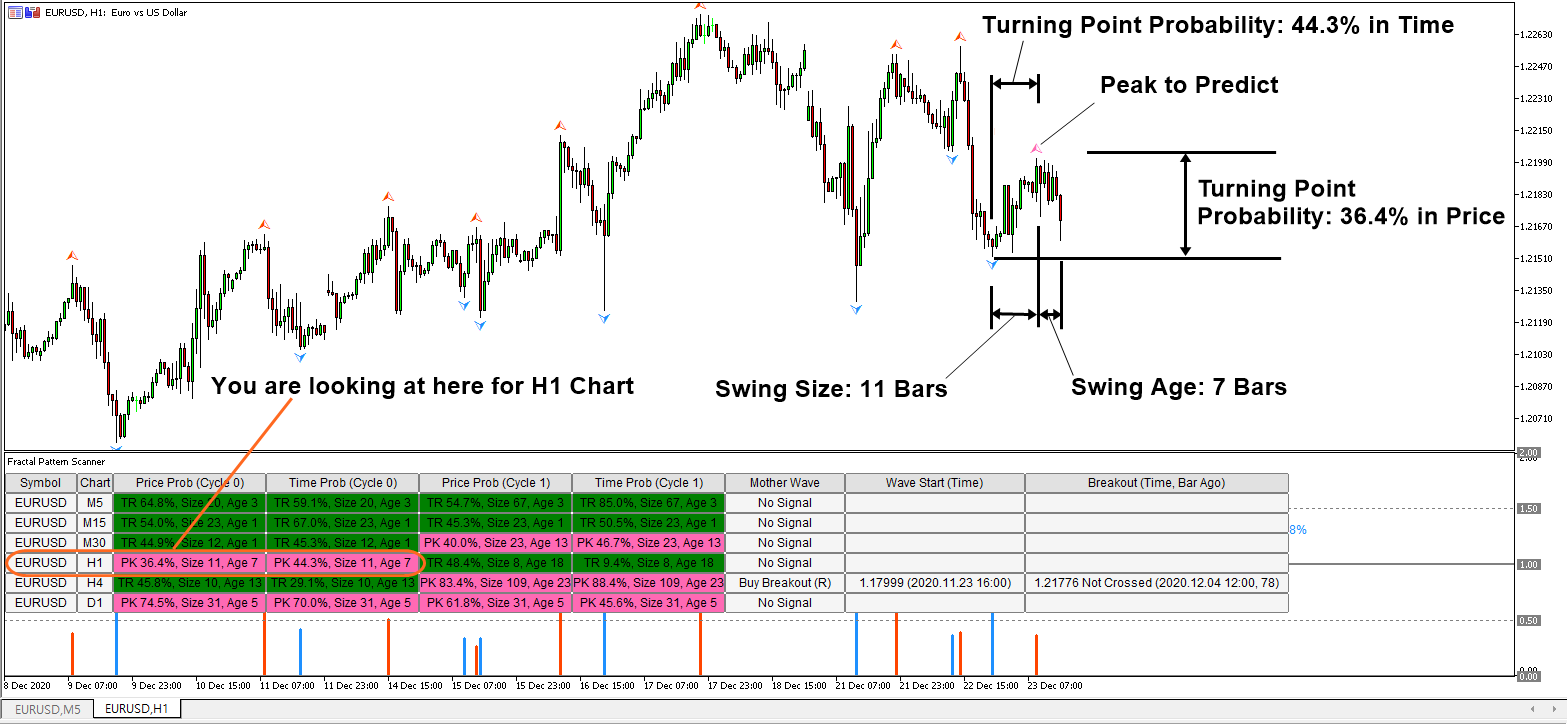
Next, to use the prediction for your trading, you need to understand how to use the prediction table. Each row in the table is basically showing two coordinates of price and time for the price swing + the turning point probability in price and time. Check the screenshot below to make sense of these numbers.
- Coordinate 1 for your chart: price at swing left and time at swing left
- Coordinate 2 for your chart: price at swing right and time at swing right
- Turning Point probability in price and time measured from Fractal Wave

In addition, you can have a look at the next screenshot to figure it out how the turning point probability works in your chart. In this screenshot, we show the swing size and swing age too.
Visualize Forex Prediction with Fibonacci Analysis
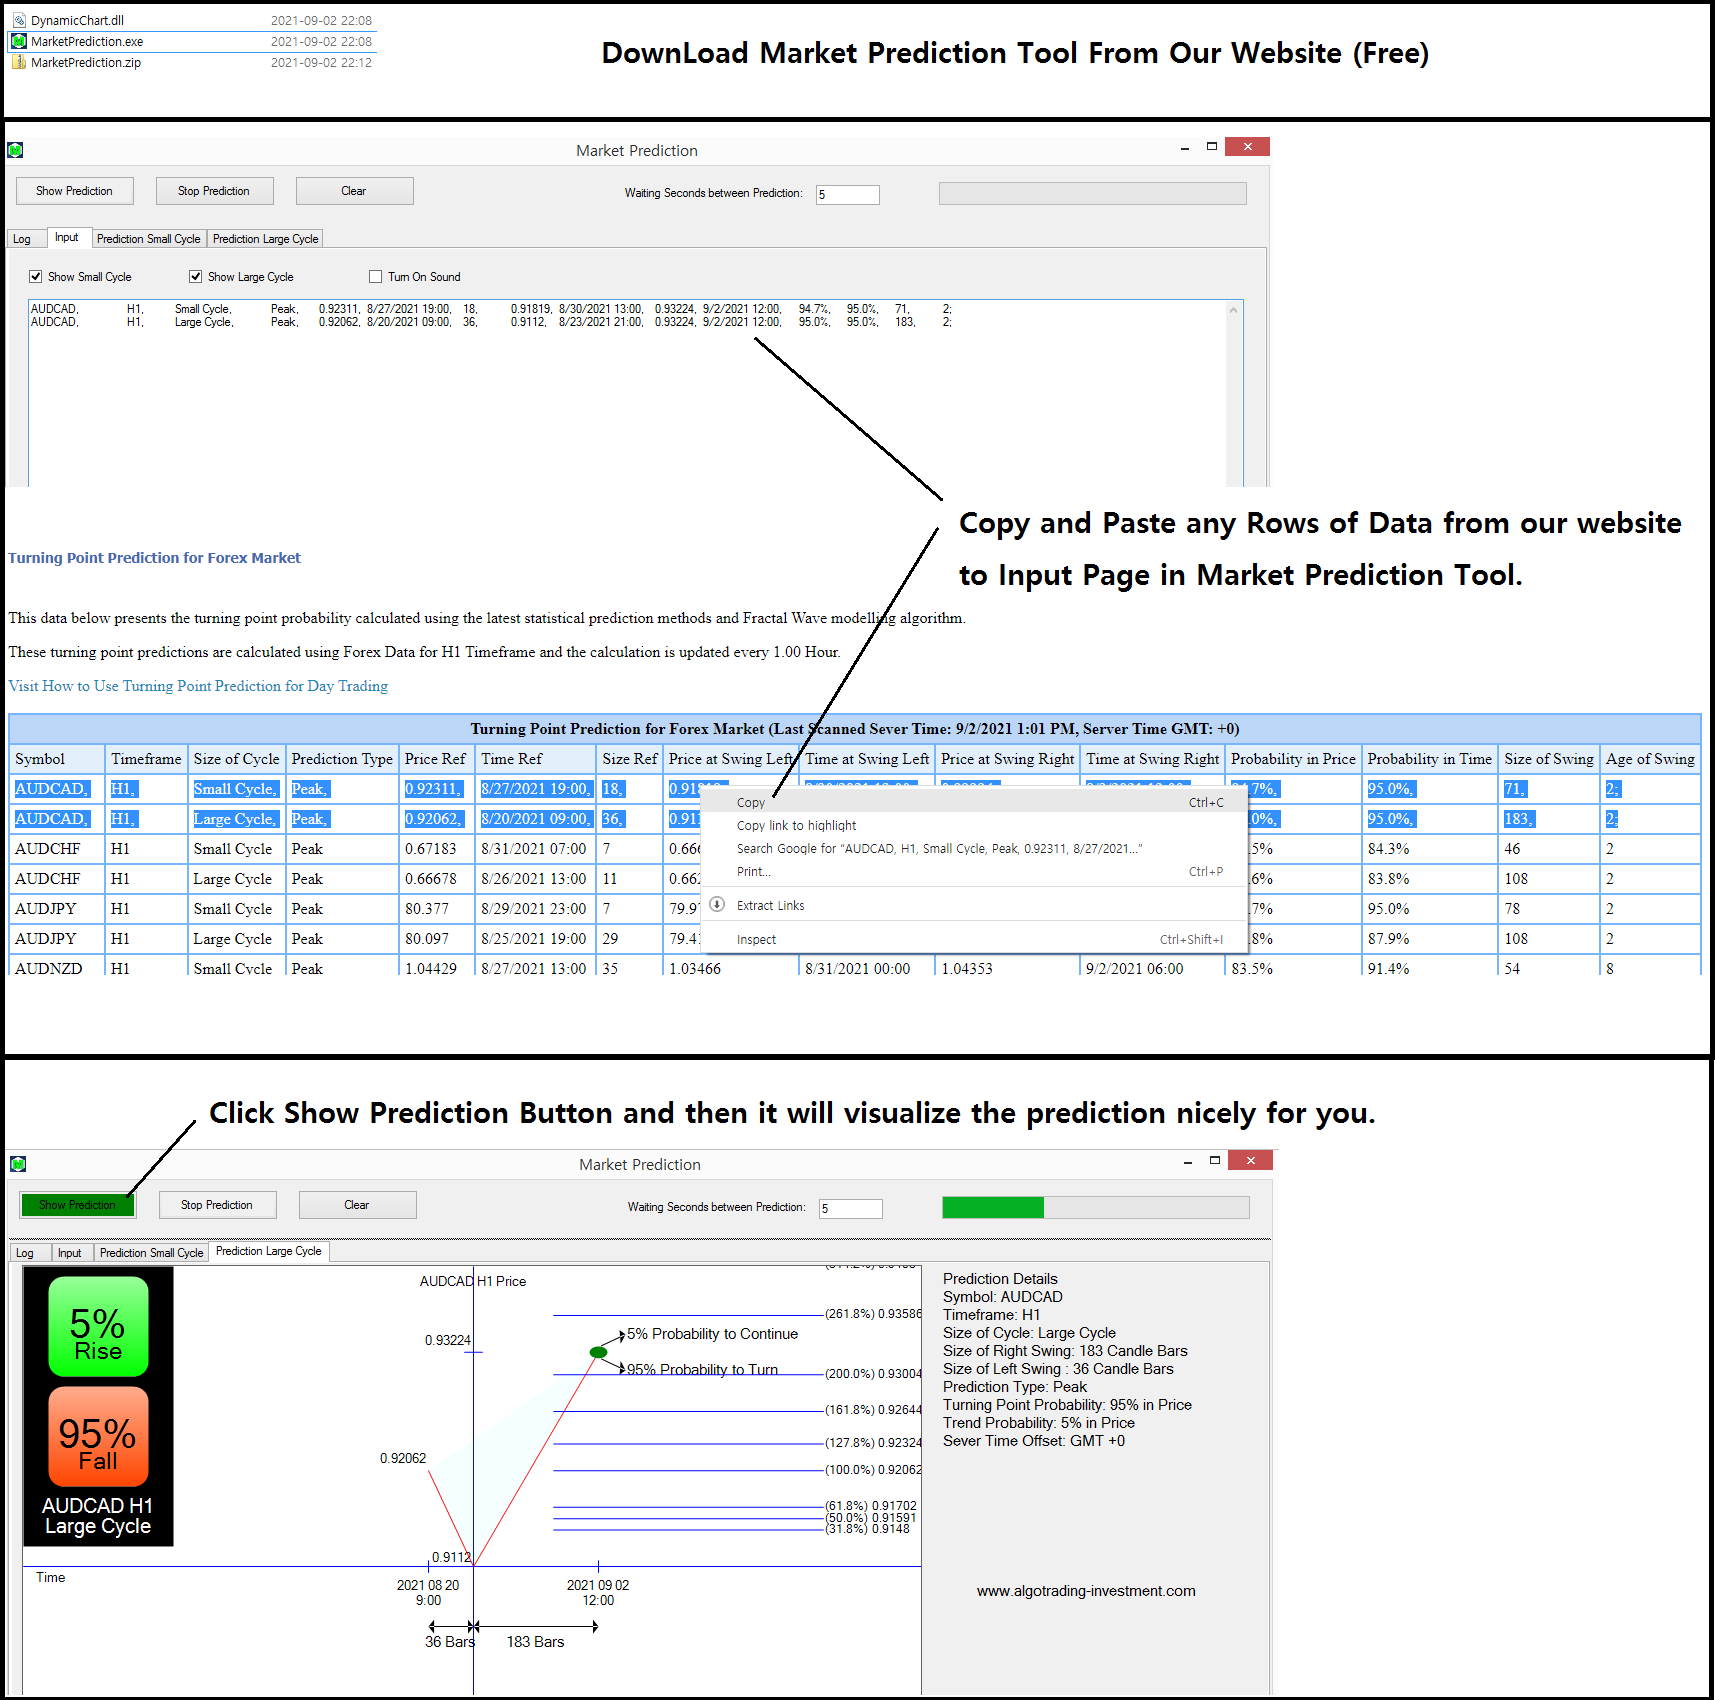
Next, You can use our Automatic Market Prediction Tool to visualize the turning point probability and Fibonacci Analysis. You can download the prediction tool from the google drive below. It is free and simple to use. No registration or signup is required. Plus it is perfectly safe tool to use.
https://drive.google.com/file/d/1hzM8FBCMW1ZcVeMhwLTV7TEFM65o3AKg/view?usp=sharing
Interpreting Prediction for Your Trading
Next, we will talk about the interpreting the probability because at this interpreting stage, you will actual make buy and sell trading decision. First of all, these predictions is not meant to be used alone except the case of the pure statistical arbitrage in its extreme probability. Normally, the prediction can yield better results when they are combined with the technical indicators, price patterns, fundamental analysis and so on. Especially, the turning point probability is a great tool to improve your horizontal support resistance. In this article, we will explain in terms of fibonacci analysis because fibonacci analysis is built inside this prediction tool already. The prediction can be used with all sort of trading strategies like breakout trading, trend following, reversal trading, news trading and so on. To apply the prediction for your trading, you need to understand three important points.
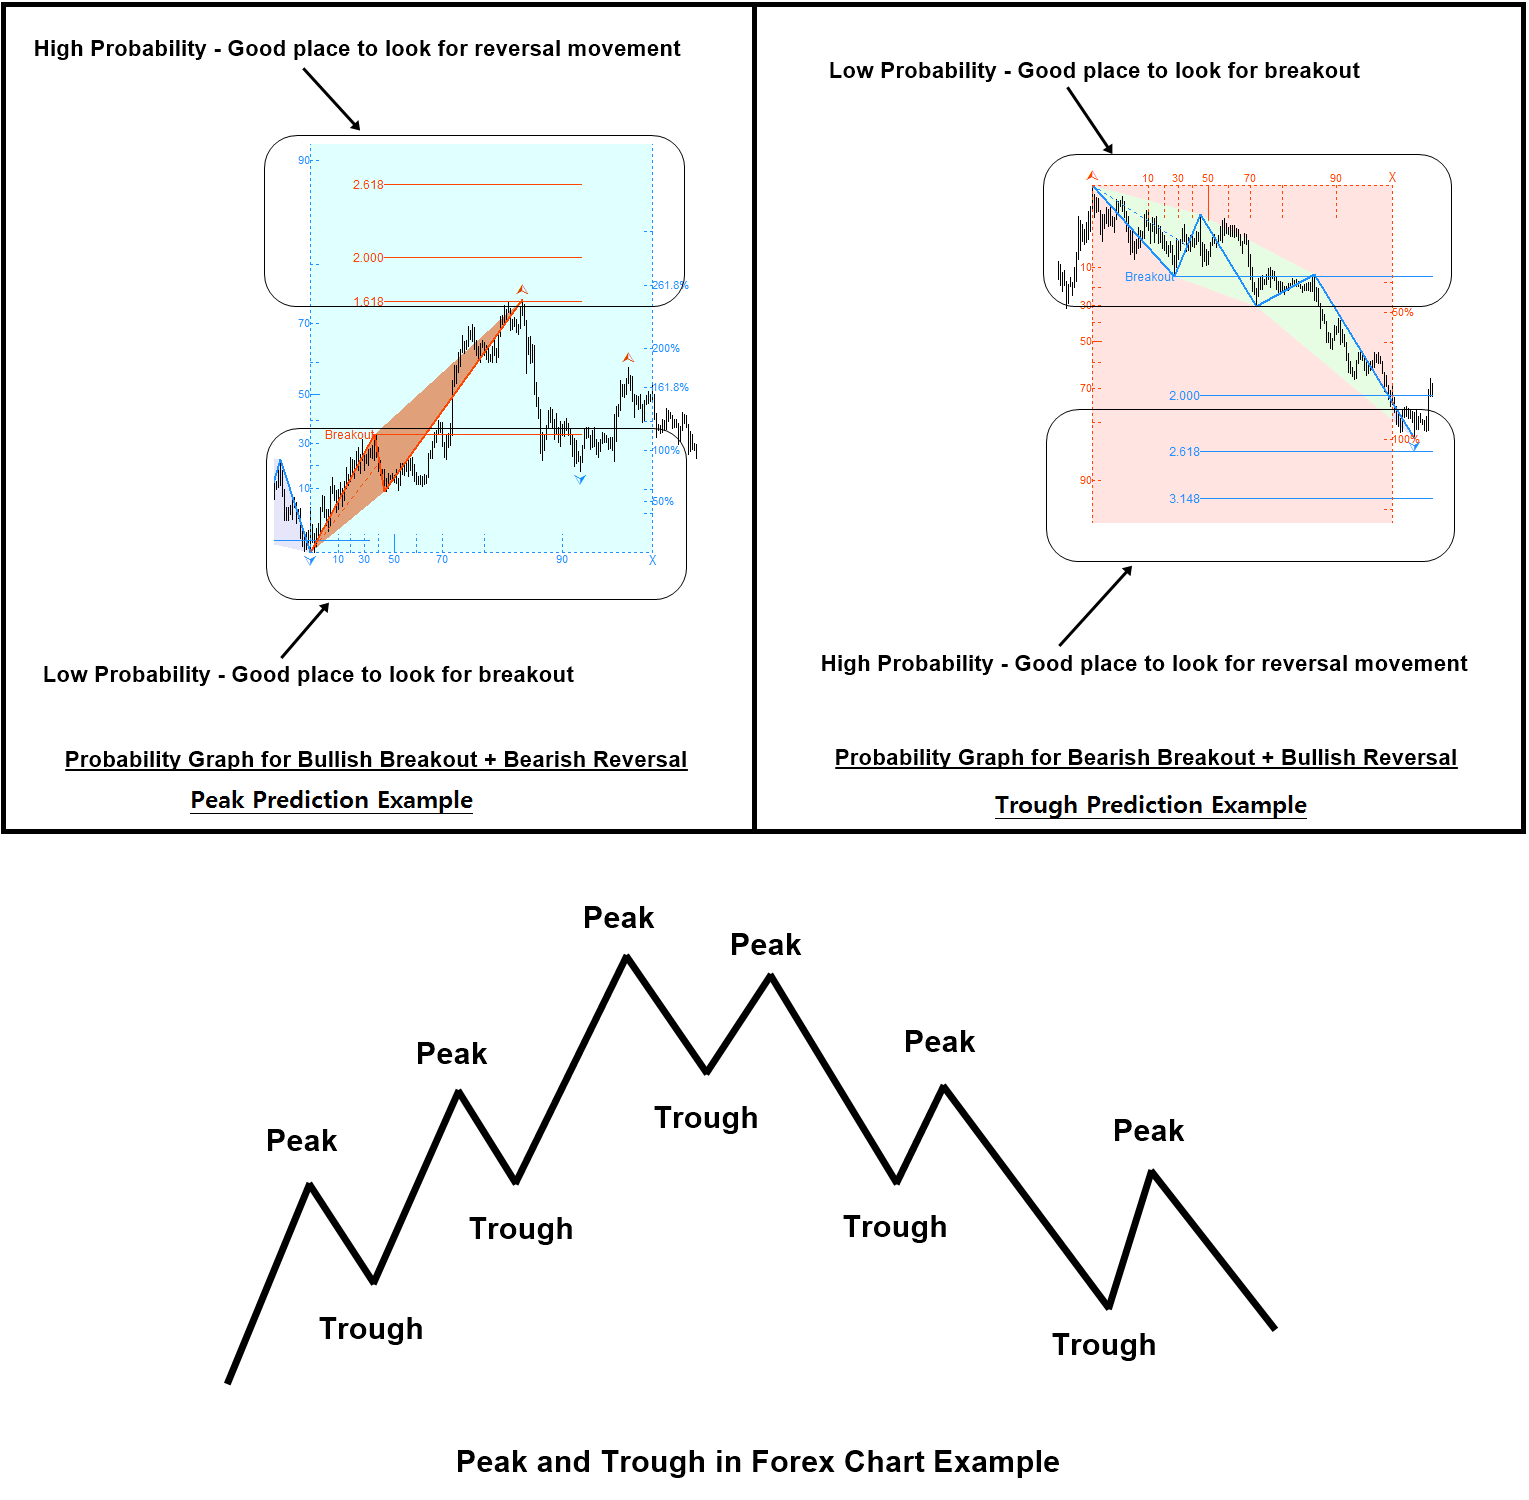
- Point 1: In low probability area, the price have a better chance to continue in the same direction in the current price swing.
- Point 2: In high probability area, the price have a better chance to reverse (i.e. make the turning point)
- Point 3: Statistical arbitrage only should be used when price hit extreme probability.
After you have understand all three points, use the provided Fibonacci analysis as the horiznotal support and resistance to decide your entry. In fact, this prediction tool is the fastest prediction generator for its simplicity. You can use them for short listing your trading opportunity before you go on to more detailed analysis. How does this sounds ? Then enjoy this free Forex Prediction with Fibonacci Analysis.
Start with Price probability first. Using the time probability is optional although the time probability can provide some additional information on top of price probability in many cases.
For example, if you are trying to apply a breakout trading or trend following strategy, then it is better to look for these opportunities with the price probability below 50%. Likewise, if you are trying to apply reversal trading strategy or try to pick up the turning point, then it is better to look for these opportunity with the price probability above 70%. This will improve the accuracy of your trading in long run.
It is even possible to take some statistical arbitrage opportunity because the predictions are based on the probability. Some possible idea might be taking the breakout opportunity at extremely low probability like 10% or below. Likewise, when extremely high probability over 95%, you might be able to take the reversal position. Statistical arbitrage is harder than normal trading because you need to understand both statistics and trading domains. In addition, you need to be really fast with statistical arbitrage. Hence, we only recommend to use the statistical arbitrage if you are sufficiently disciplined in both area. For your information, Age of Swing column shows the number of candle bars from the latest highest high or lowest low to current candle bar in the chart.
Turning Point Probability with Support and Resistance
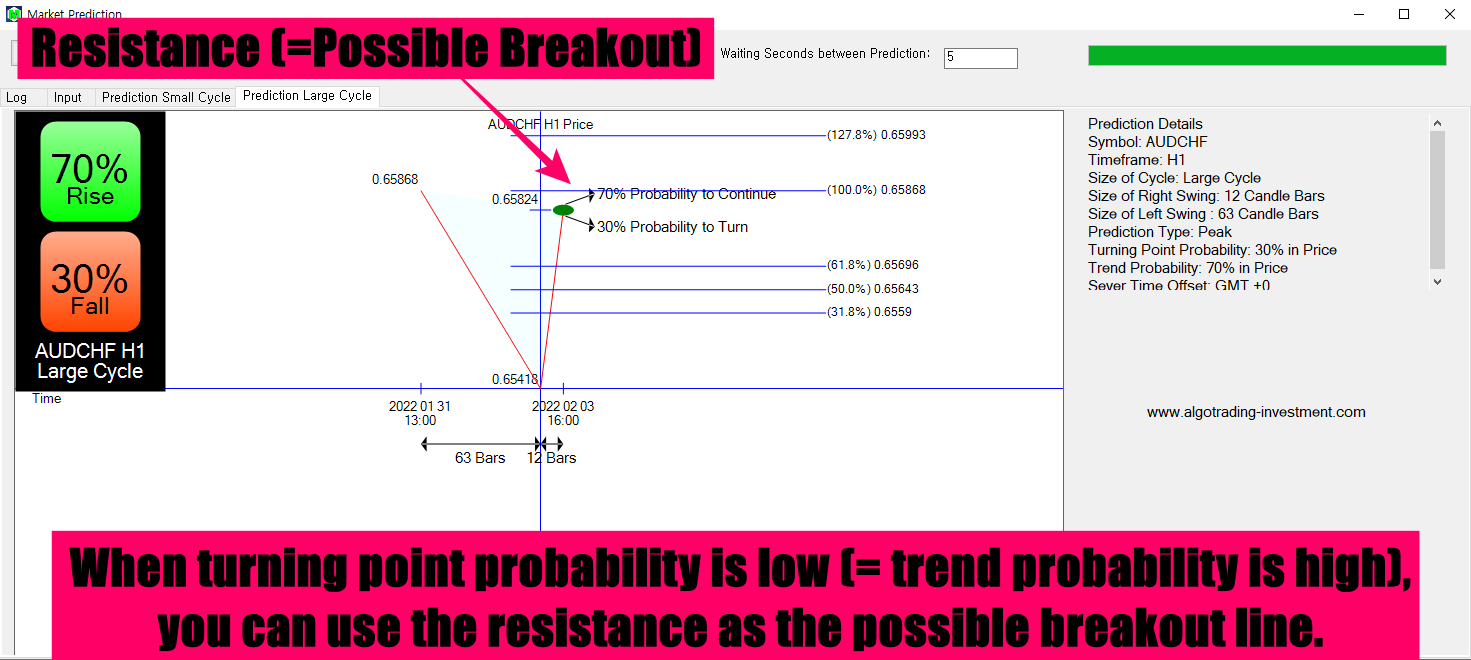
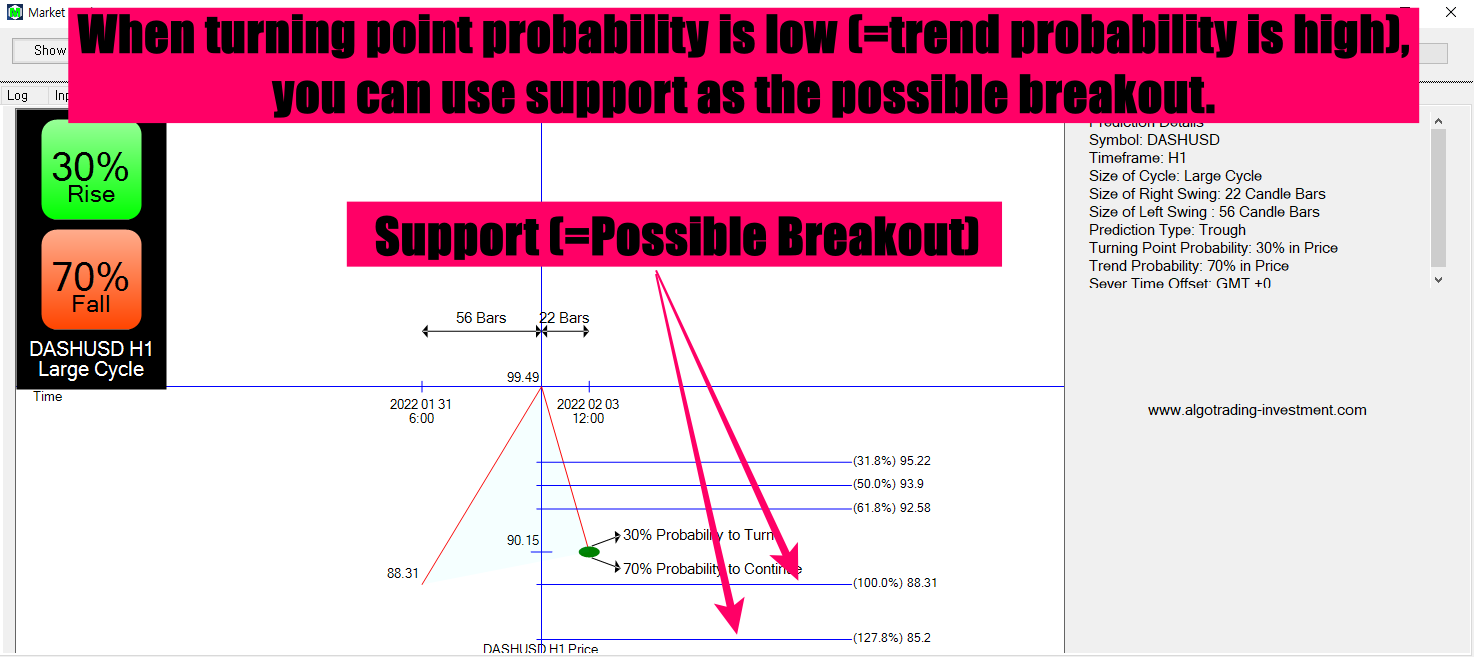
Now, let us have a look how to apply Forex Prediction with Fibonacci Analysis. There are two possible cases to look at. Firstly, we can have a look at the case in which turning point probability is low. This means the trend probability high as the trend probability is roughly equivalent to 100% – turning point probability. Depending on the current price is peak or trough, we might have to use support or resistance to predict the breakout movement.
In the screenshot below, you can see the turning point probability for AUDCHF is low and it is currently showing the peak. Hence, I have shown the resistance price level which could provide the potential breakout entry.
In the screenshot below, you can see the turning point probability for DASHUSD is low and it is currently showing the trough. Hence, I have shown the support price level which could provide the potential breakout entry.
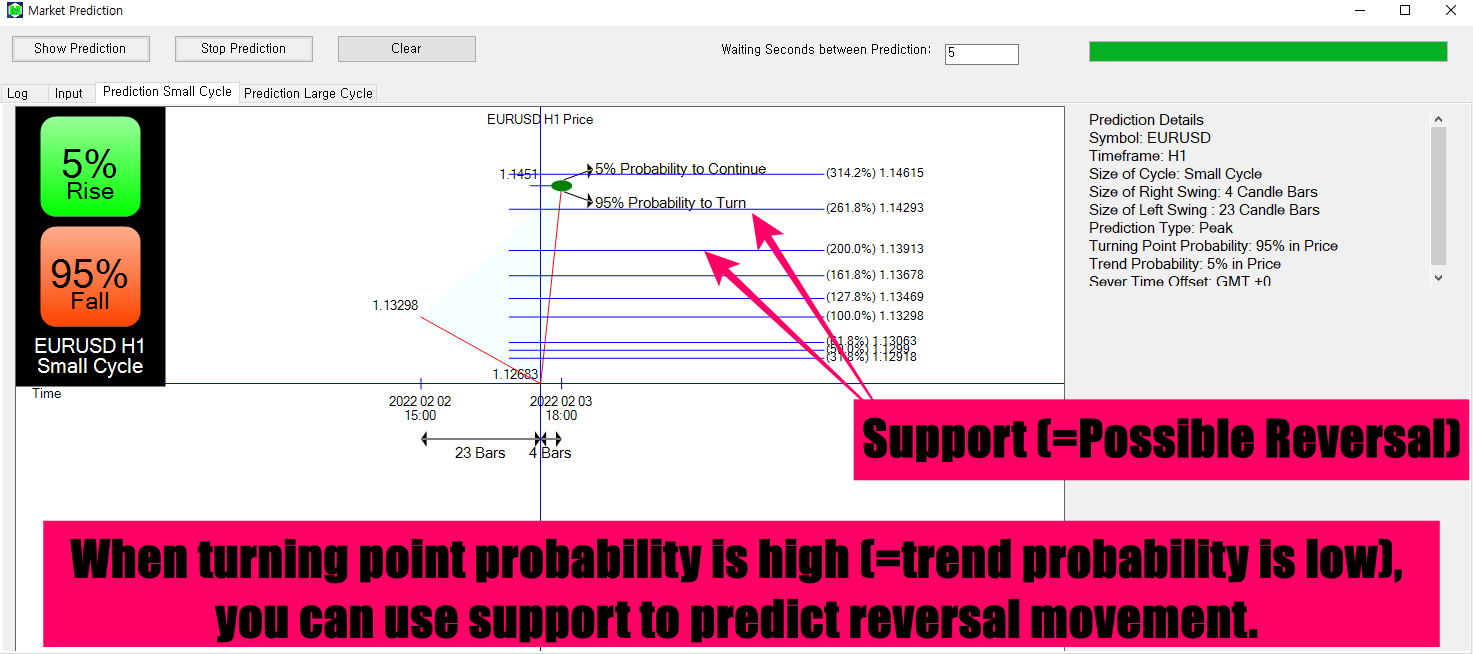
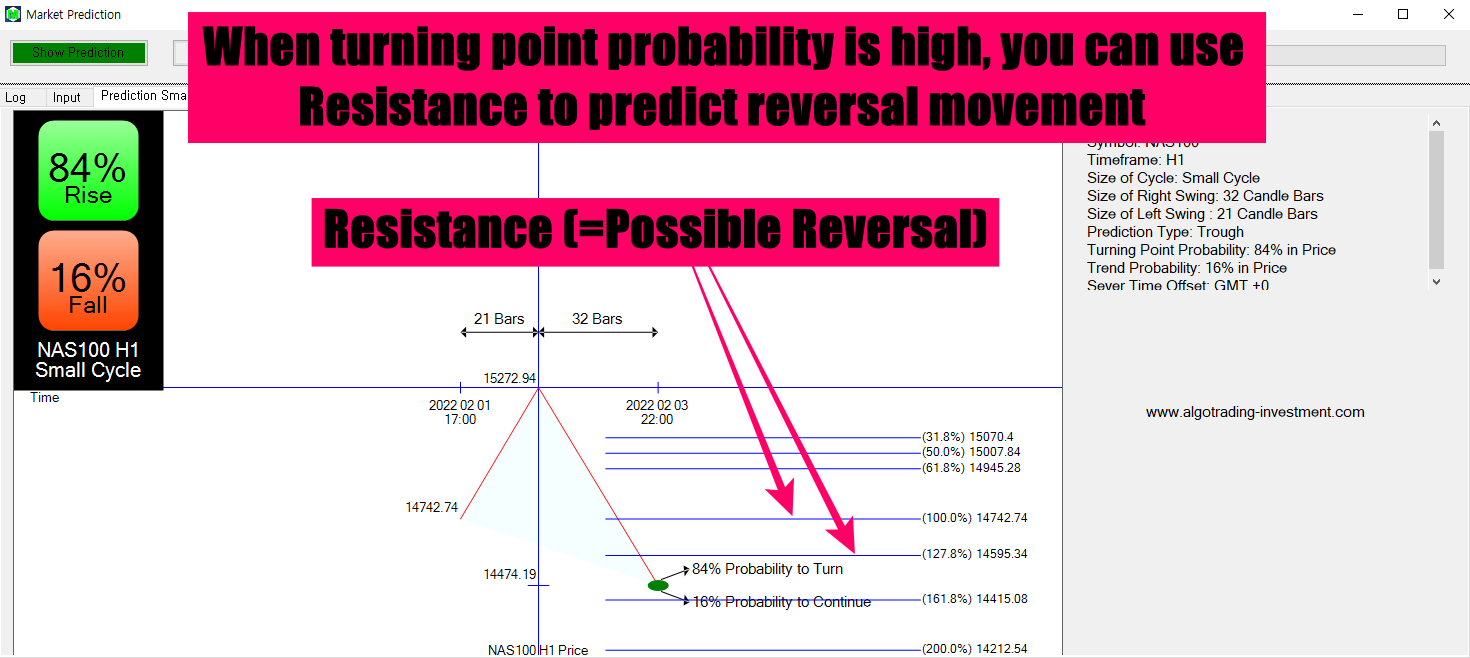
Secondly, we can have a look at the case in which turning point probability is high. This means the trend probability low as the trend probability is roughly equivalent to 100% – turning point probability. Depending on the current price is peak or trough, we might have to use support or resistance to predict the reversal movement.
In the screenshot below, you can see the turning point probability for EURUSD is high and it is currently showing peak. Hence, I have shown the support price level which could provide the potential reversal entry.
In the screenshot below, you can see the turning point probability for Nasdaq 100 is high and it is currently showing trough. Hence, I have shown the resistance price level which could provide the potential reversal entry.
Above four screenshot are taken to provide the reversal and breakout examples with first wave. If you wish to trade with second wave, then it is still possible to extend your trading entry and exit for the second wave in opposite direction to my explanation. Remember that support and resistance is the tool that helps you to react to the market. Support and resistance trader tends to follow the direction where the price is pushed by crowd.
Finally, if you want to play with small price movement, then you can play with small cycle. If you prefer to play with large price movement, then you can play with large cycle for your trading. I am sure this isn’t hard to understand.
If you want to see how the turning point probability can be combined with support resistance further, then you can watch this video here. The basic principle is always the same. It is one powerful way to turn the simple support and resistance to the professional trading system. The turning point probability literarily turns the simple support and resistance into the killer strategy. It helps to quantify your trading entry and exit with the support and resistance. You can use this quantified information to mange your risk too. Although you can use the diagonal support resistance together with it, we recommend using the horizontal support and resistance like Fibonacci Analysis, Supply Demand Analysis, Pivot Analysis, Round Number (= psychological number) and so on. I am sure you can think of many horizontal support resistance.
Additional Information about Forex Prediction
Full Instruction on how to use this Free Market Prediction tool is shown in the link below. This is rather long article. Hence, you can read later if you wish.
For rest, we recommend to use these predictions with breakout trading, trend following, reversal trading or fundamental trading. Even then, some people might be better with one strategy than the other. For example, you might be better at breakout trading than reversal trading and vise versa. Hence, pick the strategy that suits best for you. To understand the strategy with the prediction better, you can visit our trading education page below.
https://algotrading-investment.com/2019/07/23/trading-education/
In addition, to understand how to use swing size and swing age, you can visit below link.
https://algotrading-investment.com/2020/12/24/applying-turing-point-prediction-in-forex-market/
If you are a stock market trader, then we also provide the market prediction software for free from below link. This market prediction software is compatible with Forex market too. Hence, even if you are a Forex trader, you can still use.
https://algotrading-investment.com/free-download/
We provide the free prediction service on H1 Chart Data, free prediction software and other free MetaTrader products. Make sure to support us by leaving some good and positive reviews on our Products and Books on the internet. Please share this Forex Market Prediction with your friends and colleagues on SNS. So we can return more to people.
Get Premium Version of Market Prediction Indicator
If you want to access the premium version of the Market Prediction Indicator for your trading, then you can use our Fractal Pattern Scanner either in MetaTrader or Optimum Chart. In Fractal Pattern Scanner, you will be able to access all these prediction across all timeframe. It will also utilize the more sophisticated algorithm to recommend you either for breakout or reversal trading opportunity.
Below is the landing page for Fractal Pattern Scanner in MetaTrader version.
https://www.mql5.com/en/market/product/49170
https://www.mql5.com/en/market/product/49169
https://algotrading-investment.com/portfolio-item/fractal-pattern-scanner/
Below is the landing page for Optimum Chart. Optimum Chart is all in one solution with Robo Advisor. It contains Fractal Pattern Scanner + Pairs Trading Scanner + Harmonic Pattern Scanner + many other powerful trading signal scanner in just one product.
https://algotrading-investment.com/2019/07/23/optimum-chart/
Related Products


