Scan Supply Demand Zone Across All Timeframe
Scanning supply and demand zones is a technique that traders use to identify areas where there is an imbalance between buyers and sellers in the Forex and Stock market. These supply and demand zones are formed when price consolidates into a range and then quickly breaks out of that range, indicating a shift in the balance of the force in Forex and Stock market. Technical analyst can use these supply demand zones to predict future price movements and plan their entries and exits accordingly. There are some essential points when traders use the Supply and Demand Zone Scanner. These three points include:
- Price action analysis: This involves looking at the candlestick patterns and chart formations to identify supply and demand zones. For example, a pin bar or a doji candle can signal a reversal at a zone, while a strong bullish or bearish candle can confirm a breakout from a zone.
- Technical indicators: These are mathematical calculations or algorithm that are applied to the price data to generate signals and levels. Some of the indicators that can help identify supply and demand zones are volume, moving averages, trend lines, Fibonacci retracements, and oscillators.
- MetaTrader Scanners: These are the MetaTrader Supply Demand indicator that automatically scan the market for supply and demand zones based on predefined criteria and algorithms. Some of the examples of MetaTrader Supply Demand indicator are Ace Supply and Demand Zones and Mean Reversion Supply Demand.
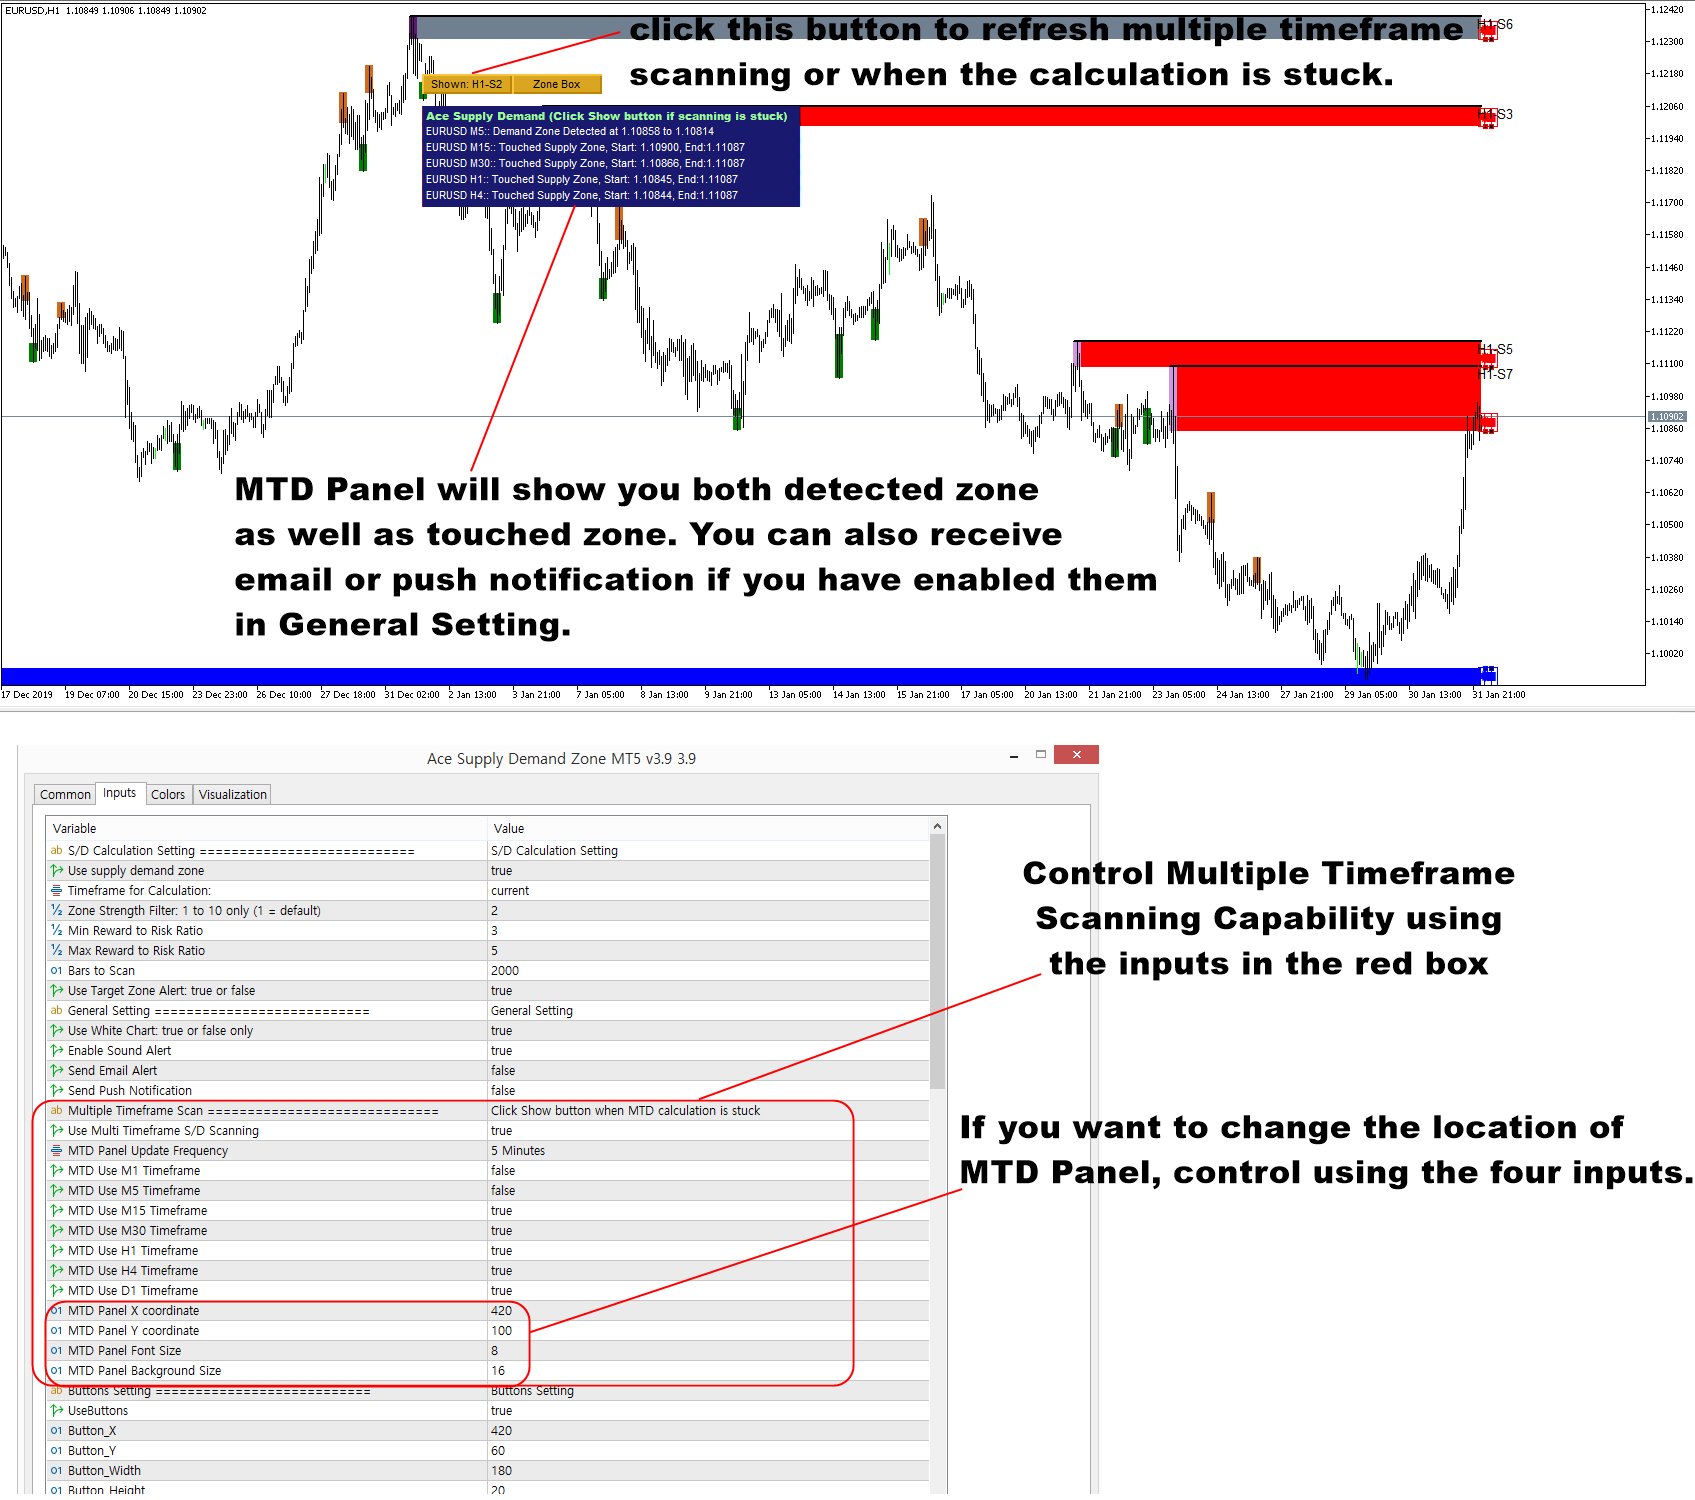
In Ace Supply Demand Zone indicator, you can scan the supply and demand zone across all timeframe for your Forex trading. This is a powerful feature included in Ace Supply Demand Zone indicator. Controlling the Multiple Timeframe scanning is similar to our other MetaTrader products like Harmonic Pattern Plus or X3 Chart Pattern Scanner. You can control them from the inputs under the Multiple Timeframe Scanning. With the inputs, you can enable or disable multiple timeframe scanning. You can also choose to switch on or off specific timeframe from your dashboard. In addition, you can also control how frequently the indicator should scan. The default value for update frequency is M5 timeframe. However, you can use M1 for update frequency if you need to scan them more frequently.
If you enabled email or push notification in the inputs under General Setting, then you can also receive the alert for the detected supply and demand zone as well as the touched supply and demand zone. The thing you need to understand about multiple timeframe scanning is that it requires multiple computation too per each timeframe. The computation can be heavier up to 7 times or more when you enabled M1 to D1 timeframes. Hence, due to data loading issues, the calculation might be stuck sometimes. In that case, just click Show button to refresh all the calculation. Of course, it is possible to switch off the multiple timeframe scanning if you only want to trade one timeframe.
Ace Supply Demand Zone in MetaTrader 4 and MetaTrader 5
In addition, we provide the YouTube video for Ace Supply Demand Zone Indicator. Hence, you can watch this YouTube Video to learn the basic operation with the supply demand zone indicator.
YouTube “Supply Demand Zone Indicator”: https://youtu.be/lr0dthrU9jo
Landing page for Ace Supply Demand Zone.
https://www.mql5.com/en/market/product/40076
https://www.mql5.com/en/market/product/40075
https://algotrading-investment.com/portfolio-item/ace-supply-demand-zone/
Related Products


