Historical Stock Price
Optimum Chart provides the comprehensive Forex, Commodity and Stock Index Price Data in real time. However, some investors want to apply the powerful and automated technical analysis of Optimum Chart for stock price data. Of course, in Optimum Chart, it is possible to import any external stock price data to the chart using a simple text file. It is possible to apply all the functions and features inside Optimum Chart, such as Support Resistance tool, Supply Demand analysis, Harmonic Pattern Scanner, Elliott Wave tool, and Pairs Trading algorithm to Cryptocurrencies, US stocks, Chinese stocks, or Japanese stock data and so on.
There are several ways, but the easiest way is to use a free stock data center like Yahoo Finance (www.finance.yahoo.com) or Investing.com (www.investing.com). Yahoo Finance and Investing.com provide vast amounts of stock data. Ordinary people can easily use historical stock data. Investment opportunities in the stock market can come from a variety of places. When the US stock market is in recession, you can look for the opportunity in UK stocks, Chinese stocks, Japanese stocks, Vietnamese stocks, and cryptocurrencies. Likewise, when the UK stock market is in a recession, you can turn your eyes to stock markets in other countries. If all the stock markets are down in the world, one way to make money is to use to Forex market. Hence, money making opportunity is always there for smart investors.
Anyway, in this article, I will try to explain as briefly as possible how to import various types of stock data into the Optimum Chart. I’ll explain in the easiest way, based on Yahoo Finance (www.finance.yahoo.com). First, enter the ticker code of the stock you want on the Yahoo Finance site and go to the stock page. We will take the example of Microsoft (stock code: MSFT) in the US stock market.

When you enter the stock page, you can see various information. To download stock data, please follow the 3 steps below.
1. First, press Historical Data tab.
2. Decide how much data to download. It is recommended to use data of about 5 years (5Y) or more in general for daily data.
3. Just click the Download button. (This is not an “Apply” button. Please click the Download button below).

Then, MSFT.csv file will be saved in the Download folder.

Next, Open Optimum Chart folder, click “data” folder, and then copy the MSFT.csv file to “source” folder in “External” folder. However, please rename the MSFT.csv file to MSFT_D1.csv. The reason for the name change is to tell Optimum Chart that Microsoft stock data is daily data (D1).
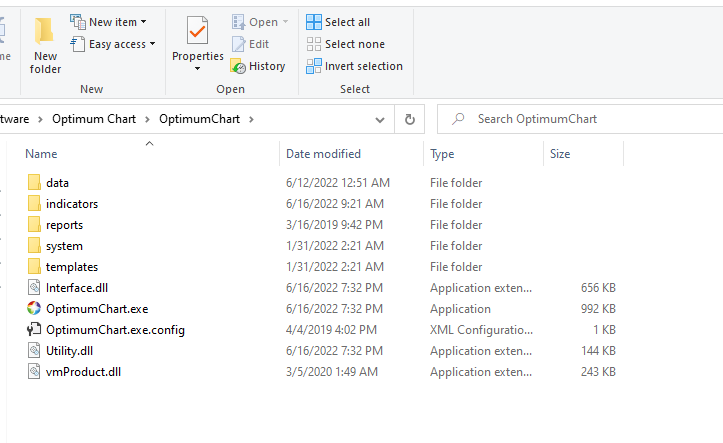
I put Microsoft daily data into “source” folder and put some other US stocks and foreign currency data to show an example. Of course, Cryptocurrency data is also possible too. After preparing like this, you can start the Optimum Chart.

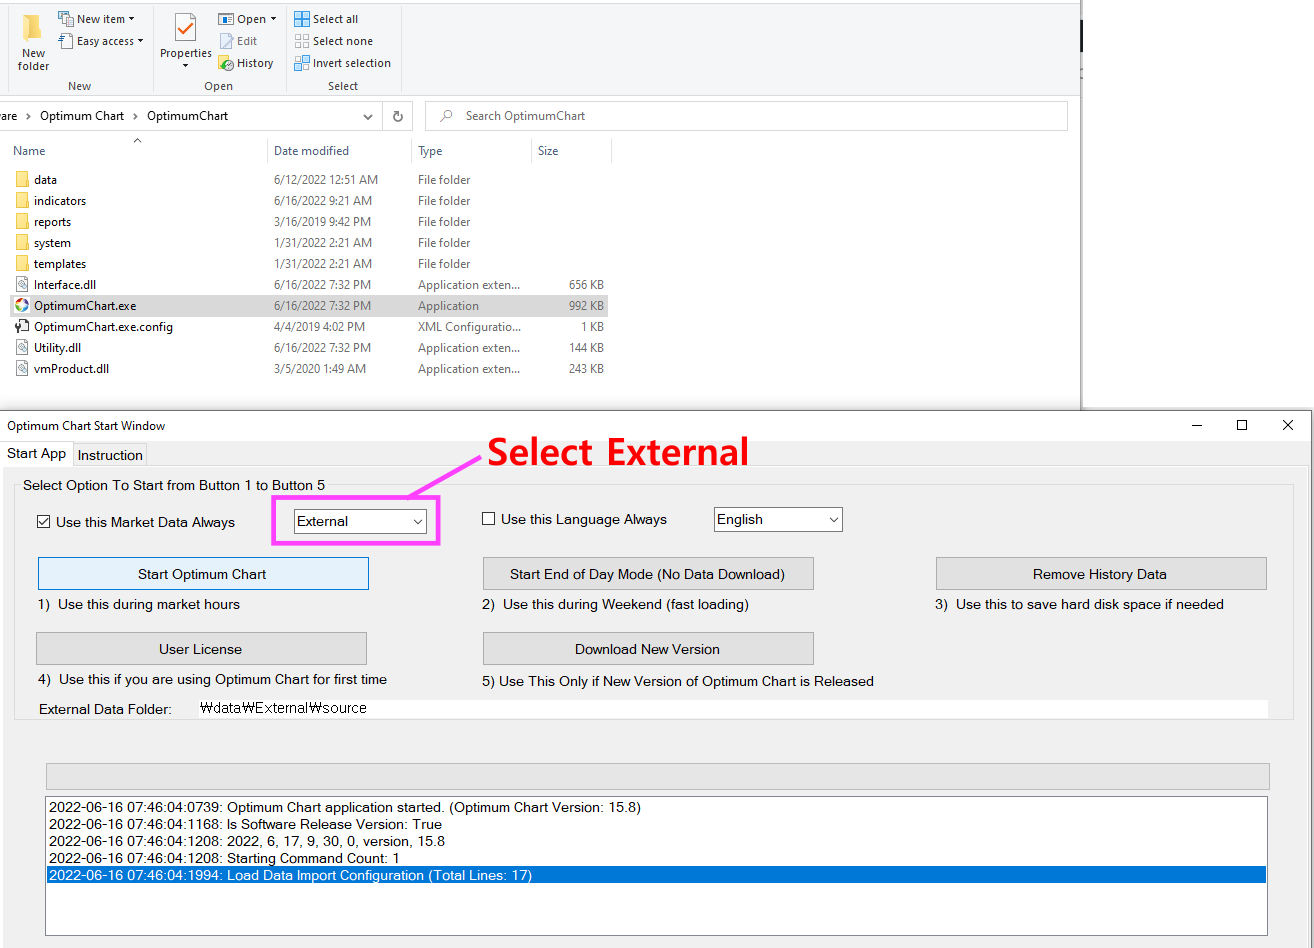
On the Optimum Chart start, window appears, then select External from the data option and click “Start Optimum Chart” button.
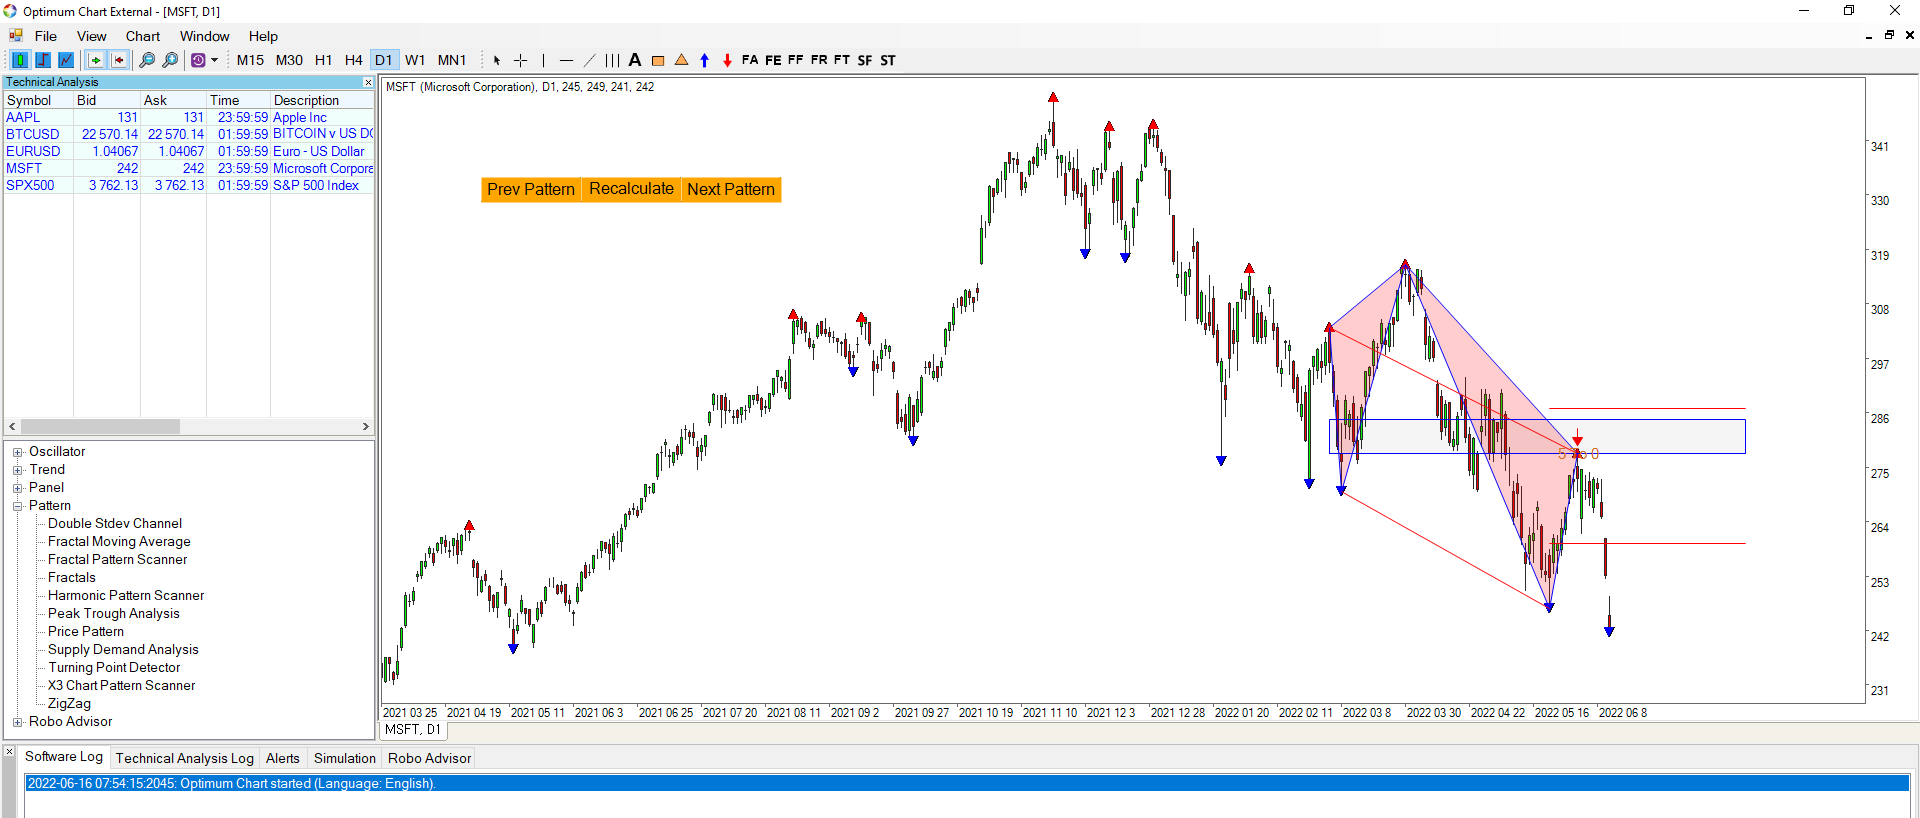
Since you have saved the daily stock data, you can open the daily chart (D1) in Optimum Chart. Of course, if you want to use the hourly chart (H1), you can save the hourly stock data (MSFT_H1.csv) in the same way and start the Optimal Chart. It does not matter if you store stock data for multiple timeframe for the same stock. When you start the chart in this way, it is possible to use all the features of the Optimum Chart. In addition, it is possible to download hundreds of stock data using free stock data software or macros on the Internet and easily analyze buy and sell opportunity with Optimum Chart’s Robo Advisor. I downloaded and tried more than 800 stock data, and it was possible to import all the data and scan the buy and sell timing of all stocks without too much trouble.
We hope that you will succeed by taking advantage of various investment opportunities with this article.
Related Products


