Make Best Out Of the Robo-Advior does Technical Analysis For the Forex Trader
In this article, we will explain how to use the Technical Analyst Robo-Advisor to catch the best buy and sell timing for your Forex Trading. For your information, Optimum Chart provides the first Robo-Advisor that does complex technical analysis and chart analysis for you in the world. In fact, whenever human performs the technial analysis, it takes considerable amount of time and cost. Especially, if you are a serious Forex trader, you can not skip the technical analysis. Sometimes, you want to use the paid service for the technical analysis from the experienced trader. However, the big advantage of asking Robo-Advisor to do technical analysis is the repeatablility. Robo-Advisor will not get tired or angry even if you ask them to do technical analysis so many times during the day. She will be always calm and helpful in her position. So feel free to ask the Robo Advisor to do technical analysis at any time you want and as frequently as you want. Another advantage of using the technical analyst Robo Advisor is its transparency. In the past, we have seen many robot does black box anlaysis. Human can hardly understand what the black box robot does at the background. Therefore, many people were skeptical using such a black box system. Our Technical Analyst Robo Advisor will perform the same technical analysis like the experienced trader does, then it will bring the chart and highlight important part in the chart and speak what is going on in the chart. You will do a lot of communcation with the Robo Advisor in fact. It is like you having the experienced trader next to you available 24/7.
Now, let us have a look at the steps to use the Robo Advisor. First of all, open any chart. Go to Techncal Analysis on the Left and use mouse right click to bring the menu. In this example, we will use EURUSD H1 chart.
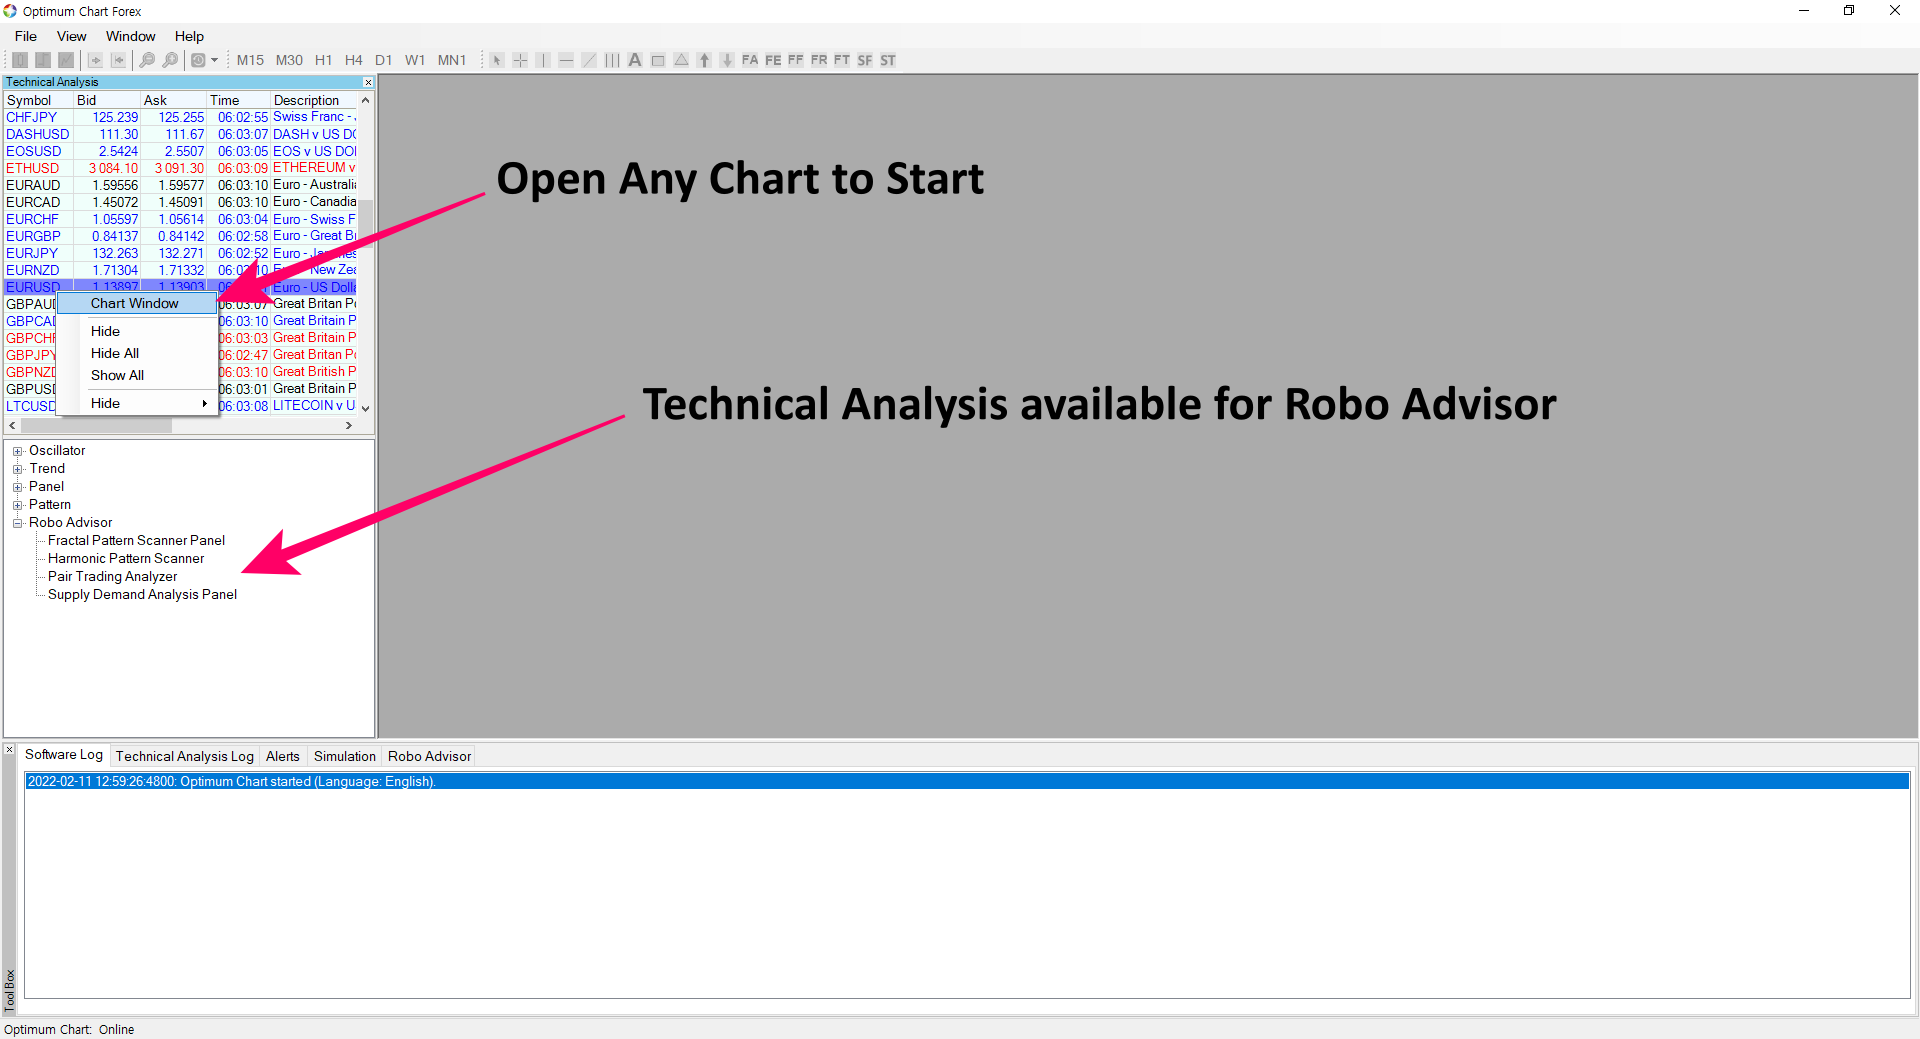
After EURUSD H1 chart is opened, now go to Technical Anlaysis Navigator in the middle left. You should be able to see the Robo Advisor section. In the list, you can see serveral technical analysis available for the Robo Adivosr. These technical analysis is not simple one. But they are several complex technical analysis combined to provide you the timing as well as risk management. For example, Harmonic Pattern Scanner will provide the conjoint analysis betweeen Harmonic Pattern Scanning and Supply Demand Analysis. It will help you to confirm the best timing in the chart.
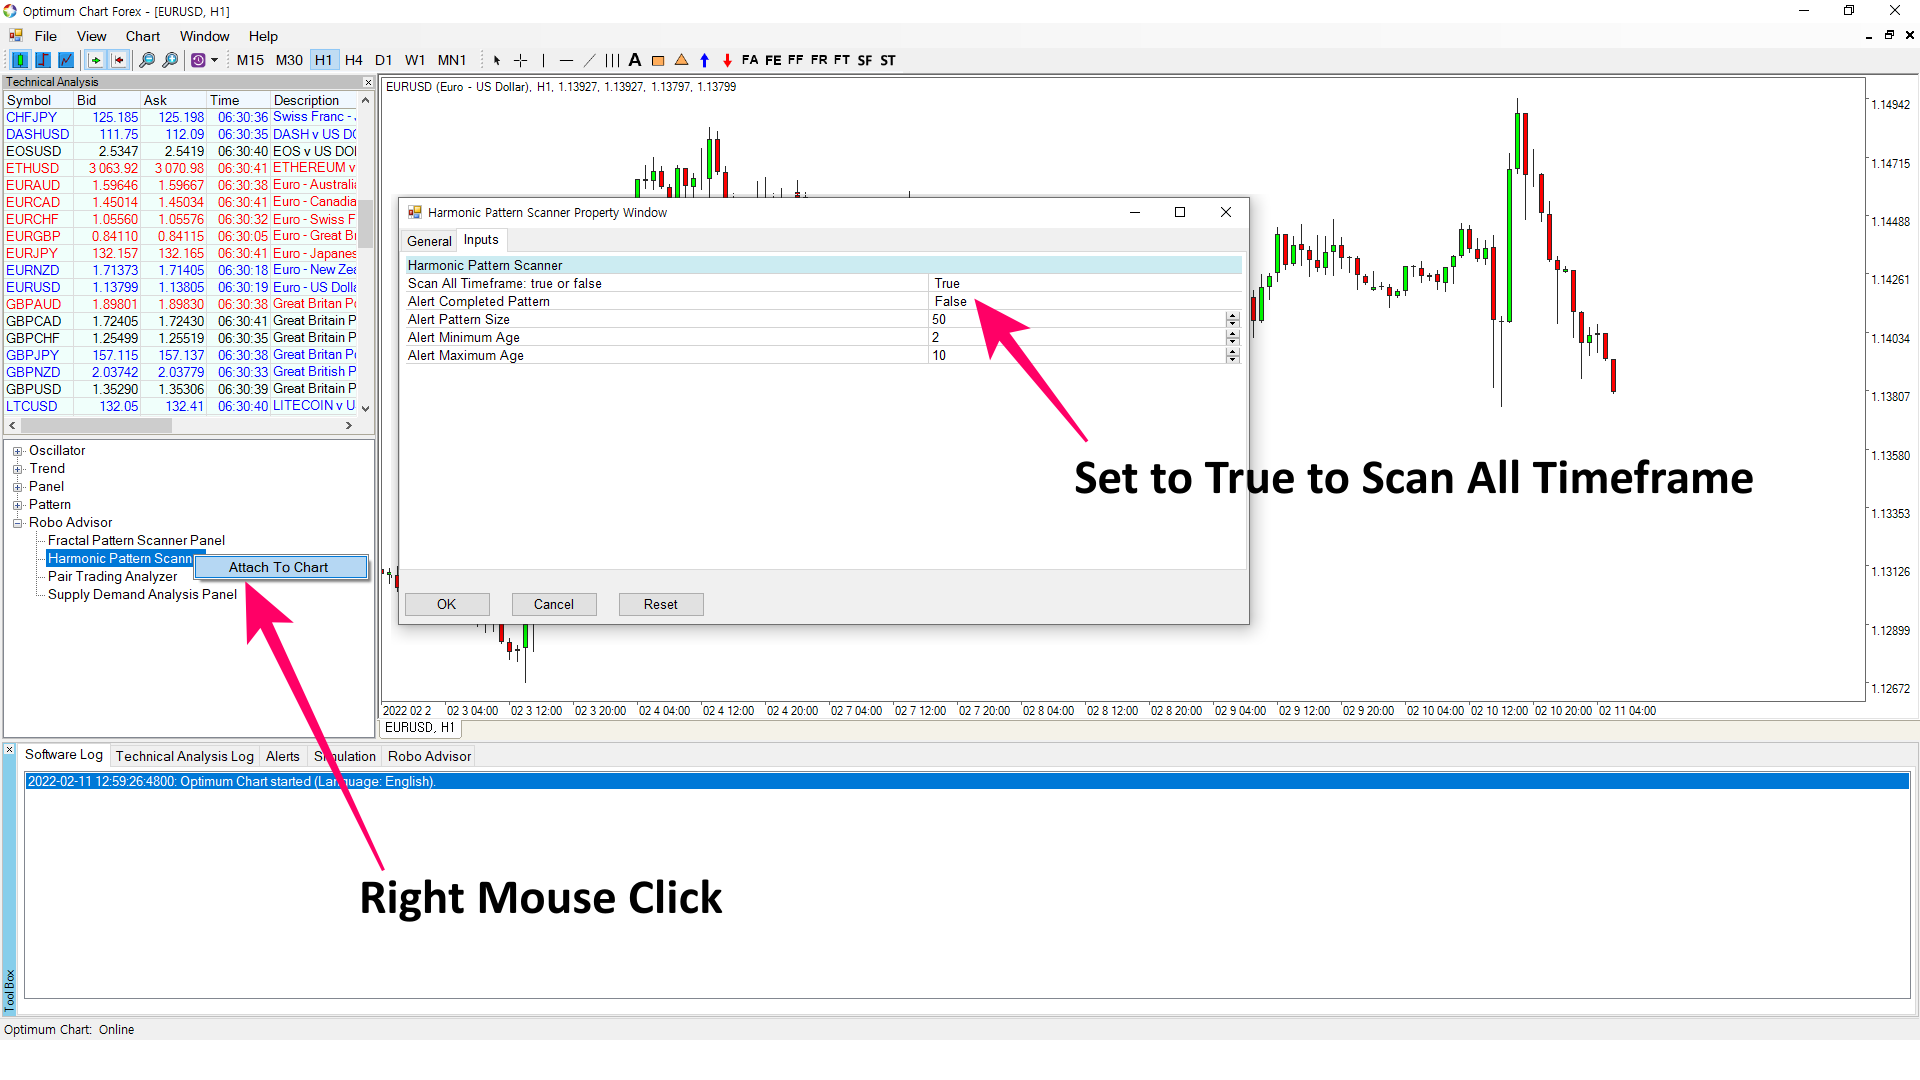
In our example, let us try to use Harmonic Pattern Scanner. Go to the bottom left of the Navigator, use the mouse right click to attach the Harmonic Pattern Scanner to the chart. If you wish to scan all symbols and all timeframe, then set Scann All Timeframe = true. If you do not set this option, then it will only detect Harmonnic Patterns across all symbols.
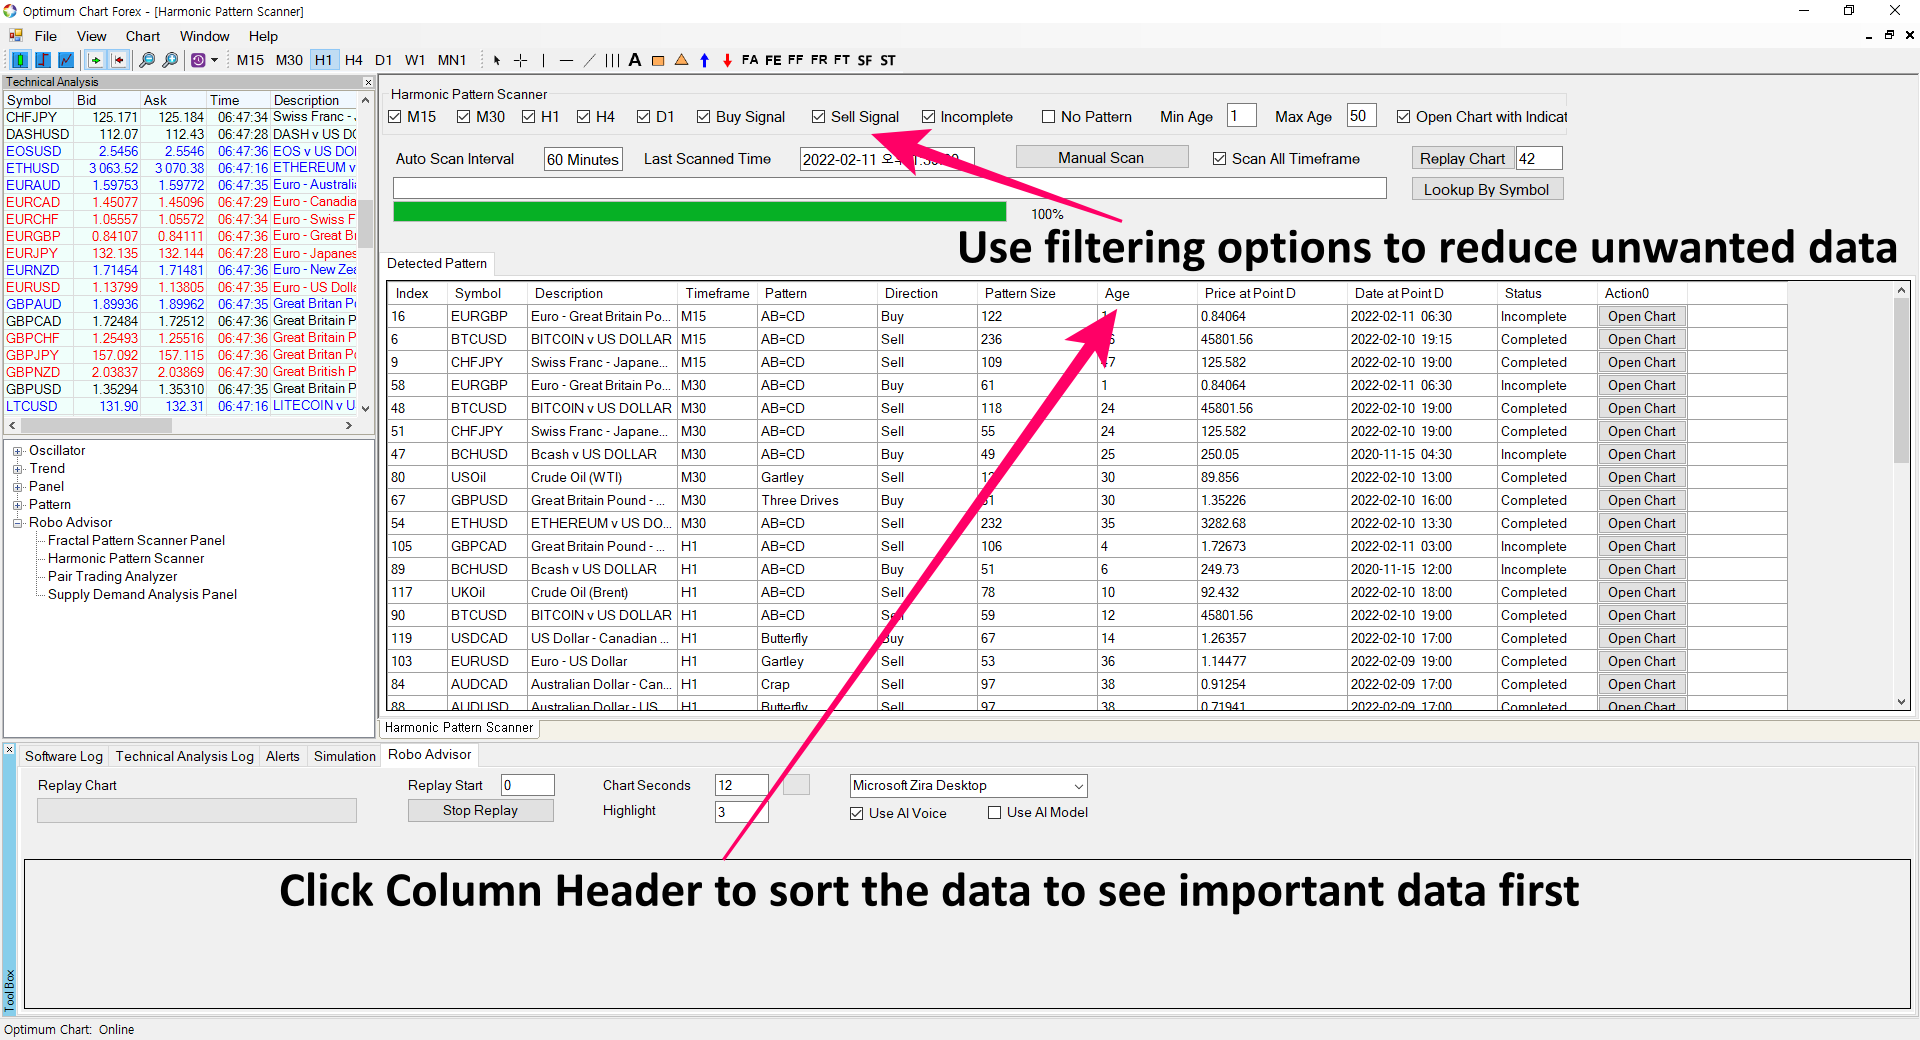
Scanning can take some time. Please wait and do not disturb until it is done. Once the pattern detection is done, you will see the scanned results in the table. To bring the Robo-Advisor, tick on Use AI Model. After that, if you click on Replay Chart button, then the Robo Advisor will start the technical analysis presentation for you.

Before starting the technical analysis presentation, there are few points you need to remember. Before the presentation, you can try to filter some unwanted data in the scanned results. The first option is to use the filtering option provided on top of the scanner. In the case of Harmonic Pattern, depending on your trading style, you might only want to see new and fresh pattern. In doing so, you can set Max Age to 20 or 10. That way you can see the Harmonic Pattern formed within last 10 or 20 candle bars. Likewise, you might want to search for the buy opportunity only. Then just untick on Sell Signal. Second option is to use the column header. By clicking on the column header, you can sort the signals. For example, if you click on Age column, then it will sort from newest Harmonic Pattern to oldest Harmonic Pattern. If you filter out some unwanted data and prioritize data with these two options, then you can save the presentation time for the techncial analysis.
While you are watching the techncial analysis presentation, make sure to have something to write like pen and pencile with note. During the presentation, try to make a note on symbols with strong buy or sell signals. This is called short listing. Once you have short listed sevesal symbols, you can finally decide which symbols to trade depending on the surrounding market condition.
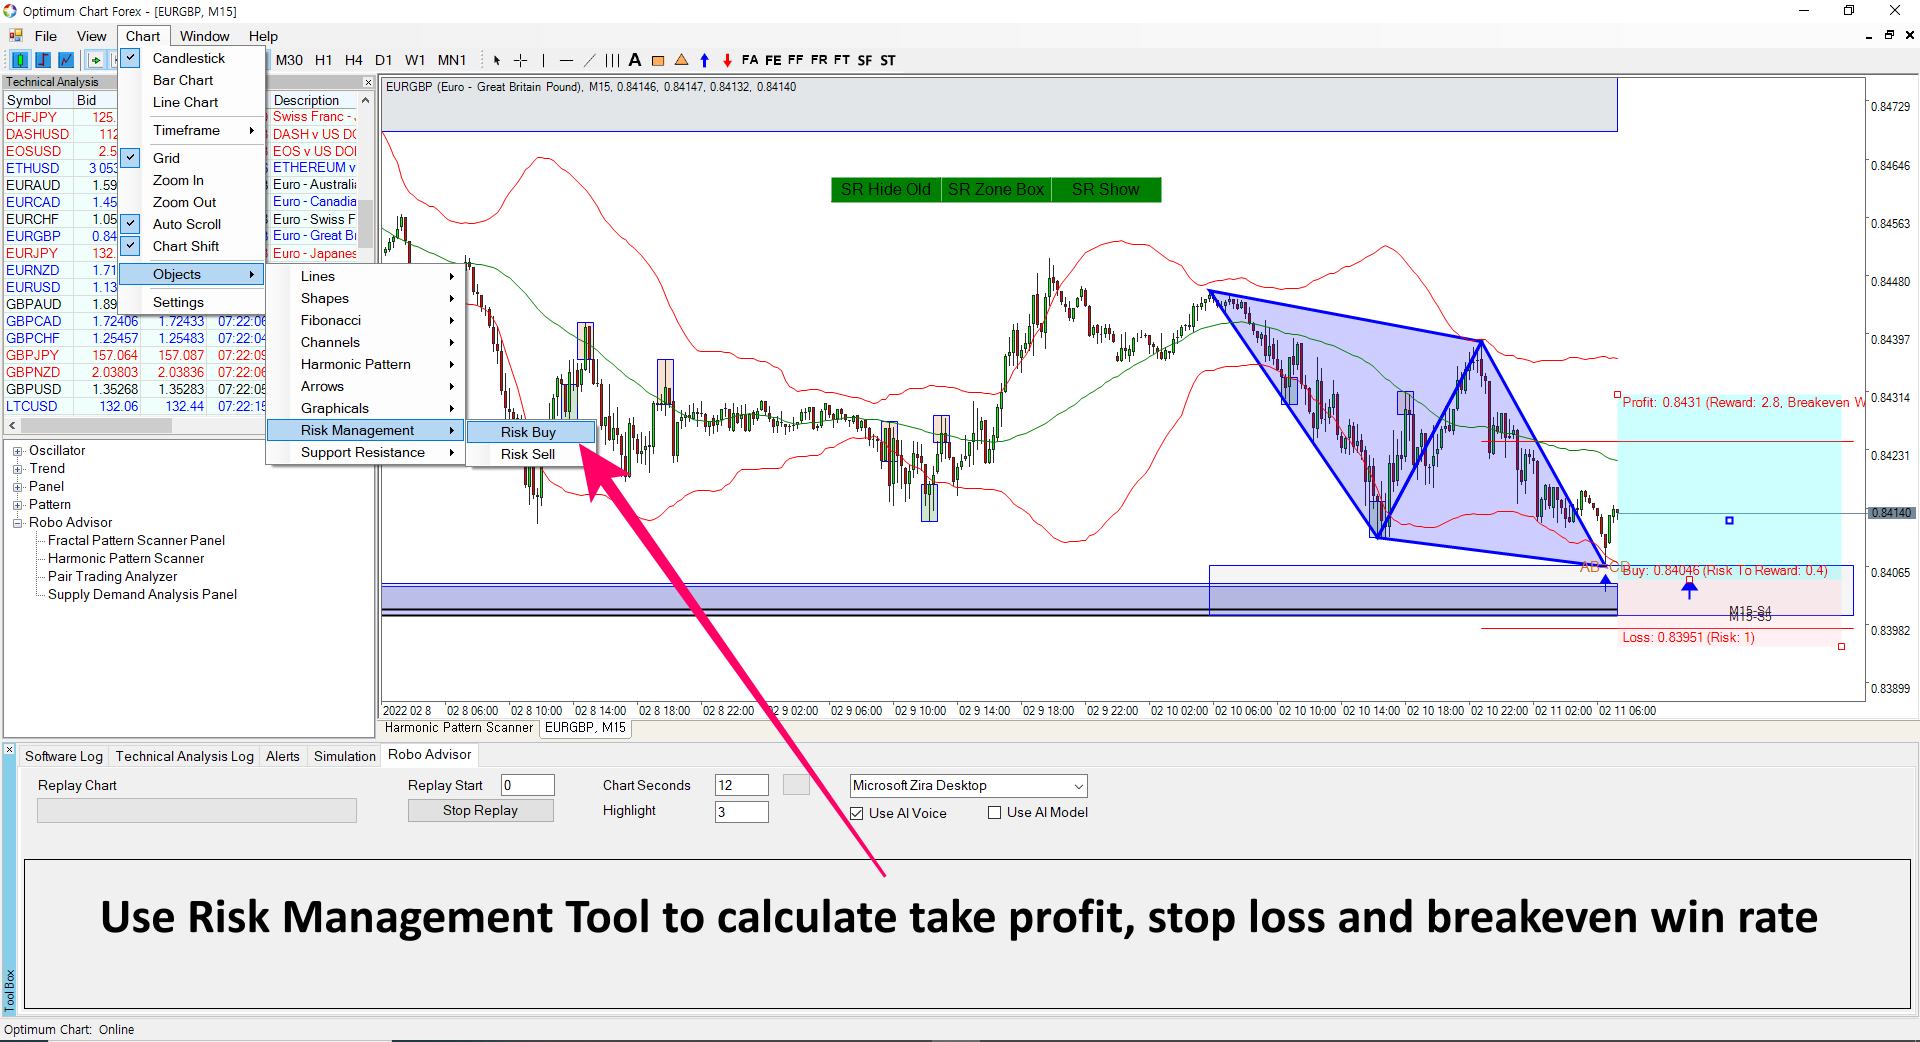
It is best to mark the stop loss and take profit directly on the chart. Use the Risk Management Tool provided from Optimum Chart. It will calculate your Reward to Risk Ratio and Breakeven win rate according to your take profit and stop loss. Overall, this is exactly how the professional trader makes the trading decision.
Summary of Using Robo-Advisor
Steps using the Technical Analyst Robo-Advisor can be summarized into the five steps.
1. Scan all symbols and all timeframe
2. Remove unwanted data using filtering option and prioritize the important data using the column header
3. Start Technical Analysis Presentation with Robo Advisor and short list symbols to trade.
4. Depending on the surrounding market condition, make the final buy or sell decision.
5. Mark the stop loss and take profit direclty on the chart
Related Products


