Market Indicator
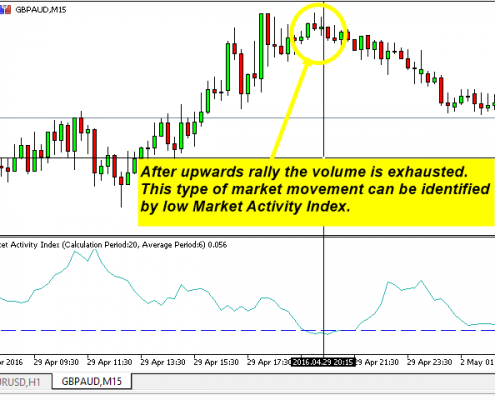
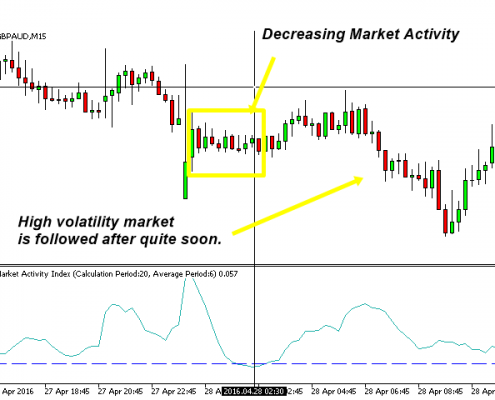
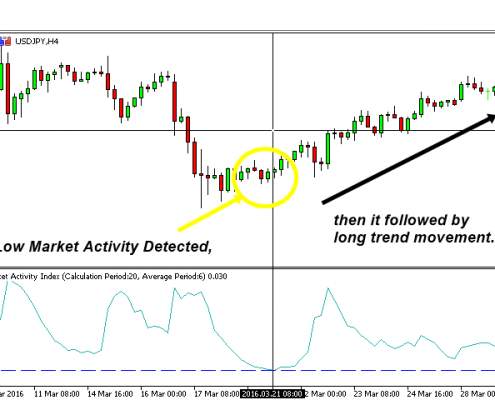
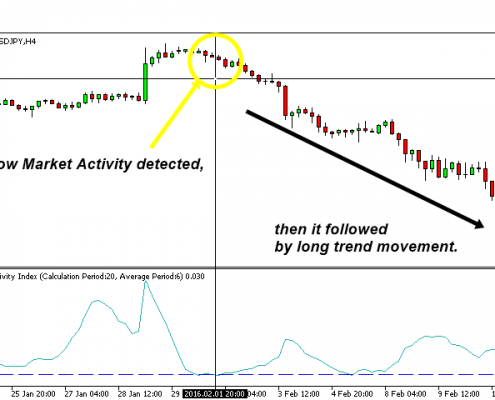
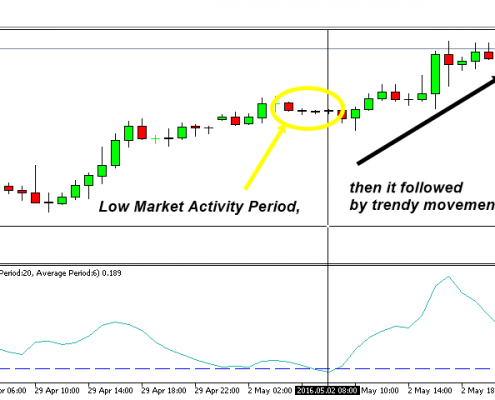
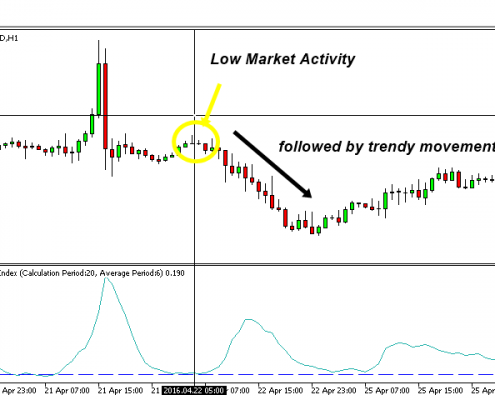
Market activity index is a market indicator to identify the quite market period before the beginning of the high volatile market and to provide the optimal trading entry. Like many good technical indicators, this Market Activity Index is very stable and it is widely applicable to many financial and non financial instruments without too much restriction. The Market Activity Index can be used best to visualize the alternating form of low and high volatile market. It is very useful tool to pick up the quiet market but ironically this is the most powerful tool to predict the highly volatile market. Greatest thing about the Market Activity Index is that the reading of this indicator is bounded by its top (1.0) and bottom (0.0) limit but for the bottom limit will never diverge from actual price movements. It means that for the reading of 0.08 Market activity Index can’t be calculated from highly volatile price movement. To visualize how important this concept is, imagine that price can still go even further up even after the RSI reading indicates over 70 overbought signal (This can happen to 99% of oscillators.). The same thing can happen to ADX or most of technical indicators. For example, 25 reading of ADX can be still calculated even if there were quite extreme price movement before. One might say that these are false signal or lagging signal. Market Activity Index is not a magic indicator but it will do its job reliably notifying the quiet or sideways market period to traders most of time. This tool can help you to understand and learn the market rhythm.
Market Indicator Benefits
- Reliable tool to monitor market volatility 24/7.
- Very simple to use even without too much knowledge in trading and investment.
- Market Activity Index can help you to understand market rhythms and you will learn how to dance with market for your trading and investment.
- Great supplementary tool to improve your trading.
- Comparing to traditional GARCH or ADX or ATR indicator, this tool is much more usable and more accurate for traders.
Market Indicator Features
- Brand New Algorithm developed in house.
- This indicator can provide you sound alert, email alert or push notification when low volatile market (or sideways market is detected.)
- Extremely simple to use.
- Applicable to any financial or non financial instruments
Market Indicator Parameters
From time to time, user may want to adjust the Market Activity Index setting for different currency pairs. Here is brief explanation to each input variable:
- Use White Background Chart: true or false only
- Calculation Period: period to calculate Market Activity Index
- Average Period: period to smooth out Market Activity Index
- Use Weighted Average: true or false only (weighed average is more responsive than non weighted average)
- Index Critical Level value: Critical level 0.05 or 0.1
- Index Critical Level Width: line width of Critical level
- Index Critical Level Color: line color of Critical level
Operation Principle
The Market Activity Index is designed to oscillate between 0.0 and 1.0 theoretically. Level 0.0 indicate theoretically dead quite period and Level 1.0 indicates theoretically maximum volatility. However both 0.0 and 1.0 will never reach in practice. Instead, use can choose 0.05 or 0.1 to detect sideways or low volatility period. Level 0.05 or 0.1 also corresponds to the common 95% or 90% critical value used in statistical hypothesis testing. Also the similar practical consideration as in the statistical hypothesis testing can be applied to the operation of Market Activity Index. According to our observations, some currency pairs works better with 0.05 critical value and for some other currency pairs, 0.1 critical value works better. Choice of critical value should be made accordingly to the price data itself.
Practical Consideration with Market Activity Index
Market Activity Index can be best used to spot the quite period of the market, which is also called sideways market or low volatile market in some text book. In practice, this quite period is followed by highly volatile period in cyclic manner. The indicator itself represents the alternating picture of the market movement in the quantitative form. This indicator can successfully spot the start of high volatile market period. As this technical indicator oscillates between fixed value 0.0 and 1.0, this indicators is suitable to build trading rules when combined together with other technical indicators. In spite of the fact that Market Activity Index often spot the turning point accurately, the Market Activity Index is not meant to predict the market direction from its design stage. Therefore, this indicator is best used as the supplementary tool to other technical indicators if your trading strategy requires knowing the market direction.
In trading it is important to make good decision but it is also important when to rest. Unlike ATR or Standard deviation indicator, Market Activity Index oscillate between 0.0 and 1.0. Therefore you could use this as your trading alarm. In our opinion, it is also more accurate than ADX in terms of filtering out quite market. Simply speaking, rest your trading when the Market Activity is pretty low like below 0.05 or below 0.10 since market will not move much during this time.
Important Note
This product is the off the shelf product in the store. Therefore, we do not take any personal modification or personal customization request. For our products, we do not provide any code library or any support for your coding.

