Volatility Indicator
Fibonacci Volatility indicator is a Volatility indicator to identify high and low volatlility as well as to spot the breakout and reversal trading opportunity. The operating principle of the Fibonacci Volatility indicator was introduced in the Book “Harmonic Volatility Line Indicator: Alternative Approach to Gann’s angle”. This Fibonacci Volatility indicator provides both Z score Configuration Method and Probability Configuration Method, whereas in Harmonic Volatility indicator you can only use Probability Configuration Method. Hence, this indicator provides more functionality than Harmonic Volatility Indicator.
Volatility indicator Features
- Fibonacci Volatility in Z score Configuration Mode
- Fibonacci Volatility in Probability Configuration Mode
- Daily, Weekly, Monthly, and Yearly Volatility Mode
- Movable Volatility – Useful for geometric pattern analysis
- Market Profile Analysis
- Support and Resistance using Volatility projection
- Alert for Low Volatile Area
- Alert for High Volatile Area
Trading Strategy Guide
You can use the Volatility analysis to find the statistical regularity in your trading. For example, the volatility analysis can provide you three areas for breakout (N), bullish reversal (B) and bearish reversal (S). Then you can use these three areas to base your entry and exits of your price pattern trading. Articles below contains the detailed trading strategy guide for Fibonacci Volatility Indicator.
- Harmonic Volatility Indicator and Movable Harmonic Volatility Indicator
- Reversal Trading using Fibonacci Expansion Pattern with Volatility Analysis
- Breakout Trading using Fibonacci Expansion Pattern with Volatility Analysis
- Fibonacci Volatility Indicator with the Z score Configuration
Volatility indicator Setting
To use Z score configuration mode, set “Use Z Score Configuration” = true. If you set “Use Z Score Configuration” = false, then indicator will use Probability Configuration Mode. Probability Configuration Mode is the same as Harmonic Volatility Indicator. These inputs below control the global setting of the indicator.
- Number of Daily Session: 0 means indicator will not draw any daily volatility lines. 1 means that indicator will draw one set of daily volatility lines. You can create multiple session of daily volatility lines. However, too many sessions can slow down your MetaTrader. So use the right number for your computer.
- Number of Weekly Session: It is the same as daily session input.
- Number of Monthly Session: It is the same as daily session input.
- Starting Index: 0 is default value. For 0, indicator will start to draw from session 0.
- Use White Chart: True means that you will use white background chart.
- Use Individual Line Color: If this is false, then you will use global color scheme. If this is true, then you can use individual color scheme
- Daily Line Color: Color of daily line
- Weekly Line Color: Color of weekly line
- Monthly Line Color: Color of monthly line
- Show Probability Lines: switch on and off the curved probability line
- Show Final Projection: switch on and off the trading zone box
- Projection Margin: size of trading Zone (0.05 = 5%, 0.0618 = default)
Market Profile settings
- Use Market Profile: Switch on and off market profile from your chart
- Session: choose from daily, weekly or monthly only
- SessionsToCount: Number of sessions for which to count the Market Profile
- Color for Market Profile: color for market profile
- Color for Median: color for median value
- Color for Value Area: color for value area
Input Setting for Each Probability Line
Each probability line can be switched on and off according to your preferences. You have the same setting for nine lines.
- Use Line 1: You can switch on and off the line
- Probability of Line 1: this input is only active when you set the indicator for Probability Configuration Mode
- Z Score of Line 1: this input is only active when you set the indicator for Z Score Configuration Mode
- Probability Line 1 Color: Color for line
- Probability Line 1 Width: Width for line
- Probability Line 1 Style: Style for line
Important Note about Volatility indicator
This indicator is graphic intensive. If you use too many sessions for Fibonacci Volatility indicator and market profile, this can slow down your MetaTrader. So try to use the right amount of sessions suiting your computer memory and CPU. This product is the off the shelf product in the store. Therefore, we do not take any personal modification or personal customization request. For our products, we do not provide any code library or any support for your coding. Also check difference between Fibonacci Volatility Indicator, Harmonic Volatility Indicator and Double Harmonic Volatility Indicator.
Keyboard Short Cut
Press Keyboard D: Redraw Volatility indicator from your chart.
Timeframe Choice
When Daily Market Profile session is on, you cannot use H4, D1, W1 and MN timeframe.
YouTube Video about Volatility Indicator
Youtube Link: https://www.youtube.com/watch?v=erWhucDT_6M
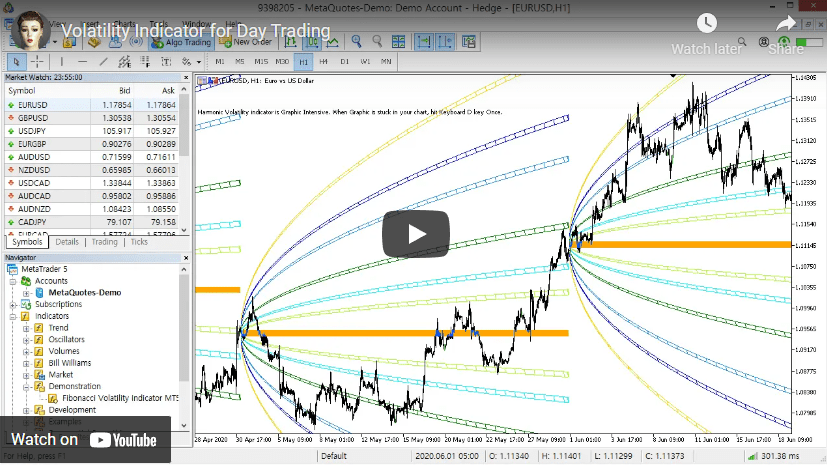
Volatility Indicator YouTube