Elliott Wave
Elliott Wave Theory is an ingenious concept in the technical analysis in Forex and Stock Trading. Elliott Wave theory was developed by Ralph Nelson Elliott, a brilliant accountant who noticed that financial markets exhibit repetitive patterns due to underlying crowd psychology influenced by greed and fear. This article discusses about Elliott Wave including Elliott Wave Theory, Elliott Wave Trading, Elliott Wave counting, Elliott Wave pattern and Elliott Wave education. Ralph Nelson Elliott was one of very first person who believed that he could predict the stock market by studying the repeating patterns in the price series. To prove this idea, he created the Wave Principle. Many years later, the Wave Principle was reintroduced in the Prechter’s Elliott Wave books to investors. The Wave Principle states that the wave patterns are repeating and superimposing on each other forming complex wave patterns. The advantage of Elliott Wave theory is that it is comprehensive as the theory can provide multiple trading entries on different market conditions. Elliott Wave theory can be used for both momentum trading and mean reversion trading. The disadvantage of Elliott Wave theory is that it is more complex comparing to other trading techniques. In addition, there are still some loose ends in detecting Elliott wave patterns. For this reason, many traders heavily criticize the lack of scientific methods of counting Elliott Waves.
The Wave Principle states that the crowd or social behaviour follows a certain wave patterns repeating themselves. The Wave Principle identifies two wave patterns. For example, Elliott Wave Theory categorizes price movements into two main types:
- Impulse Waves: These are the primary trend moves, consisting of five waves (three up and two down).
- Corrective Waves: These are countertrend moves, comprising three waves (two up and one down).
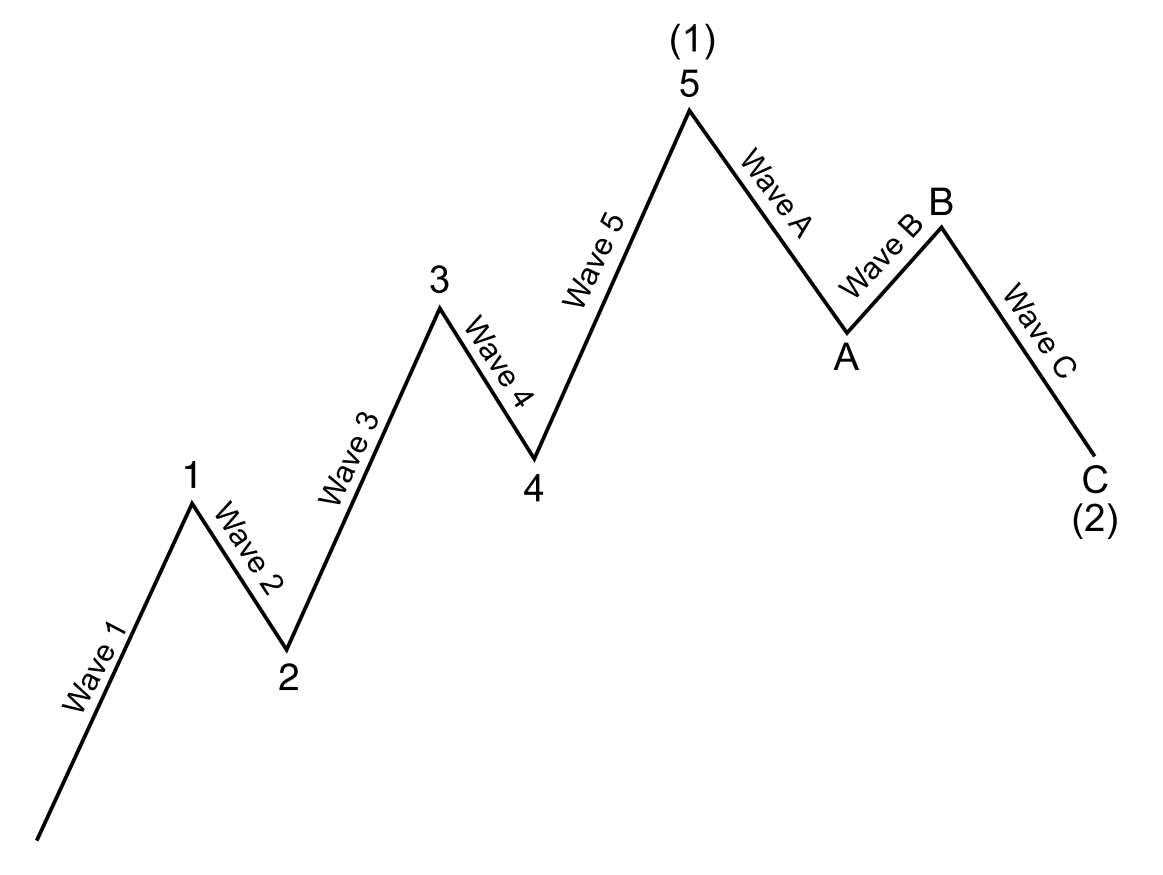
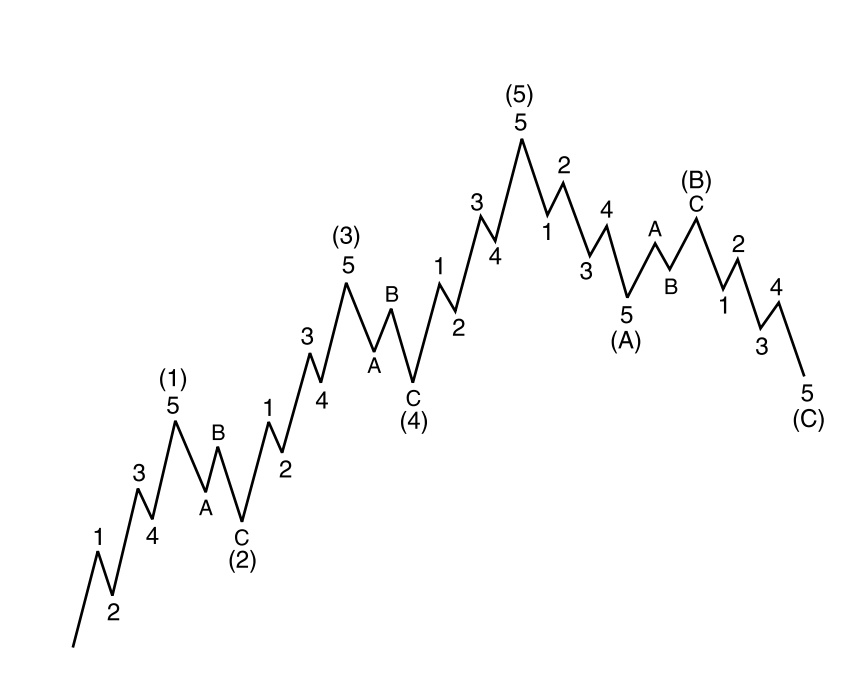
Often, the term impulse wave is interchangeably used with the motive wave. Two terms are identical. Both motive and impulse wave progress during the main trend phase whereas the corrective wave progress during the corrective phase against the main trend. In general, the Impulse Wave has a five-wave structure, while the Corrective Wave has a three-wave structure (Figure 8-1). It is important to understand that these wave structures can override on smaller wave structure to form greater wave cycle (Figure 8-2). Elliott Wave theory is useful in identifying both trend market and correction market.
Figure 8-1: Illustrative example of five-impulse wave and three corrective wave structure
Figure 8-2: Lesser Impulse and corrective wave forming more complex wave patterns
Elliott Wave theory can be beneficial to predict the market movement if they are used correctly. Junior traders are often fear to use Elliott Wave because their complexity. From my experience, Elliott wave is not a rocket science, anyone can probably learn how to use the technique with some commitment. However, not all the book and educational materials will teach them in the scientific way. If we are just looking at the three rules from the original Wave principle only, there are definitely some rooms where subjective judgement can play in our wave counting. This makes the starters to give up the Elliott Wave Theory quickly. Fortunately, there are some additional tools to overcome the subjectivity in our wave counting. First tool but the most important tool is definitely the three wave rules from the original Wave Principle. They can be used as the most important guideline for the wave counting. Below we describe the three rules:
• Rule 1: Wave 2 can never retrace more than 100 percent of wave 1.
• Rule 2: Wave 4 may never end in the price territory of wave 1.
• Rule 3: Out of the three impulse waves (i.e. wave 1, 3 and 5), wave 3 can never the shortest.
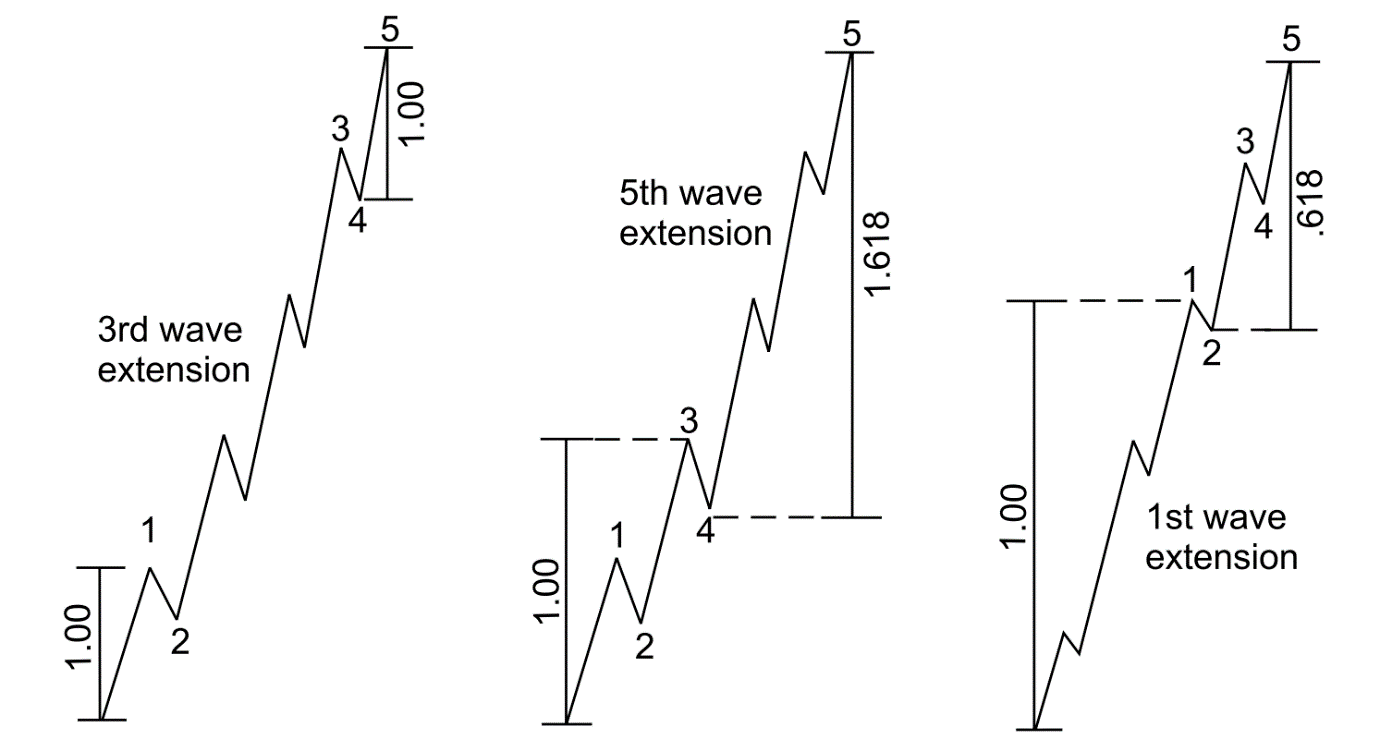
Second tool is the Fibonacci ratio. As in the Harmonic pattern detection, Fibonacci ratio can play an important role in our wave counting because they describe the wavelength of each wave in regards to their neighbouring wave. For example, the following relationship is often found among the five wave of the impulse wave. Depending on which wave is extended among wave one, three and five, the Fibonacci ratios are different. Most of time, the extension of wave 3 is most frequently observed in the real world trading.
Figure 8-3: Fibonacci relationship of impulse wave structure (Prechter, 1995)
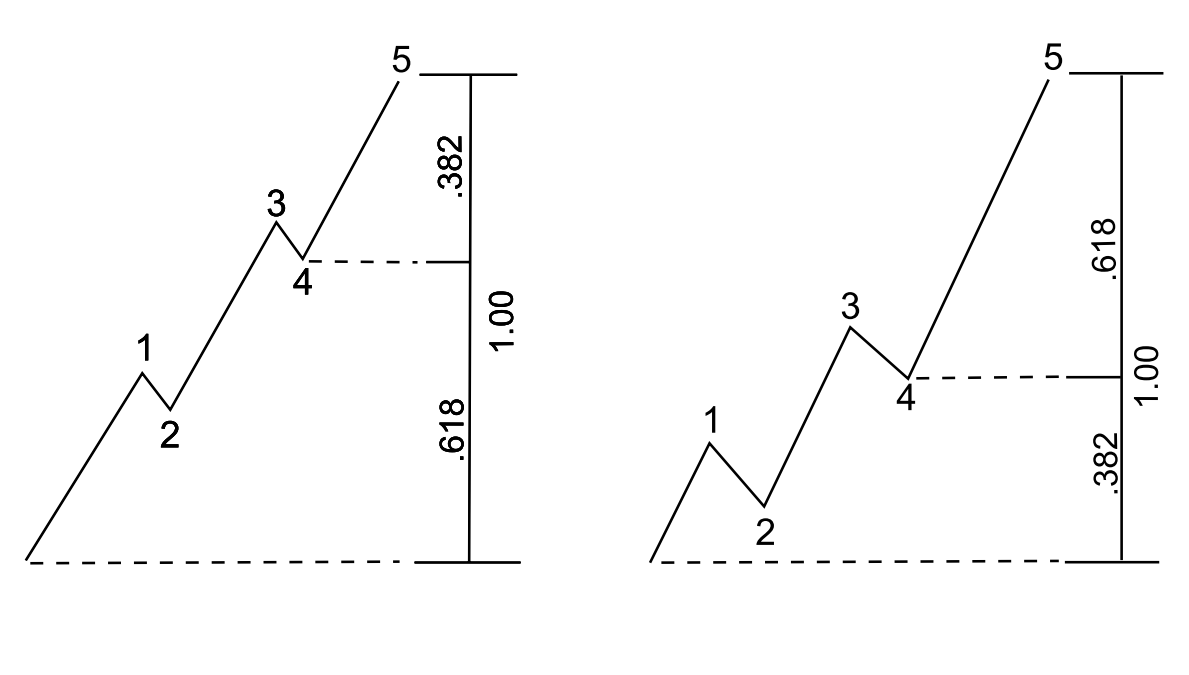
Unless wave 1 is extended, wave 4 often divides five impulse waves into the Golden Section. If the wave 5 is not extended, the price range from the starting point of wave 1 to the ending point of wave 4 make up 61.8% of the overall height of the impulse wave. If wave 5 is extended, then the price range from the starting point of wave 1 to the ending point of wave 4 make up 38.2% of the overall height of the impulse wave. These two rules are rough guideline. Sometime, trader can observe some cases where these two rules are not hold true. Personally, I normally place the Fibonacci ratio relationship in Figure 8-3 before this Golden Section rule. However, the priority between these two rules might depend on the preference of traders.
Figure 8-4: Golden Section division rule with wave 4
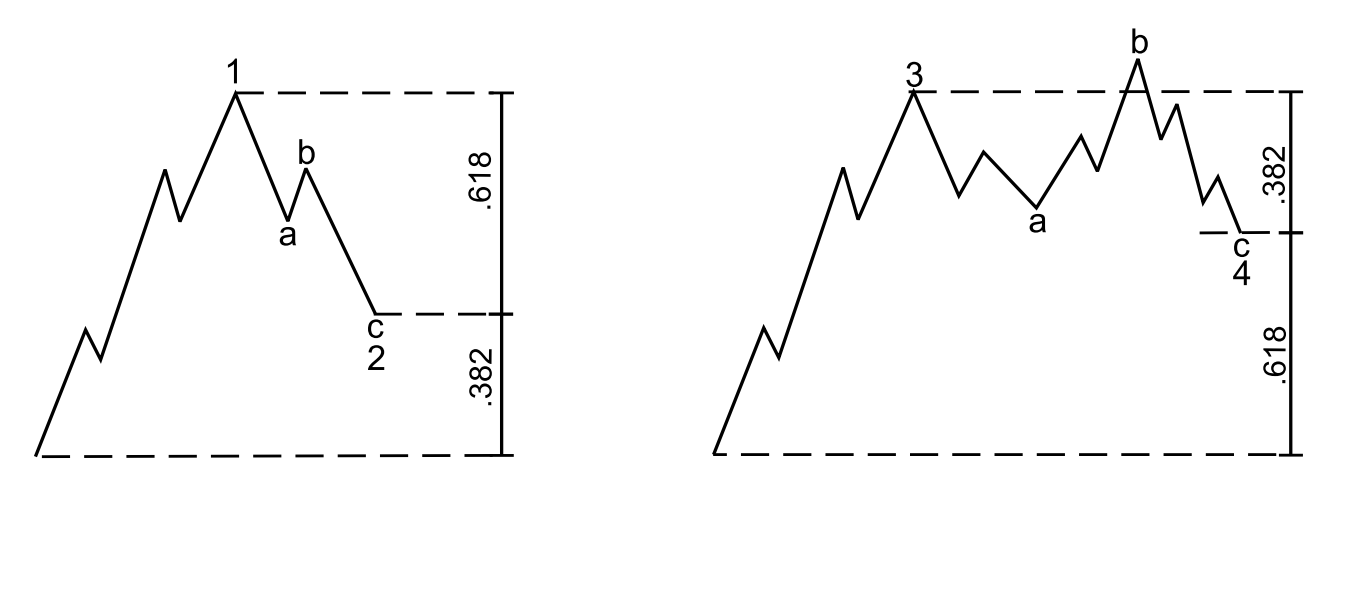
For the case of the three waves in the corrective wave, typical Fibonacci ratios are shown in Figure 8-5. The corrective wave is often retrace 61.8% or 32.8% against the size of previous impulse wave. In general, Elliott suggested that corrective wave 2 and wave 4 have the alternating relationship. If wave 2 is simple, then wave 4 is complex. Likewise, if wave 2 is complex, then wave 4 is simple. A “Simple” correction means only one wave structure whereas a “Complex” correction means three corrective wave structures. Furthermore, if wave 2 is sharp correction, then wave 4 can be sideways correction. Likewise, if wave 2 is sideways correction, then wave 4 can be sharp correction.
Figure 8-5: Fibonacci relationship for wave 1 and wave 2 (left) and for wave 3 and wave 4 (right)
Elliott Wave Trading
Traders use Elliott Wave Analysis to identify potential turning points and trend continuation to plan their trades ahead. By recognizing specific Wave Patterns, traders can anticipate price reversals and continuation to adjust their position in the market. Once you have some knowledge about Elliott Wave, there are two ways you can trade with Elliott Wave. First approach is to trade with Elliott Wave counting and second approach is to trade with Elliott Wave pattern. Both methods have pros and cons.
- Elliott Wave Counting
- Elliott Wave Pattern
If we have to say the point in short, trading with Elliott Wave counting is harder than trading with Elliott Wave pattern. One of the reason behind this is that Elliott wave counting has more chance to add some subjectivity in your trading. Subjectivity is bad because you can not measure the trading performance for your technique. Hence, if you want to tune or to improve your technique, then it is very hard to do so. Elliott wave theory is only general rule with potential to expand to too many possibility. For example, the wave counting done by one trader often does not agree with the wave counting done by other trader for the same chart and for the same subject. Before starting wave counting, you need to understand this. If you want to become successful with wave counting, reducing the subjectivity is the most important task. Hence, we created wave score to tell the integrity of the wave counting as well as to reduce some human error.
For example, before starting with wave counting, you can read these points.
- Point 1: Always start your analysis with impulse wave (before corrective wave).
- Point 2: Use Fibonacci anlaysis to check the correct position of impulse wave.
- Point 3: Use wave score if possible to avoid any human error.
- Point 4: Avoid complex wave counting and stick with simple and tradable one.
- Point 5: When market does not fit with Elliott Wave theory, then do not trade.
Point 5 is particularly important as some people try too hard to fit Elliott Wave to all market situation. This can introduce overfitting for your wave counting. Overfitted wave counting is useless as they do not have any prediction power but they looks good on chart only. If you are trader, then making money is priority over fitting the wave to the chart. You need to know when to stop and when to start with your wave counting. This can be difficult if you are less experienced with Elliott Wave.
To stick with these important points, we have created Elliott Wave Trend. Elliott Wave Trend is the Elliott Wave indicator. With Elliott Wave Trend, you have some additional tools to reduce the subjectivity with your wave counting. For example, Elliott Wave Trend provides the wave score and some template to start your wave counting. You can check the Elliott Wave Trend from the link below.
https://www.mql5.com/en/market/product/16479
https://www.mql5.com/en/market/product/16472
https://algotrading-investment.com/portfolio-item/elliott-wave-trend/
Now let us talk about the second approach, Elliott Wave pattern. Using Fibonacci relationship from Elliott Wave theory, we can create a set of tradable Elliott Wave pattern. Trading Elliott Wave pattern involves to use one of these Elliott Wave pattern to determine buy and sell entry for your trading. Hence, trading with Elliott Wave pattern is more mechanical approach than trading with wave counting. Mostly, the Elliott Wave pattern is constructed using the ratio guide from Elliott Wave theory. The good thing about this approach is that you can tune and improve your trading performance in objective way. For example, you can compare the performance of one Elliott Wave pattern to another Elliott Wave pattern in historical data. It is even possible to compare the Elliott Wave pattern to Harmonic Pattern. Using this approach, we can select the best performing Elliott Wave pattern to trade. This approach is purely driven by the performance. Hence, we can continuosuly improve Elliott Wave pattern for our trading.
For this purpose, we created X3 Chart Pattern Scanner. With X3 Chart Pattern Scanner, you can plug in any Elliott Wave pattern structure to test their trading performance in historical data. After that, you can use better Elliott Wave pattern to trade live. X3 Chart Pattern Scanner is a specialized tool in detecting chart patterns including Harmonic Pattern and Elliott Wave Patterns. Plus it can also detect Japanese Candlestick pattern and advanced channel.
https://www.mql5.com/en/market/product/41993
https://www.mql5.com/en/market/product/41992
https://algotrading-investment.com/portfolio-item/profitable-pattern-scanner/
Elliott Wave Book
We also provide the good book about Elliott Wave. You can have a look at following books to learn how to best use Elliott Wave for your trading in Forex and Stock market. From these books, you will also find the X3 Chart Pattern framework that helps you to study, prove and improve Elliott Wave Pattern to maximize your trading performance.
Scientific Guide To Price Action and Pattern Trading
Science Of Support, Resistance, Fibonacci Analysis and Harmonic Pattern
Profitable Chart Patterns in Forex and Stock Market
Elliott Wave Pattern Testing
For your trading in Forex and Stock market, we provide the detailed performance for several Elliott Wave Patterns. You can download PDF file for each pattern from the link below. Or you can visit the YouTube video to check each pattern from the link below. Each PDF or YouTube video will provide you a proof for the Elliott Wave Pattern. At the same time, you can use this proof to improve the given structure of the Elliott Wave Pattern. Of course, it is possible to create more Elliott Wave patterns to trade than those shown here. You can test other Elliott Wave pattern using X3 Chart Pattern framework too. After that, if you want to keep the Elliott Wave pattern structure only for yourself to trade and to make money, then it is fine. However, if you want to share the information with public for the scientific record, then you can send us the testing results too. We will publish them here for you in our website. In addition, more testing will come in the future from us too.
Elliott Wave 1234: https://algotrading-investment.com/2022/06/22/elliott-wave-1234/
Elliott Wave 12345 ABC: https://algotrading-investment.com/2022/06/22/elliott-wave-12345-abc/
Related Products

