Supply Demand – Take Profit and Stop Loss
In this article, we will explain the supply demand zone with money management using take profit and stop loss in Forex and Stock trading. This article consists of two parts. First part is about to explain supply demand zone concpet. Second part is about to explain the money management using take profit and stop loss. In addition, we will use Ace Supply Demand Zone to demonstrate how to manuplate take profit and stop loss around the detected supply and demand zone in Forex chart.
Supply and demand analysis involves defining the key area to trade. In the practical trading, the supply and demand analysis involves identifying two key areas where supply is greater than demand (= supply zone) and where demand is greater than supply (=demand zone). Identifying the two key areas are done by looking at the price pattern. For example, supply zone is identified where the price drops at high speed from peak. Likewise, the demand zone is identified where the price rise at high speed from trough.
Supply and demand analysis is comparable to support and resistance. Broadly speaking, supply and demand analysis can be considered as the support and resistance up to some extent. However, there are some differences between them. Firstly, support and resistance on their own are more or less volatility prediction tool. In another words, they predict the price level with potential high volatility. However, supply and demand analysis with the pattern recognition provides the direction to trade. For example, depending on the price pattern, the supply and demand analysis predicts the bullish or bearish movement. Secondly, support and resistance use the line whereas the supply and demand analysis use the key area, which is the price range between two prices. In spite of these two differences, there are some cases where supply and demand zone are formed in the similar way as the support and resistance. Hence, there could be some theoretical debate on using the supply and demand analysis as the support and resistance.
The key idea using the support resistance is based on the market memory. The market tends to remember the important price level in the past. This behaviour of the market is exactly how the support and resistance are formed in the Forex and Stock chart. When we use the demand supply zone as the support resistance, we can observe the exactly same phenomenon. One advantage of demand supply zone is that it is easier to set the stop loss and profit target. This does not mean that you can not set the stop loss and profit target for the support and resistance. Of course, there are many effective ways to set stop loss and profit target with support and resistance.
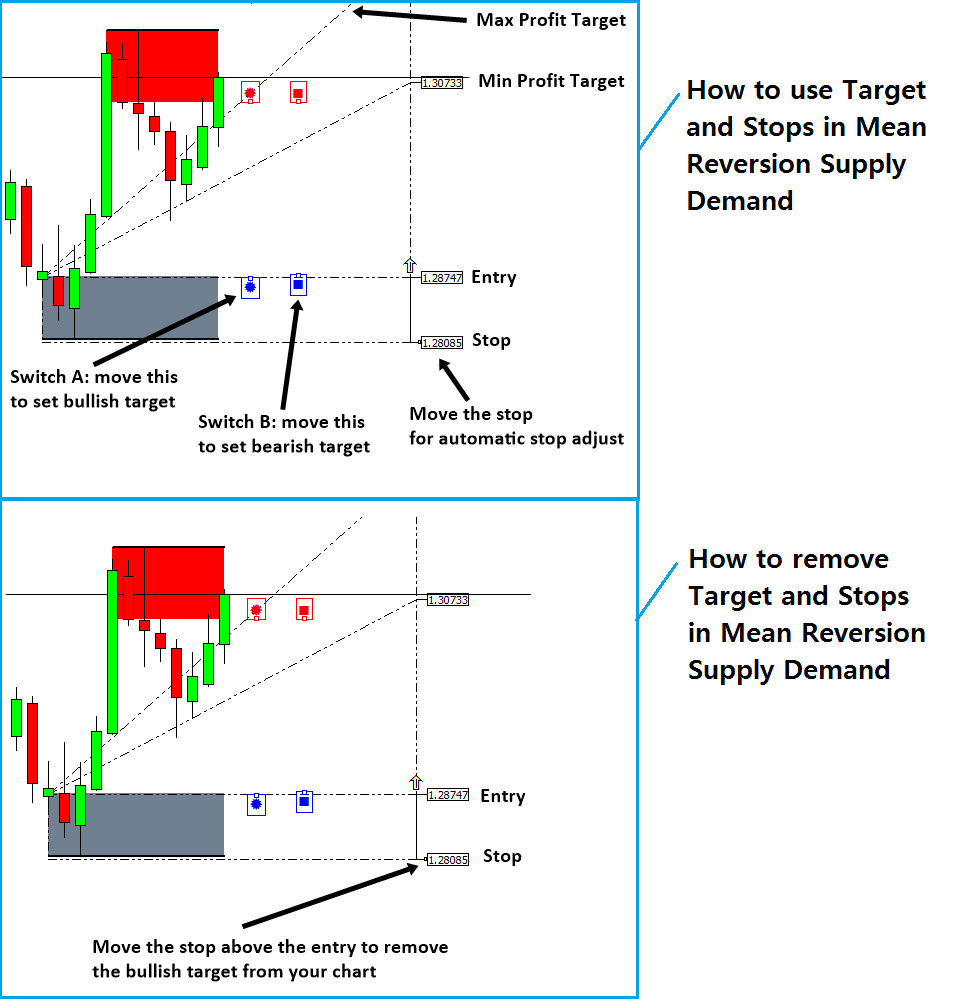
When we use demand supply zone as the support resistance, setting up the profit target and stop loss is different from what we explained so far. In the demand supply zone, this is done around the key area initially defined to identify the zone. We use the zone to set the buy trigger or sell trigger level as well as the stop loss level. For example, say that you are waiting for the buy breakout trading at the demand zone. In the first task, we need to set the buy trigger level. The top of the zone can be used to set the buy trigger level typically. However, I call it the minimum buy trigger as you can set this buy trigger level slightly higher than the top of the zone, depending on the market condition. The second task is to set the stop loss. The bottom of the zone can be used to set the stop loss level typically. However, I call it the minimum stop loss as you might need to lower down your stop loss level, depending on the market condition. The third task is to set the profit target level. Profit target is typically recommended to be at least twice greater than the size of stop loss. After profit target is set, you might need a fine refinement for the buy trigger level and stop loss depending on your reward to risk ratio.
To make your trading flow more efficient, we have created the automated Supply Demand Zone indicator, Ace Supply Demand Zone. Of course, with Ace Supply Demand Zone, you can find the most sensible take profit and stop loss in less than few sconds. One of the greatest advantage of Ace Supply Demand Zone indicator is that it provide a flexible Profit and stop target for your trading. After you have learnt how to use this profit targets, now you want to learn how to remove them. Of course, there is a way to remove them. The trick is simply moving the stop text above the Entry text (for the case of buy). You will do the opposite for the case of sell. In the screenshot, the bottom image describe how to remove the targets from your chart.
There is another approach to remove take profit and stop loss targets. We provide the shortcut in keyboard for doing the same task. Simply hit “z” button in your keyboard. This will also remove the stop loss and take profit targets if you do not need them any longer.
In addition, we provide the YouTube video for Ace Supply Demand Zone Indicator. In terms of indicator operation, both mean reversion supply demand and ace supply demand zone indicator are similar. Hence, you can watch this YouTube Video to learn the basic operation with the supply demand zone indicator.
YouTube “Supply Demand Zone Indicator”: https://youtu.be/lr0dthrU9jo
Below is link to Ace Supply Demand Zone Indicator.
https://www.mql5.com/en/market/product/40076
https://www.mql5.com/en/market/product/40075
https://algotrading-investment.com/portfolio-item/ace-supply-demand-zone/
Related Products


