Breakout Trading with Fractal Wave and Stochastic Cycles
Statistical regularity is useful to set the basic rational for our trading. Turning point probability is the good statistical regularity detection tool to go with most of the price action strategies. First reason for this is simply that turning point probability was invented for the financial trading. Second reason is that turning point probability was invented for predicting Fractal wave in their original purpose. In the previous chapter, we have shown how to use this statistical regularity to predict the reversal movement in your trading. As you might guess, it is possible to use the same trading idea for the case of the breakout. This idea is hardly not surprising if you just understand how the probability works. For example, in the reversal trading, we were looking for the mother wave at its mature development stage. The mature mother wave is often found in the high probability area.
In case of breakout trading, we just need to reverse this logic. For example, we just need to look for the mother wave at its early formation stage. The young and fresh mother wave is likely to be found in the low probability area in the probability graph. To help your understanding on this, we provide some examples in Figure 4.9-1 and Figure 4.9-2. Figure 4.9-1 shows the probability graph drawn from the trough. When the turning point probability graph is drawn from the trough, we will look for bullish breakout in the low probability area. Then we can look for bearish turning point (i.e. reversal) in the high probability area.
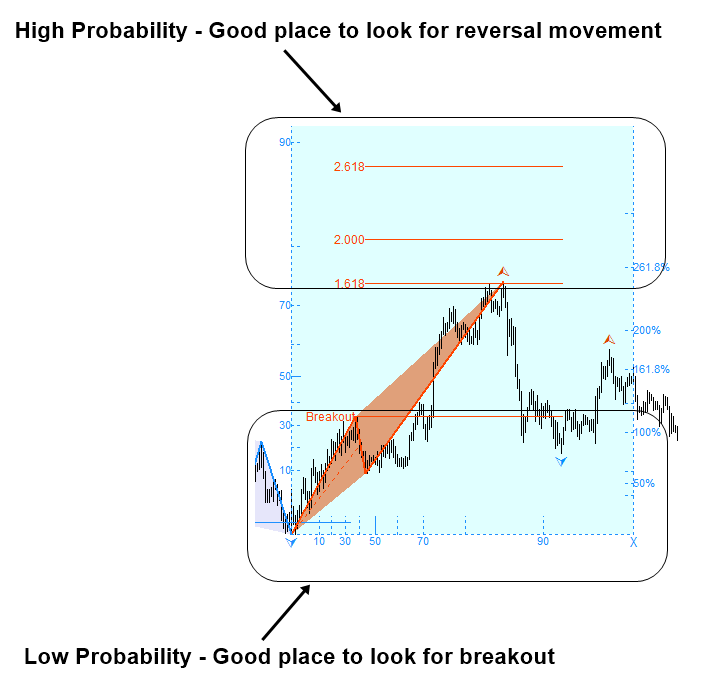
Figure 4.9-1: Bullish breakout and bearish reversal example
Figure 4.9-2 shows the probability graph drawn from the peak. When the turning point probability graph is drawn from the peak, we will look for bearish breakout in the low probability area. Then, we can look for bullish turning point (i.e. reversal) in the high probability area.

Figure 4.9-2: Bearish breakout and bullish reversal example
The key point to detect the good breakout opportunity is to detect the young and fresh mother wave with reasonably low turning point probability. Although it is not easy to pin point the exact cut-off, the probability should be below 50%. I guess the 60% probability could be the maximum to detect the mother wave at its early formation stage.
As in the case of the reversal trading, we will be making the trading decision using two steps below for breakout trading:
Step 1: Detect statistical regularity in price series
Step 2: Confirm the statistical regularity with geometric regularity
In step 1, we will be detecting the mother wave with relatively low probability. In step 2, we could apply several different methods to detect the geometric regularity. For example, some candidate methods for step 2 can include support and resistance, Fibonacci retracement, Elliott Wave theory, Triangle and other price action strategies. In fact, your knowledge of Elliott wave trading could be useful in this case because detecting the breakout point after the first child wave is very similar to riding the Wave 3 during the Elliott Wave 123 pattern formation. However, Elliott wave theory could be complex for some audience. Hence, we will not use them in this book. For the demonstration purpose, we will be using the simple support and resistance to detect geometric regularity in step 2. Support and resistance method is an effective tool to detect geometric regularity.
Let us begin with some bullish example first. When we detect the mother wave for the breakout, it should have the first child wave identified in the low probability region. In Figure 4.9-3, we show an example of mother wave detected at 32.8%. You can tell that amplitude of the first child wave is 32.8%. We can draw the breakout line on top of the first child wave. This is step 1.
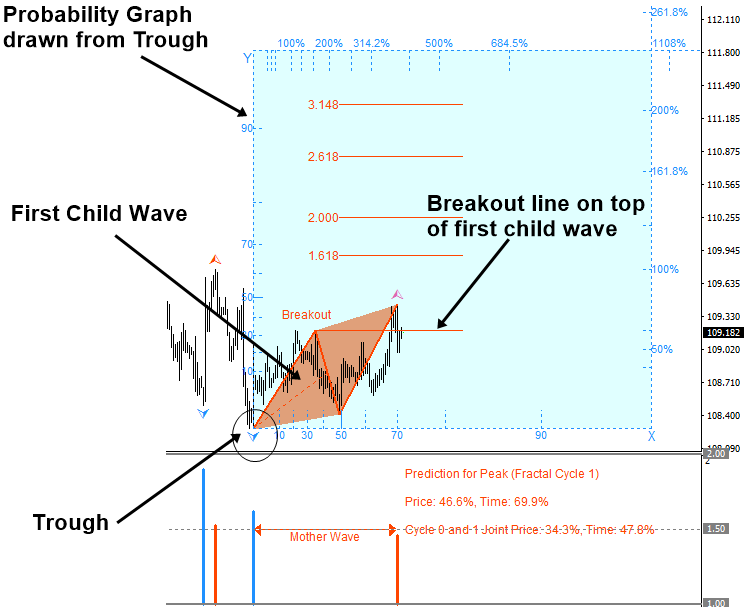
Figure 4.9-3: Bullish breakout trading example in USDJPY H1 timeframe (Step 1)
Now in step 2, we will be looking for some valid resistance line. To find the resistance line, we need to look back to find a higher peak. With the higher peak, the peak of first child wave can form a resistance line. The important point here is that to look at the gap between the breakout line and resistance line. The gap indicates the angle of resistance line in regards to the breakout line.
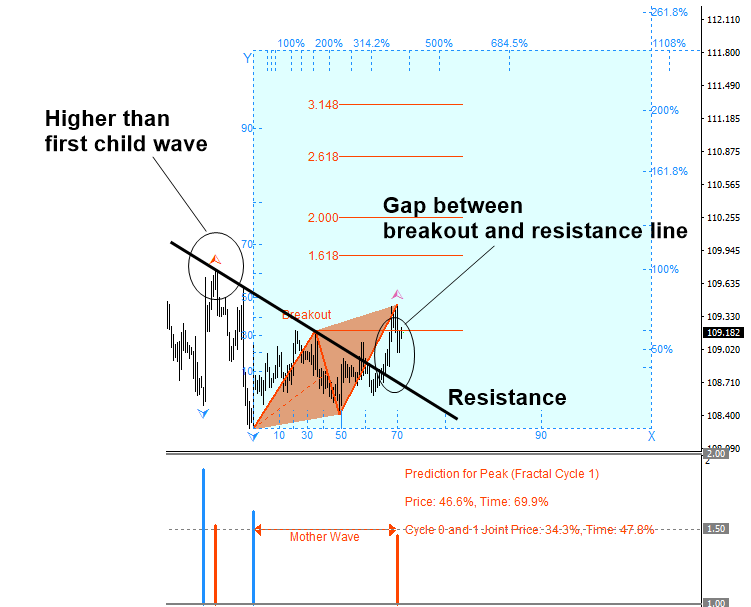
Figure 4.9-4: Bullish breakout trading example in USDJPY H1 timeframe (Step 2)
If you inspect the chart carefully, you will find that the resistance line provides the upper outline of triangle pattern. Hence, the breakout is in fact identical to the triangle breakout. In classic triangle breakout, your entry might start after the price moved outside the triangle. However, we recommend using the breakout line drawn from the first child wave for your entry. Additionally, watch out the angle of the resistance line. It is better if the resistance line is close to the peak of the first child wave rather than the trough of the first child wave. This is only rule of thumb though.
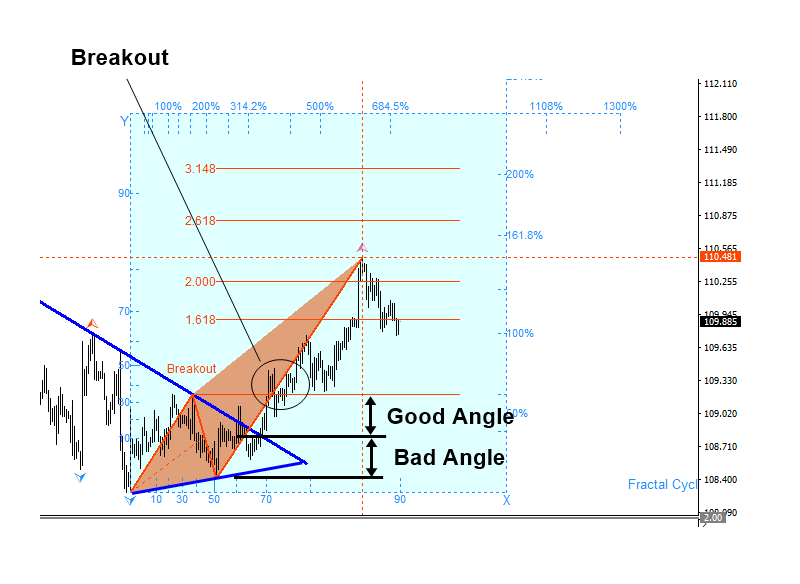
Figure 4.9-5: Bullish breakout trading example in USDJPY H1 timeframe (After breakout)
Here is another bullish breakout example in USDJPY H1 timeframe. The amplitude of the first child wave was 34.8%. We found higher peak to draw a resistance line too.
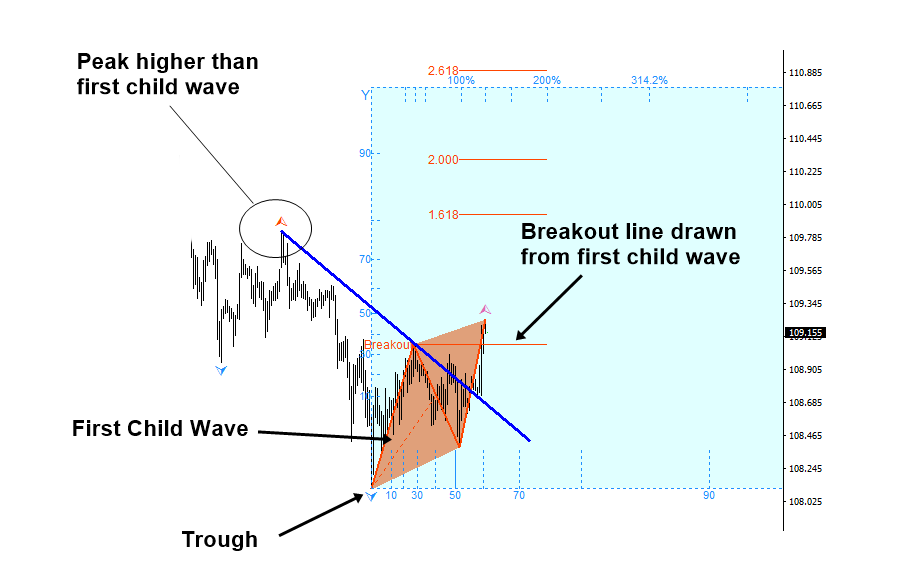
Figure 4.9-6: Bullish breakout trading example in USDJPY H1 timeframe (Before breakout)
In this example, the mother wave ended up having more than six child waves inside (Figure 4.9-7). In practice, you can have multiple of child waves inside one mother wave.
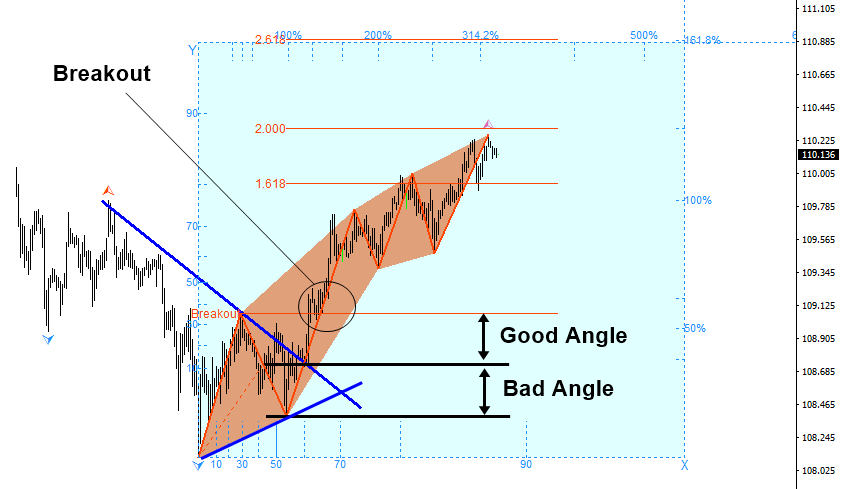
Figure 4.9-7: Bullish breakout trading example in USDJPY H1 timeframe (After breakout)
Now we will show some examples for bearish breakout. For the bearish example, everything we did in bullish example would be just mirrored around the horizontal line. In Figure 4.9-8, the first child wave was detected at the probability less than 10%. The breakout line was drawn on the bottom of the first child wave. This is step 1.

Figure 4.9-8: Bearish breakout trading example in EURUSD H1 timeframe (Step 1)
In step 2, we will be looking for the trough lower than the first child wave to draw the support line. The important point here is that to look at the gap between the breakout line and support line. The gap indicates the angle of support line in regards to the breakout line.

Figure 4.9-9: Bearish breakout trading example in EURUSD H1 timeframe (Step 2)
If you inspect the chart carefully, you will find that the support line provides the lower outline of triangle pattern. Hence, the breakout is in fact identical to the triangle breakout. In classic triangle breakout, your entry might start after the price moved outside the triangle. However, we recommend using the breakout line drawn from the first child wave for your entry. Additionally, watch out the angle of the support line. It is better if the support line is close to the trough of the first child wave rather than the peak of the first child wave. This is only rule of thumb though.
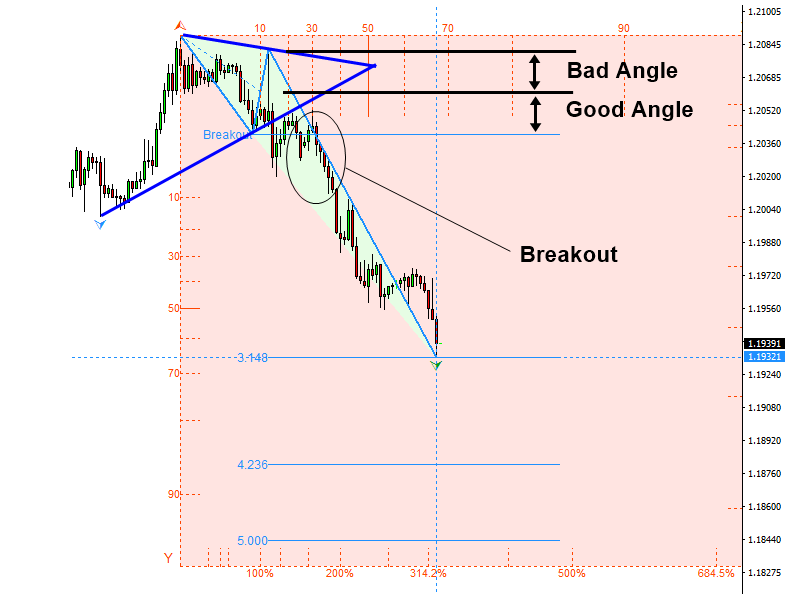
Figure 4.9-10: Bearish breakout trading example in EURUSD H1 timeframe (After breakout)
Here is another bearish breakout example in EURUSD H1 timeframe. The amplitude of the first child wave was less than 10%. We could find the lower trough to draw a support line.
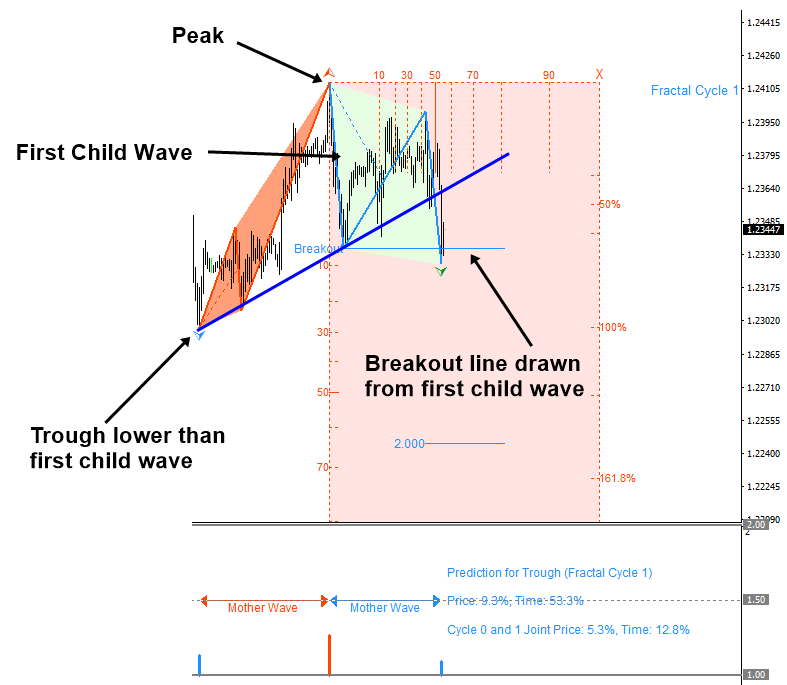
Figure 4.9-11: Bearish breakout trading example in EURUSD H1 timeframe (Before breakout)
In this example, the mother wave for bearish breakout was detected after another mother wave. In practice, it is possible to detect several mother waves in row.
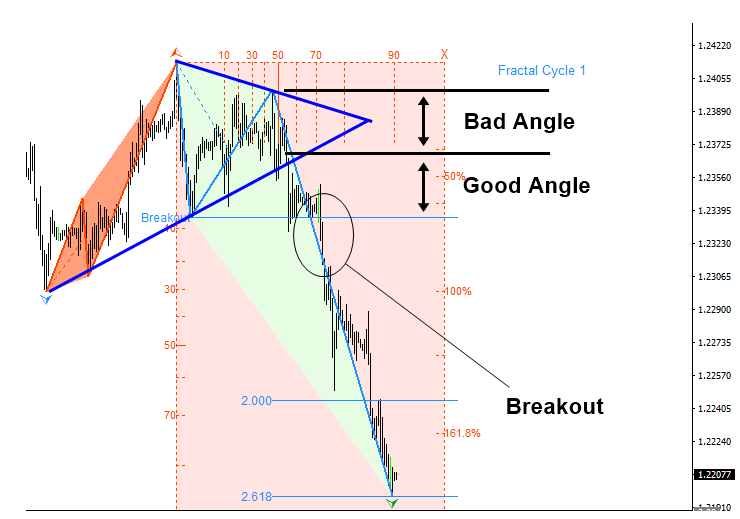
Figure 4.9-12: Bearish breakout trading example in EURUSD H1 timeframe (After breakout)
So far, we have covered both bearish and bullish breakout examples. Someone might ask what to do next if the breakout was successful. Of course, more price moves in your direction, you will gain more profits. However, as the mother wave become mature, there could be the time that price will reverse. We have already covered how to detect reversal movement with mature mother wave. Hence, you can go back to the previous chapter. The trading opportunity will be always alternating between breakout and reversal. In practice, I came across that some people are better at breakout trading than reversal trading and vice versa. You can only find out which technique you are better after some trials. There is no need for you to be good at both. However, as long as you keep practicing one technique, the other technique will be gradually improved too because you have to think about the exit strategy for your trading. For the demonstration purpose, we have used the simplest tool, which is the two-point support and resistance, to detect the geometric regularity in the examples. You can always combine or replace the support and resistance with the tools that are more sophisticated. For example, you might use three or four point support and resistance. Alternatively, you might use Fibonacci retracement or Elliott Wave analysis. You can choose the tools depending on your skill levels. Especially, people practicing the price action and pattern trading have the number of choices to detect the geometric regularity. We hope you to become the part of the price action and pattern trading community. So that you can enjoy various on and off line education for yourself.
Some More Tips about Fractal Waves and Stochastic Cycles
To understand how fractal waves and stochastic cycles can be related in forex trading, we need to focus on the broader principles of fractal geometry and cyclical analysis. Here’s how these concepts can be applied:
Fractal Waves
Concept
Fractal waves refer to the natural, repetitive, and self-similar patterns that occur at different scales in the market. This can include the identification of price patterns, Elliott Wave Theory, and other wave-based analysis.
Application
Fractal waves in forex trading involve recognizing these self-similar patterns to predict future price movements. Key methods include:
- Elliott Wave Theory: Identifies wave patterns consisting of impulsive and corrective waves.
- Harmonic Patterns: Uses specific Fibonacci ratios to identify potential reversal points (e.g., Gartley, Butterfly patterns).
Cyclical Analysis
Concept
Cyclical analysis in forex trading involves identifying repeating cycles in the market. These cycles can be based on time, price movements, or volume.
Application
Cyclical analysis focuses on recognizing recurring patterns and cycles to predict potential turning points. Key methods include:
- Cycle Theory: Identifies repeating cycles in market data, such as seasonal patterns, economic cycles, and price cycles.
- Fourier Analysis: A mathematical method to decompose time series data into cyclical components.
Relationship Between Fractal Waves and Cyclical Analysis
Synergy in Trading
- Wave Pattern Recognition:
- Fractal Waves: Identify self-similar wave patterns at different scales using Elliott Wave Theory or harmonic patterns.
- Cyclical Analysis: Recognize the timing of these wave patterns by identifying underlying cycles in the market.
- Timing Reversals:
- Fractal Waves: Use wave patterns to predict potential price movements and turning points.
- Cyclical Analysis: Use cyclical analysis to determine the likely timing of these turning points.
Practical Trading Strategy
Scenario: Analyzing GBP/USD on a daily chart using Elliott Wave Theory and cyclical analysis.
- Identify Wave Patterns:
- Use Elliott Wave Theory to identify a 5-wave impulse pattern followed by an A-B-C corrective pattern.
- Analyze Cycles:
- Apply cyclical analysis to determine the timing of the wave patterns. This could involve looking at historical price data to identify repeating time cycles (e.g., 20-day cycles, 50-day cycles).
- Combining Signals:
- Entry Signal: Enter a position when cyclical analysis confirms the timing of the end of a corrective wave and the start of a new impulse wave.
- Confirmation: Use additional confirmation methods such as volume analysis or price action signals to validate the cyclical timing.
Example
Scenario: EUR/USD on a 4-hour chart.
- Wave Pattern Identification:
- Identify a bullish 5-wave impulse pattern using Elliott Wave Theory.
- Recognize a subsequent bearish A-B-C corrective pattern.
- Cycle Timing:
- Perform cyclical analysis to identify a 20-period cycle in the price data, suggesting a reversal every 20 periods.
- Identify that the current corrective wave is nearing the end of a 20-period cycle.
- Combining Signals:
- Bullish Setup:
- The end of the A-B-C corrective pattern coincides with the end of the 20-period cycle.
- Enter a long position anticipating the start of a new impulse wave.
- Bearish Setup:
- Identify the end of a bullish impulse pattern coinciding with the end of a 20-period cycle.
- Enter a short position anticipating the start of a corrective wave.
- Bullish Setup:
Advantages of Combining Fractal Waves and Cyclical Analysis
- Improved Accuracy:
- Combining fractal wave patterns with cyclical timing can improve the accuracy of identifying key market turning points.
- Comprehensive Market Understanding:
- Fractal wave analysis provides insight into the structure and patterns of price movements, while cyclical analysis offers timing insights, resulting in a comprehensive trading strategy.
- Enhanced Risk Management:
- Better entry and exit points based on wave and cycle confirmation can enhance risk management and profitability.
Conclusion
Traders can effectively combine the broader concepts of fractal waves and cyclical analysis. This involves recognizing self-similar wave patterns and identifying repeating cycles in the market to predict future price movements and time entries and exits more effectively. By integrating these approaches, traders can develop robust trading strategies that leverage the natural rhythms and structures of the forex market.
About this Article
This article is the part taken from the draft version of the Book: Predicting Forex and Stock Market with Fractal Pattern. This article is only draft and it will be not updated to the completed version on the release of the book. However, this article will serve you to gather the important knowledge in financial trading. This article is also recommended to read before using Fractal Pattern Scanner, which is available for MetaTrader or Optimum Chart.
Below is the landing page for Fractal Pattern Scanner for MetaTrader 4 and MetaTrader 5. The same products are available on www.mql5.com too.
https://www.mql5.com/en/market/product/49170
https://www.mql5.com/en/market/product/49169
https://algotrading-investment.com/portfolio-item/fractal-pattern-scanner/
Below is the landing page for Optimum Chart
https://algotrading-investment.com/2019/07/23/optimum-chart/
Related Products


