Market Equilibrium
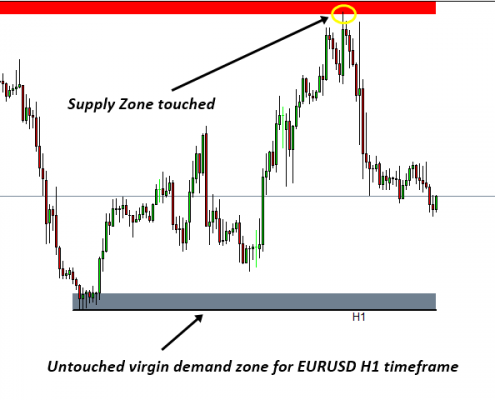
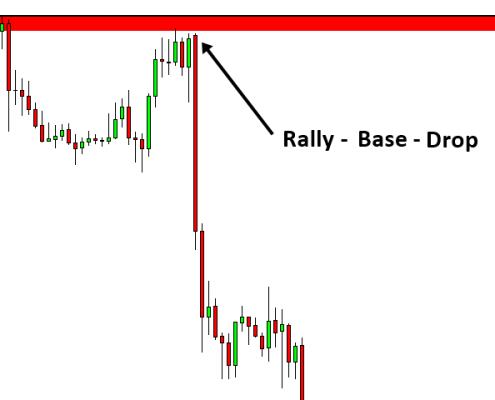
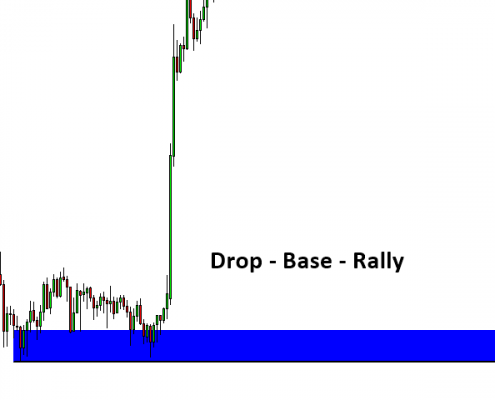
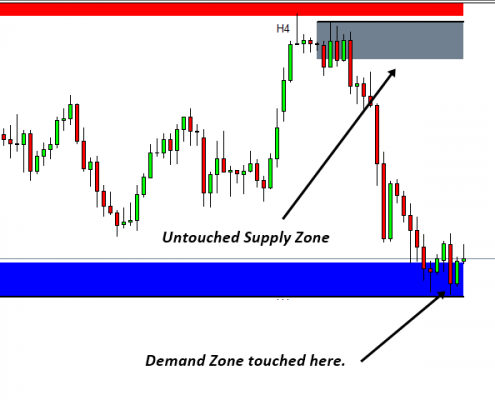
Mean Reversion Supply Demand is a market equilibrium indicator to identify the quantity mismatching between buying and selling volumes in Forex and Stock market. Mean Reversion Supply Demand uses supply and demand zone to detect the equilibrium movement in the market. To typical traders, supply demand zone serves as the turning point, sometimes breakout point too. Mean Reversion Supply Demand was designed to meet the comprehensive supply demand trading tactics for forex market. Mean Reversion Supply Demand you can identify the most important supply demand trading zones in few minutes. You can also plan your trading with autoamtically provided stop loss and take profit targets from the mean reversion supply demand. At the same time, Mean Reversion Supply Demand provides multiple timeframe analysis for your winning trading. Probably the description page is not long enough to list all the feautures of the mean reversion supply demand.
Market Equilibrium Indicator Features
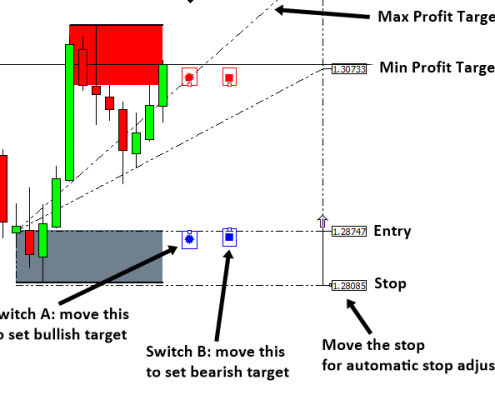
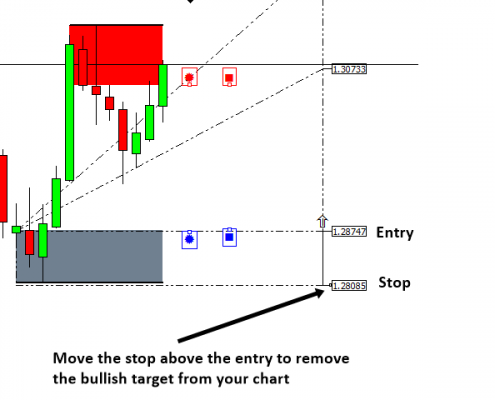
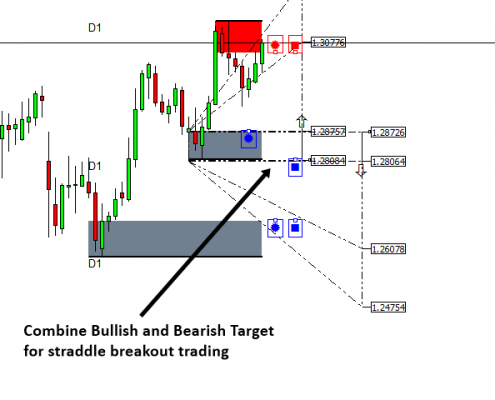
- Automatic profit target and stop loss detection for any supply demand zone
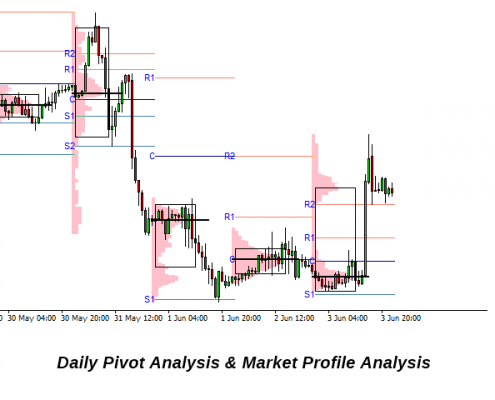
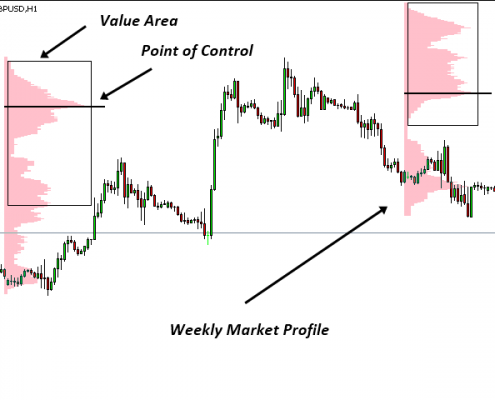
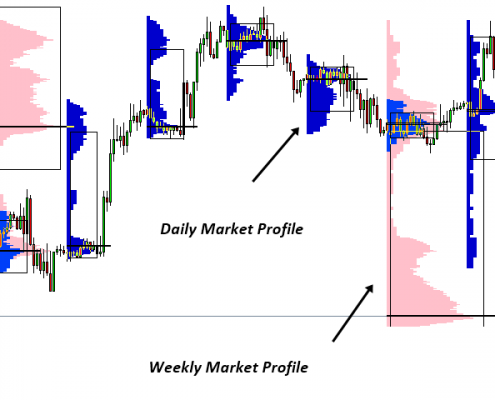
- Daily, Weekly and Monthly Market Profile Analysis to further gauge the mean reversion characteristics of market (Value area and point of control calculation included.)
- Daily, Weekly, Monthly Pivot Analysis to improve your mean reversion analysis
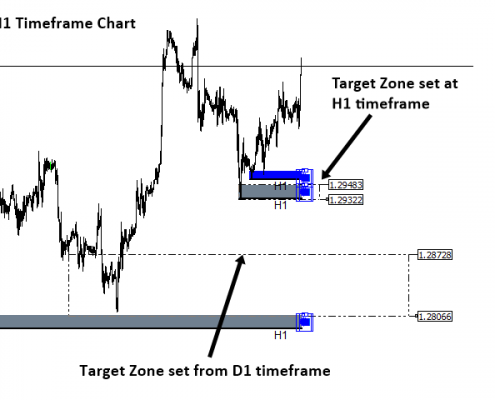
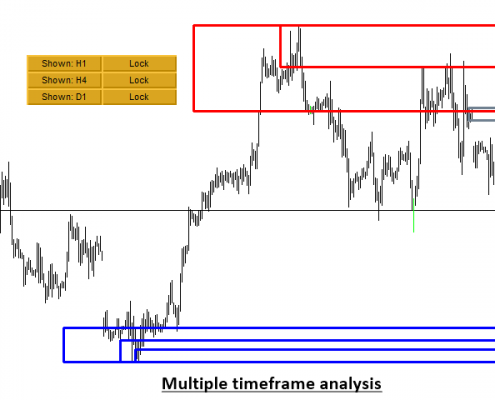
- Capability to do multiple time frame analysis on the same chart. (Simultaneous use of hourly, 4 hourly and daily supply demand zones are possible.)
- Automatic Retouch detection of each supply demand zone. (Easy to identify which zone is virgin and which are not.)
- Sound, Email, Push notification is possible when any supply demand zone is touched or for selected zone only (Recommended mode).
How to Use Mean Reversion Supply Demand
Mean Reversion Supply Demand offers daily, weekly and monthly Market Profile to gauge the odds of the mean reversion for the market. To construct the market profile, the timeframe for chart must be carefully chosen for the proper calculation of Market Profile. Normally it is important to recognize the price movement outside the value area. Daily market profile might offer you short term mean reversion opportunity comparing to weekly and monthly.
- Daily Market Profile: M5 to H1 timeframe can be used. M30 is recommended.
- Weekly Market Profile: M30 to H4 timeframe can be used. H1 is recommended.
- Monthly Market Profile: H1 to D1 timeframe can be used. H4 is recommended.
Beside the market profile analysis, you can also add daily, weekly and monthly Pivot Analysis to improve your accuracy. To detect valid supply demand zone, we recommend to use two or three timeframe at the same time in one chart to detect valid zone. For one example, you can open hourly chart and you can apply our Mean Reversion Supply Demand to detect hourly and 4 hourly supply demand zone in the same chart. Supply and demand zone confirmed in multiple timeframe normally offer better odds for your trading. When you have found the good supply demand zone for trading, click on Box of the Supply or Demand zone to see your trading setup including target profit, stop loss level (Fully automatic).
Other Technical Indicator
You can use Market profile and Pivot Analysis together to make your decision plus some simple trend indicator to ensure that you are not against long term trend. At the same time, hybridizing supply demand strategy with our other powerful tools can yield better results. Hybridization can always improve your odds of success in your trading. We offer diverse range of trading tools for serious traders.
- Harmonic Pattern Plus
- Harmonic Pattern Scenario Planner
- Price Breakout Pattern Scanner
- Sideways Market Analyser
- Elliott Wave Trend
Important Note
This product is the off the shelf product in the store. Therefore, we do not take any personal modification or personal customization request. For our products, we do not provide any code library or any support for your coding.
Indicator Setting
S/D Calculation Setting ===========================
- Use supply demand zone
- Timeframe for Calculation: timeframe to calculate Supply demand zone
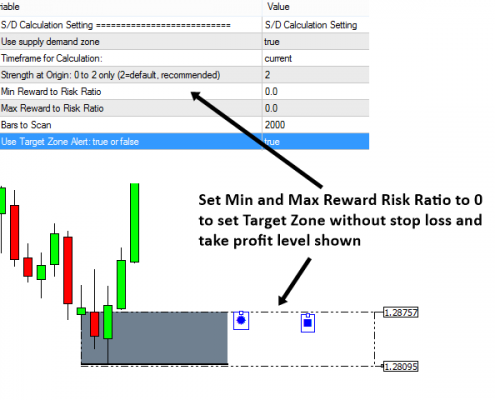
- Strength at Origin: 0 to 2 only (2=default, recommended)
- Min Reward to Risk Ratio: your preferred Min Reward/Risk ratio
- Max Reward to Risk Ratio: your preferred Max Reward/Risk ratio
- Bars to Scan: Bars to compute supply demand zone
Supply Demand Zone Setting ===========================
- Box Width: width for supply demand zone box
- Fill Box: true or false only
- Strong Supply Zone Color:
- Weak Supply Zone Color:
- Supply Zone retouch color:
- Demand Zone Weak color:
- Demand Weak Color:
- Demand Retouch Color:
- Show Entry Price at each Supply Demand Zone box
- Show Stop Price at each Supply Demand Zone box
- Stop Loss line with on supply demand zone box
- Stop Loss line Color on supply demand zone box
- Price Width for entry and stop price
Target Profit Setting ===========================
- Show Target Profit: true or false
- Target Profit Line color
- Target Profit line width: may be not applicable to dashed lines
- Show Price at the right side of the target profit level
- Target Profit vertical line offset
Multiple Timeframe Setting ===========================
- Show Timeframe text: true or false only
- Time frame text color:
- Time frame text size:
- M1 Text Offset:
- M5 Text Offset:
- M15 Text Offset:
- M30 Text Offset:
- H1 Text Offset:
- H4 Text Offset:
- D1 Text Offset:
- W1 Text Offset:
- MN1 Text Offset:
General Setting ===========================
- Use White Chart: true or false only
- Alert On Selected Zone only: Selecte Zone by click the box
- Enable sound alert for retouch
- Send email for retouch
- Send notification for retouch
- Write Supply Demand in text files
- File name when save Supply Demand
Market Profile Setting ===========================
- Use Market Profile:
- Session: daily, weekly or monthly only
- Color for Market Profile
- Median Color
- Value Area Color
Pivot Setting =====================
- Use Pivot Analysis
- Session: daily, weekly or monthly only
- Days to display
- Line Color for middle pivot line
- Line color for resistance
- Line color for supports
- Line width
- Price Lable size
- Text Font Size
- Text Color
Multiple Timeframe Analysis
Mean Reversion Supply Demand provide a convenient way for you to conduct multiple timeframe Mean Reversion Supply Demand in one chart. This means that you can collect the supply and demand zone from different timeframe and show them in single chart you are working on for your trading. For the multiple timeframe analysis, you need to apply Mean Reversion Supply Demand several times to your chart with different setting. Mainly you have to set the calculation timeframe and Button_Y to something new.
As recommended setting, if you wish to use Mean Reversion Supply Demand with two timeframes incluidng H1 and D1 in one chart. Then follow this setup:
1st Mean Reversion Supply Demand with calculation timeframe = current and Button_Y = 60.
2nd Mean Reversion Supply Demand with calcualtion timeframe = D1 and Button_Y = 80.

