Introduction to Momentum Trading
Profitable Trading Idea
In this article, we will explain how to use Price Momentum in Forex and Stock trading. We will start it by sharing some idea behind the profitable trading strategy. First of all, trading is an applied science. The profit for day trader comes from the good discipline driven by fact and evidence. Likewise, the profit for any systematic trading is the fruits of the good market analysis driven by fundamental and technical knowledge. To access more profits as a trader, you will need an improved discipline and technological advancement together allowing you to see the predictable behavior of the financial market. Many traders will highly emphasize that the technology is the key to success. Many will agree that the good automated indicators and tools will provide the edge to the average trader. It is the growing trend in the modern electronic trading environment.
Then where the profit comes from ? Profit comes from the regular movement in the market. That is something we can analyze and can make use to predict the next movement of the financial market. These five regularities shown in the Figure 1 are typically what traders are looking to catch in their trading. We highly emphasize to look for or focus on the fifth regularity in your practical trading. The fifth regularity says that the price in the financial market will move in the zigzag path. Mathematically, this is described as fractal wave or repeating patterns. Fundamentally these happens to balance the supply and demand force.

Figure 1: Price Pattern table listing the market dynamics in five categories.
Introduction to Excessive Momentum Trading
Excessive momentum is the technique to identify unusually strong supply or unusually strong demand by analyzing the price series. Why do we need to care about the unusually strong supply or unusually strong demand in our trading? It is because unusually strong supply or unusually strong demand are the sign of the end of the current trend ( or birth of new trend). As you probably guess, when the new trend is born, you can ride the highest profit as possible. Hence, the excessive momentum can provide you the attractive entries for your trading.
Now probably you are starting to make some sense. That is good. Your intuition will start to tell you that this excessive momentum can provide good trading opportunity. When the balance is broken marginally, we can consider it as the market anomaly. Two potential causes can drive the occurrences of Excessive momentum. Firstly, the excessive momentum could be caused by some irrational price reaction like the late comers buying stocks after the stock have gone up too much. Secondly, the excessive momentum could be caused by strong belief of the crowd that the price will continue to go in the same direction. Whichever scenario is driving the excessive momentum, it is where we can observe the crowd psychology clearly. Excessive momentum provides the good market timing. We will also confirm that with the volume spread analysis to make further sense with excessive momentum trading.

Figure 2: Excessive momentum with too strong demand

Figure 3: Excessive momentum with too strong supply
To explain the associated trading strategy with Excessive momentum, it is best to point out the four-market phase concept by Richard D. Wickoff (1873-1934). His framework is widely known as the Volume Spread Analysis. His four-market phase description is the most interesting subject among many traders. It is one of the most intuitive explanation behind the market dynamics.
The four-market phase includes accumulation, mark up, distribution and mark down (Figure 4). Four-market phase is the systematic view of market cycle. Volume spread analysis further extends accumulation and distribution areas into sub phase A, B, C, D and E (Figure 6 and Figure 7). These sub phase zone looks like some sort of sideways market. To be honest, I do not use the sub phase A, B, C, D and E for my trading because identifying these phase can be subjective and it is difficult to achieve them in systematic manner. Our focus here is more on accumulation and distribution area, the pattern made up from supply and demand fluctuations.
I believe that accumulation and distribution area can serve as useful entries in our trading operation. One thing trader should know is that Wyckoff Price Cycle is schematic and conceptual. In real world, we can not expect accumulation and distribution to arrive in turn always. Be more realistic. Figure 4 is only schematic diagram. In real world, any stock price can go up, rest and can go up again for fundamental reason. Likewise, stock price can go down, rest and can go down further. We can not expect that accumulation will always arrive after distribution. In fact, we can have as many accumulations as possible after accumulation. We can also have as many distributions as possible after distribution. I have drawn more realistic view of accumulation and distribution to prevent newbie’s getting wrong picture on the market behaviour around accumulation and distribution area (Figure 5). The difference is in your trading direction. When we have accumulation area after accumulation area, we will have continuous buy trend. When we have distribution area after distribution area, then we will have continuous sell trend. When we have accumulation and distribution area in turn, then we will have reversal opportunity. We will trade at turning point.
Simply speaking, sideways market zone in Figure 6 and Figure 7 can always serve as the springboard for the previous trend as well as for the reversal point. In addition, we could assume that accumulation area is where demand is exceeding the supply. Hence, price will go up after accumulation area. The distribution area is where supply is excessing the demand. Hence, price will go down after the distribution area. It is undeniable that these accumulation and distribution areas are important because this is where we get strong fresh momentum to start new trend or reversal. Placing your entry around these areas will increase your odd to win in the financial market. When these areas are identified correctly, market is much more profitable for your trading.

Figure 4: Four market phase concept in Volume Spread Analysis (source from StockCharts.com).

Figure 5: Realistic View of Four market phase concept in Volume Spread Analysis.
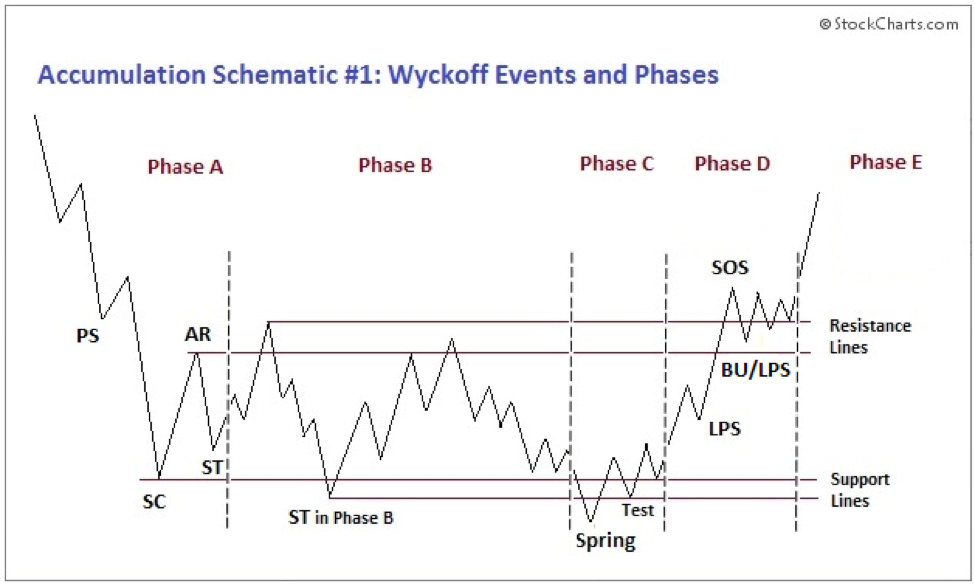
Figure 6: Sub phase A, B, C, D and E for Accumulation Area (source from StockCharts.com).

Figure 7: Sub phase A, B, C, D and E for Distribution Area (source from StockCharts.com).
Now if you are convinced how important these zones are, let us get back to the Excessive momentum. Excessive momentum can serve you as the systematic tool to detect these accumulation and distribution areas. Individual excessive momentum can be considered as an accumulation or distribution zone described in the four-phase market. To be more clear, you can confirm the accumulation area by creating the box below where the excessive momentum was started. Likewise, you can confirm the distribution area by creating the box above where the excessive momentum was started. Once this box is defined, you can predict the direction of new trend with higher accuracy.

Figure 8: Accumulation area detected by Excessive momentum indicator.

Figure 9: Distribution area detected by Excessive momentum indicator.
Volume spread analysis and excessive momentum zone are not a rocket science although detection of excessive momentum requires the sophisticated algorithm. But we did a lot of work to provide you the automated tools for your trading. With the automated Excessive Momentum detection tool, you can easily detect the broken balance between supply and demand for your trading. With excessive momentum drawn in your chart, it is much easier to predict the timing of new trend and its direction.
Here is three important summary about the Excessive momentum, Accumulation and Distribution area.
1. Excessive momentum provides the important clue to detect accumulation and distribution area outlined by Wickoff Cycle. Other methodology of finding Accumulation and Distribution area is not as good as the Excessive momentum indicator.
2. Detected Accumulation and Distribution area can indicate the fresh price movement that will expand in full scale. This is often the best entry or exit for your trading with highest rewards and smallest risks.
3. Accumulation and distribution area do not come in alternating manner. It can come like accumulation – accumulation – distribution or distribution – distribution – distribution – accumulation. Hence, do not get confused it from the original Wickoff cycle screenshot.
Excessive Momentum Indicator can detect the final phase of the price momentum. This final phase of the price momentum usually provide the good place to identify the accumulation and distribution area in Volume Spread Analysis. At the same time, this final phase of the price momentum is a excellent place to identify the supply and demand unbalance in the market. Excessive Momentum Indicator is the excellent tool for the advanced momentum trading. Here is link to Excessive Momentum Indicator for MetaTrader 4 and MetaTrader 5.
https://algotrading-investment.com/portfolio-item/excessive-momentum-indicator/
https://www.mql5.com/en/market/product/30641
https://www.mql5.com/en/market/product/30621
Related Products