Turning Point in Financial Market
Meaning of turning point is a point at which a significant change occurs. In financial market, the turning point refers to a point at which the trend direction changes. Profitable pattern is the technical analysis to detect the turning point of the financial market. We have shown that fractal wave is our specialized microscope in studying the profitable patterns in the financial market. Then you might be curious why turning points or zigzag price patterns happen fundamentally. This is an important question in our trading. The short answer is that people do not like to see price deviated too far from the fundamentals. Too far might be not the precise word. Too far indicates the extreme deviation. In statistical sense, this often indicates the case outside 95% confidence interval or higher. Let us illustrate some fundamentals that can make up the turning point in general sense.
The first fundamental example is earning of the company. Earning is the one of the most important fundamental that investors use to make the perception of the financial performance of the company. Hence, many of us use earning to buy or sell the stocks. If a stock price is too high over the earnings of the company (i.e. Price to Earning), this can create a turning point due to some sell pressure against recent buy trend. Likewise, if a stock price is too low over the earnings of the company (i.e. Price to Earning), this can create a turning point due to some buy pressure against recent sell trend.
Another fundamental example is that individual stock price tends to follow the index of the stock market. For example, Stock price of Amazon will follow S&P 500 index up to some degree depending on its market beta. If Stock price of Amazon is deviated too high from S&P 500 index, then this can create a turning point due to some sell pressure against recent buy trend. Likewise, if stock price of Amazon is deviated too low from S&P 500 index, then this can create a turning point due to some buy pressure against recent sell trend.
Now let us take some example from Forex market. EURUSD and AUDUSD are highly correlated. High correlated means that this two currency pairs often move together in the same direction. However, there are the cases that these two currency pairs can move in opposite direction for some notable period. If EURUSD is deviated too high from AUDUSD, then this can create a turning point due to some sell pressure for EURUSD against its recent buy trend. Likewise, if EURUSD is deviated too low from AUDUSD, then this can create a turning point due to some buy pressure for EURUSD against its recent sell trend. In fact, this is the basis of the Pairs trading strategy or Statistical arbitrage strategy.
We can take the two highly correlated instruments example in stock market too. Say we have Apple and United Technology stock prices are highly correlated. If United Technology stock price is deviated too high from Apple’s stock price, then this can create a turning point due to some sell pressure against the recent buy trend. Likewise, if United Technology stock price is deviated too low from Apple’s stock price, then this can create a turning point due to some buy pressure against the recent sell trend.
Some other important fundamentals that can create turning points in stock and forex market are the macroeconomic fundamentals. For example, GDP, employment rate, unemployment rate and inflation rate can create turning points depending on their positive or negative correlation to stock and forex market.
For example, say that the US employment rate and S&P 500 index are positively correlated. If S&P 500 price is deviated too high from the employment rate, then this can create a turning point in S&P 500 index due to the sell pressure against the recent buy trend. Likewise, if S&P 500 price is deviated too low from the employment rate then this can create a turning point in S&P 500 index due to buy pressure against the recent sell trend. Now let us take the example of negative correlation case. Say that unemployment rate and S&P 500 index are negatively correlated. If S&P 500 price is deviated too high from the employment rate, then this can create a turning point in S&P 500 index due to buy pressure against the recent sell trend. Likewise, if S&P 500 price is deviated too high from the employment rate then this can create a turning point in S&P 500 index due to sell pressure against the recent buy trend.
The same analogy can be applied in Forex market too. Say that the GDP of Great Britain is positively correlated to GBPUSD. Hence, when Great Britain achieves good GDP, then GBPUSD tends to rise. However, if GBPUSD is rising too fast and deviated too high from the GDP value, then this can create a turning point due to some sell pressure against the recent buy trend. Likewise, if GBPUSD is falling too fast and deviated too low from the GDP value, then this can create a turning point due to some buy pressure against the recent sell trend.
Many people think that only economic variables can create turning points in stock and forex market. However, this is not true. In fact, non-economic variable can create turning points for stock and forex market too. What matter is how highly the variable is correlated to the stock price or the currency. For example, say that the stock price of Company XYZ is positively correlated to temperature. Hence, if temperature goes up, then stock price of Company XYZ goes up too. However, if stock price of company XYZ is rising too fast and it is deviated too high from current temperature, then this can create a turning point due to some sell pressure against the recent buy trend. Likewise, if stock price of company XYZ is falling too fast and it is deviated too low from current temperature, then this can create a turning point due to some buy pressure against the recent sell trend.
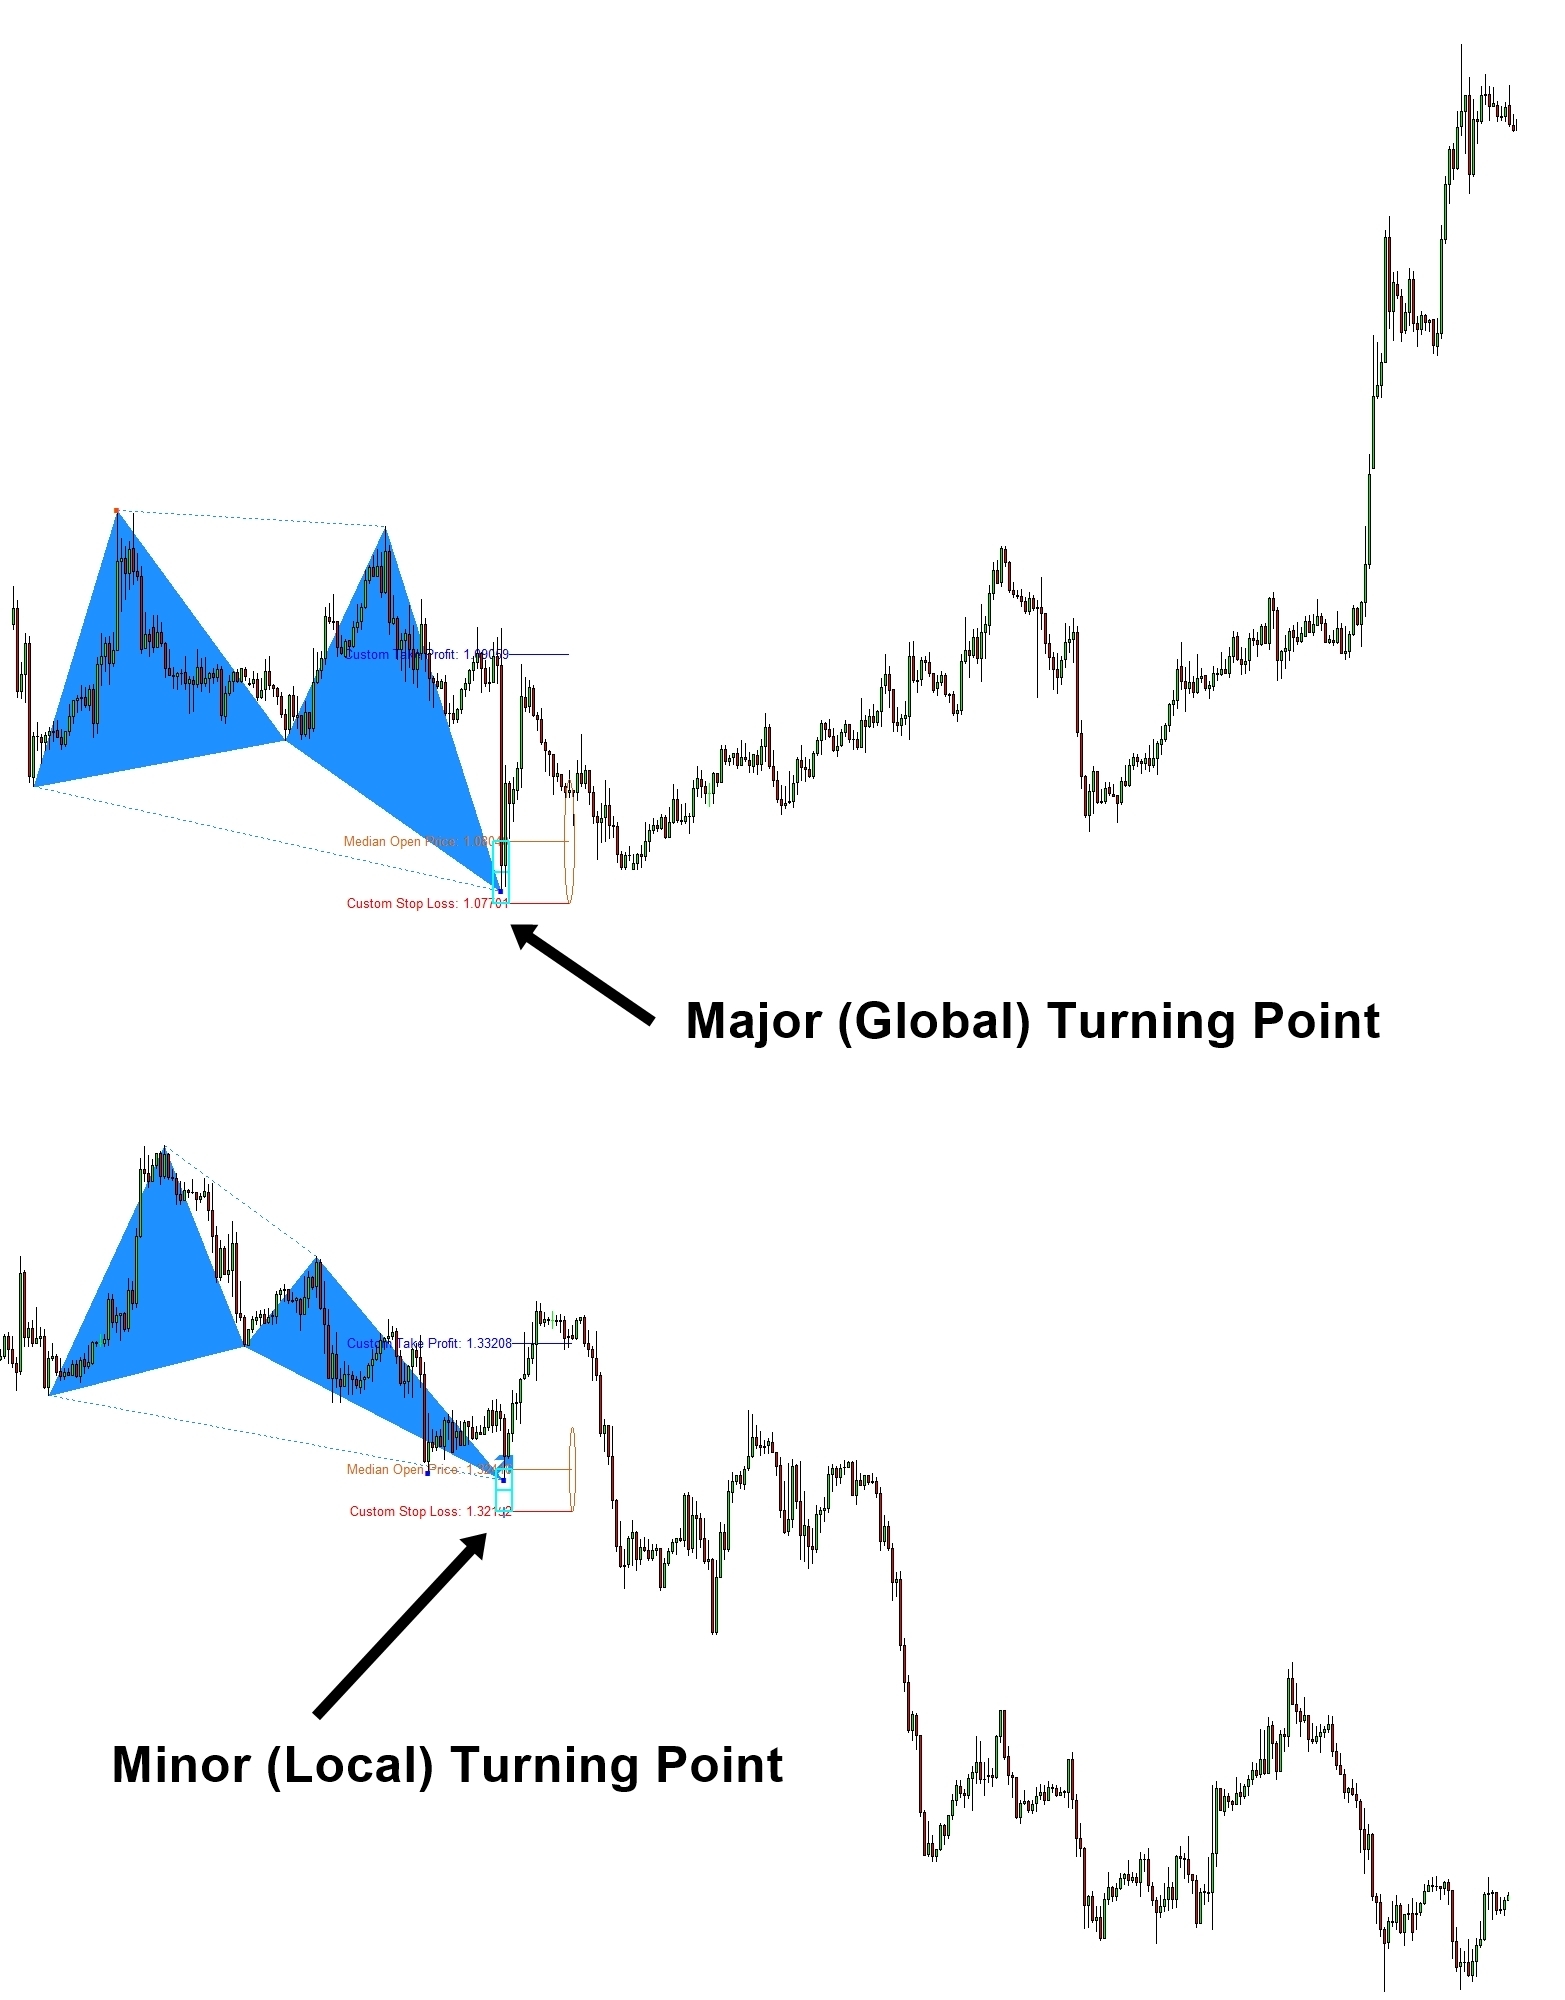
So far, we illustrated why we see the turning points and price must move in zigzag manner in Stock and Forex market. In fact, the list of fundamentals that can create turning point or influence in turning point creation is too many in real world. Trader and investors tends to use the most important variables only. Which fundamental is more influential in creating the turning point is depending on how highly they are correlated to the stock price or the currency. In real world, the effect of these variables will be cancelled each other to create less effect or add together to create bigger effect against current trend. When the resulting effect is strongly against the current trend, we can have major (i.e. global) turning point. Major turning point is the most wanted entry for our trading because it provides incredibly long profitable range for our trading. In fact, some professional traders are highly specialized in trading with this major turning point only.
When the resulting effect of all the fundamentals is moderate against the current trend, we can have minor (i.e. local) turning point. Minor turning point is still not bad as we have some room to take our profits. As long as you manage your risk, the minor turning point can still give us opportunity to grow our capital.
If the resulting effect is weak and insignificant, then we can have insignificant (i.e. failed) turning point. We cannot make money with this insignificant turning point because the turning point is almost not noticeable. The effect takes up only on one candle bar or even less. This sort of insignificant turning point can happen when the effect several fundamentals are cancelled off each other leaving almost zero effect against current trend. For example, we have excellent GDP but poor unemployment rate. Say their net effect of GDP and unemployment rate is zero. There is no reason that current trend need to be stopped.
As we have illustrated, many fundamental factors can influence creation of turning points. Pattern is the great technical tool in detecting turning points comparing to other technical indicators because it is not lagging. However, our success rate with patterns will be subject to probabilistic outcome. Hence, we need to have good risk management skills in place. To achieve good success rate with your trading, technically you will need to master how patterns work including Fibonacci price pattern, Harmonic Pattern, Elliott Wave Pattern and X3 patterns. On top of your technically skills, it is still important that you are aware of most influential fundamentals for the stock and currency that you are trading with. Typically, it is best to make the trading decision based on both patterns and the fundamentals together.
Turning Point in Financial Market
About this Article
This article is the part taken from the draft version of the Book: Profitable Chart Patterns in Forex and Stock Market: Fibonacci Analysis, Harmonic Pattern, Elliott Wave, and X3 Chart Pattern. Full version of the book can be found from the link below:
You can also use X3 Chart Pattern Scanner in MetaTrader to predict the turning point. Here is the product page for the X3 Chart Pattern Scanner. Enjoy the powerful non repainting and non lagging Harmonic Pattern and Elliott Wave Pattern indicator.
https://www.mql5.com/en/market/product/41993
https://www.mql5.com/en/market/product/41992
https://algotrading-investment.com/portfolio-item/profitable-pattern-scanner/
Below is the landing page for Optimum Chart (Standalone Charting and Analytical Platform).
https://algotrading-investment.com/2019/07/23/optimum-chart/
Related Products


