Winning Trading Strategy with Supply and Demand Indicator
A winning trading strategy is a methodology that a trader employs to make profitable trades consistently in financial markets. There isn’t a one-size-fits-all winning strategy, as what works for one trader may not work for another due to differences in risk tolerance, trading style, time horizon, and market conditions. However, some key components of winning trading strategies include Risk Management, Entry and Exit Signals, Backtesting, Discipline and Psychology. We will talk about A winning trading strategy in term of the supply and demand concept.
If you are the Forex trader or Stock trader, then you need the winning trading logic. The supply and demand concept is one of the tool that can help you to understand the winning trading logic. Supply and demand analysis is known as several different names in the trading community like the supply demand analysis, demand supply analysis, supply demand zone trading, demand supply zone trading, and so on. In fact, all these various names are referring to the same trading strategy. We can use the name “supply and demand analysis” . In essence, supply and demand analysis is one form of price pattern trading. The trading idea comes from understanding the supply and demand curve often appears in the Economic textbook. In fact, the supply demand analysis in trading involves to identify the price movement, which are caused by the unbalance in supply and demand. The practice does not require any math skills. However, it is more on the pattern recognition exercise with the chart.
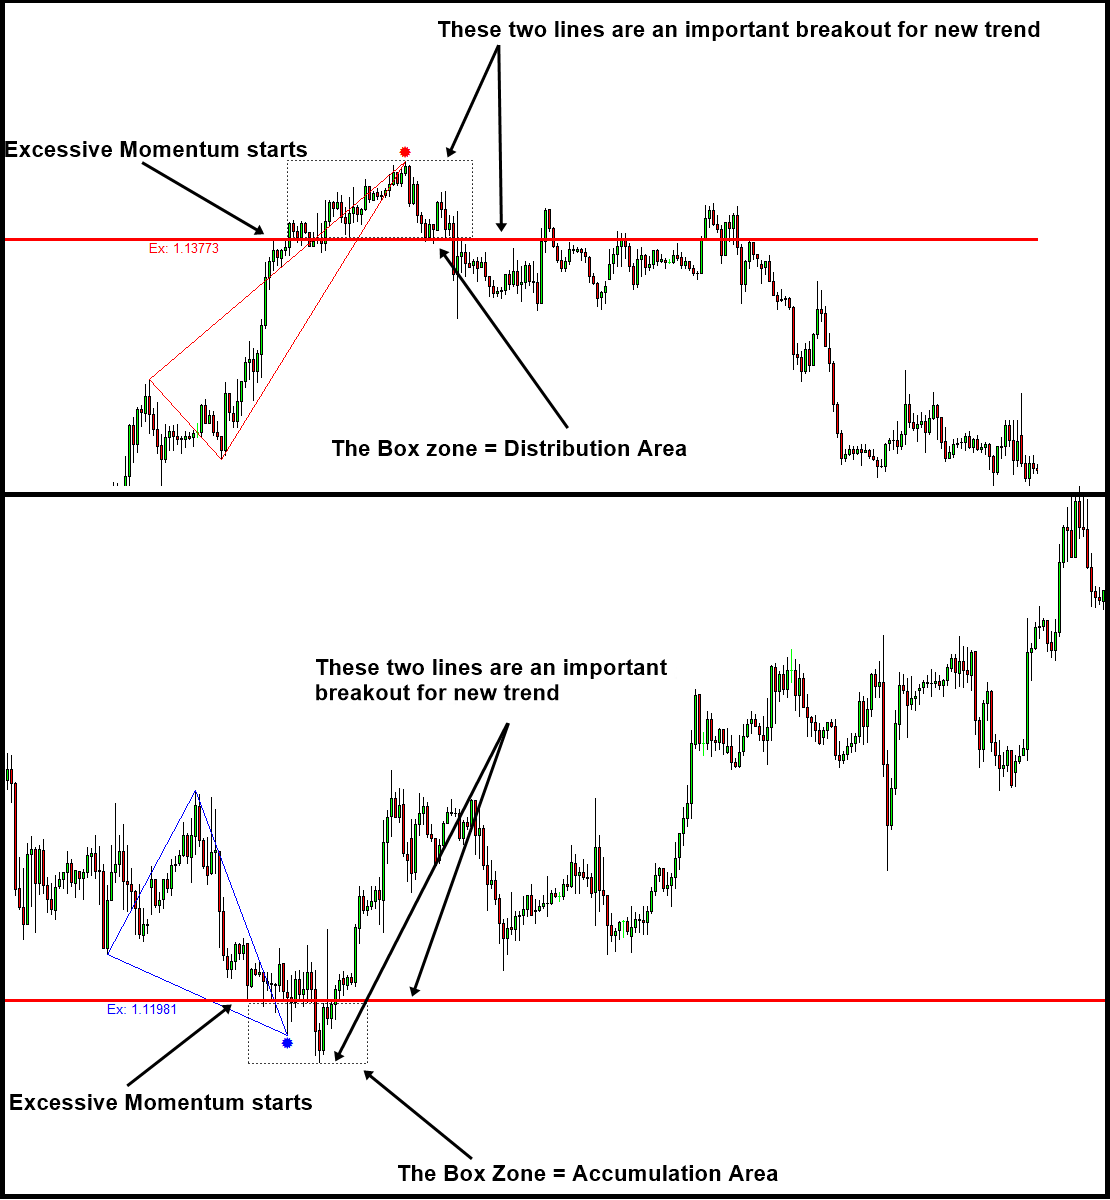
In terms of the technical analysis history, the supply and demand analysis shares some common characteristics with the volume spread analysis (VSA) devised by Richard Wyckoff in 1930s. In the volume spread analysis, Richard Wyckoff believed that the market shows the sideways move before making a strong bullish rise or bearish fall. Practically, the sideways market can be analysed by several different methods including the statistical method and pattern recognition method. He pointed that this sideways movement is the key area for our trading. He named this key areas as accumulation and distribution respectively for bullish and bearish trading. The key area consists of two prices forming a box zone. Similarly, the supply and demand analysis involves defining the key area to trade.
We introduced this supply and demand analysis for two reasons. Firstly, the supply and demand analysis is simple and straightforward. There is nothing wrong with simple strategy as long as they are effective. Secondly, this is another trading strategy to predict the fractal wave in Forex and Stock market. In another words, this trading strategy is a good demonstration on how to predict fractal wave (i.e. market cycle) for the starter using the peak trough analysis.
The supply and demand indicator is a tool used in technical analysis to identify areas of potential support and resistance on price charts. It is based on the principles of supply and demand, which influence price movements in financial markets.
Here’s how the supply and demand indicator typically works:
- Identification of Supply and Demand Zones: The indicator identifies areas on the chart where supply and demand are likely to be imbalanced, leading to potential reversals or significant price movements. These areas are often referred to as supply and demand zones.
- Supply Zones: Supply zones are areas on the chart where there is an excess of sellers relative to buyers, leading to downward pressure on prices. These zones are typically marked by previous highs, resistance levels, or areas where selling pressure has been significant.
- Demand Zones: Demand zones are areas on the chart where there is an excess of buyers relative to sellers, leading to upward pressure on prices. These zones are typically marked by previous lows, support levels, or areas where buying interest has been significant.
- Visual Representation: Supply and demand zones are often visually represented on price charts using rectangles or shaded areas. These zones serve as reference points for traders to anticipate potential price movements.
- Trading Strategies: Traders use supply and demand zones as part of their trading strategies. For example, they may look for opportunities to buy near demand zones and sell near supply zones, anticipating price reversals. Alternatively, they may wait for price to break through these zones as confirmation of a trend continuation.
Confirmation with Other Indicators: While supply and demand zones can be powerful tools on their own, traders often use them in conjunction with other technical indicators or chart patterns to confirm their trading decisions.
Supply and demand analysis is comparable to support and resistance. Broadly speaking, supply and demand analysis can be considered as the support and resistance up to some extent. However, there are some differences between them. Firstly, support and resistance on their own are more or less volatility prediction tool. In another words, they predict the price level with potential high volatility. However, supply and demand analysis with the pattern recognition provides the direction to trade. For example, depending on the price pattern, the supply and demand analysis predicts the bullish or bearish movement. Secondly, support and resistance use the line whereas the supply and demand analysis use the key area, which is the price range between two prices. In spite of these two differences, there are some cases where supply and demand zone are formed in the similar way as the support and resistance. Hence, there could be some theoretical debate on using the supply and demand analysis as the support and resistance. However, this might be the interesting extension for the supply and demand analysis.
As we have pointed out in our article, detecting the supply and demand unbalance is the most important key in making profits in Financial market. The excessive momentum indicator is the automated tool to detect these unbalance in supply and demand for your trading. With excessive momentum drawn in your chart, it is much easier to predict the timing of new trend and its direction.
Here is the insightful article explaining where the profits comes and how the profits are captured with the knowledge of excessive momentum. If you really want to make money in the market, must read this article. Reading does not cost you anything.
https://algotrading-investment.com/2018/10/29/introduction-to-excessive-momentum-trading/
This Excessive Momentum Zone can be considered as either Accumulation or Distribution area in the Volume Spread Analysis. You can further find the symptoms of accumulation and distribution area using our Volume Spread Pattern Indicator (Paid and Advanced version) or Volume Spread Pattern Detector (Free and Light version). You can watch the YouTube videos to find more about the Excessive Momentum Indicator.
YouTube Video Momentum Indicator: https://youtu.be/oztARcXsAVA
Here is link to Excessive Momentum Indicator available on MetaTrader 4 and MetaTrader 5 platform.
https://algotrading-investment.com/portfolio-item/excessive-momentum-indicator/
https://www.mql5.com/en/market/product/30641
https://www.mql5.com/en/market/product/30621
You can also use Ace Supply Demand Zone Indicator in MetaTrader to accomplish your technical analysis. Ace Supply Demand Zone indicator is non repainting and non lagging supply demand zone indicator with a lot of powerful features built on.
https://www.mql5.com/en/market/product/40076
https://www.mql5.com/en/market/product/40075
https://algotrading-investment.com/portfolio-item/ace-supply-demand-zone/
Related Products


