Price Pattern
“Head and Shoulder”, “Reverse Head and Shoulder”, “Double Top”, “Triple Top”, “Triangle Pattern”, “Falling Wedge” and “Rising Wedge” are the price pattern used in Forex, Futures and Stock markets. When you spot these patterns in your chart, you might be able to predict the future price movement in your chart, if not, you can at least, anticipate if the price can breakout outside the pattern or bounce back within the pattern. Many professional traders uses these Price Patterns in their daily trading setup.
The “Price Breakout Pattern Scanner” is designed to recognize these profitable breakout patterns from your chart. The main idea behind the “Price Breakout Pattern Scanner” is to help the traders to make faster and more accurate trading decision by automating these pattern recognizing process. In addition, we added a sophisticated Smart Renko charting facility as an extra supplementary feature (Optional). Both beginners and professional traders can enjoy stable performance using our Price Breakout Pattern Scanner.
Price Pattern Features
- Tradable Price Breakout Patterns can be detected automatically
- Email alerts can be setup
- Sound alerts can be setup
- Push Notification to your mobile Meta Trader terminal on your smart Phone can be setup
- Optional Smart Renko charting facility: you can use Smart Renko chart to get idea of current trends as well as to identify important support and resistance levels in conjunction with detected price breakout patterns
- Historical pattern forward and backward reply function to enable you backtesting and creating new trading strategy with the technical indicators you are comfortable with
- Pattern locking and unlocking feature to prevent repainting of patterns
- 52 different bullish and bearish Candlestick pattern recognition feature
- Automatic Round Number (psychological number detection)
Price Pattern Recognition
- Head and Shoulder
- Reverse Head and Shoulder
- Double Top
- Double Bottom
- Triple Top
- Triple Bottom
- Symmetric Triangle
- Rising wedge
- Falling wedge
- Candlestick patterns– Price Breakout Pattern Scanner can also detect 52 different bearish and bullish candlestick patterns. The candlestick patterns include hanging man, shooting star, engulfing, doji, harami, kicking, etc. Our Candlestick Pattern detection algorithm uses purely price action only.
- Smart Renko Brick Trend, support and resistance
Price Pattern Setting
Default setting will work generally. If you want to change how the indicator looks in your chart, you can change them as you wish. All the input setting are pretty much self-explanatory under input tab. The simple description is given on left hand side columns and you need to change value on your right hand side columns. If you want to read more details about input setting. You can read below for better control of our Price Breakout pattern Scanner.
1. Price Breakout Pattern Parameters 1 (User Option)
This inputs controls general functionality of Price Breakout Pattern Scanner. You can use Price Breakout Pattern Scanner for many different mode. If support and resistance are important for your trading, then you can run the Price Breakout Pattern scanner in Support Resistance mode. For that, set “Display As Support Resistance” = true. If you set “Display As Support Resistance” = false, then Price Breakout pattern scanner will show patterns drawn in triangles. With Price Breakout pattern scanner, it is possible to apply them in custom timeframe. This means that you can apply several price breakout pattern scanner in one chart. To apply price breakout pattern scanner in custom timeframe, set “Timeframe to detect Price Breakout Patterns” to your preferred one including H1, H4, D1, W1 or MN1, etc.
- Set false to switch off Price Breakout Pattern Scanning:
- Use Renko Filter for Pattern detection : true or false only
- Timeframe to detect Price Breakout Patterns
- Display As Support Resistance (true = support resistance, false = triangle)
- Max number of patterns to display: Control this input if you want to see more than one pattern simultaneously. For example, set this to 3, then price breakout pattern scanner will show 3 latest patterns at the same time.
- Pattern Index from which to display: 0 = default
- Enable sound alert: set to true to get sound alert
- Send email if pattern is found: set to true to receive email alert
- Send notification if pattern is found: set to true to receive push notification. Push notification is recommended over email notification.
- Print pattern in expert journals:
- Write patterns in text files: set to true if you wish to write patterns in text file
- File name when save pattern info
- Allowable margin when matching patterns (0.1 = 10% allowance)
- Use white background for chart: set false if you want to use default black background chart
- Max Bars to search pattern: use default
- Search Step ( 1: fine, >1: coarse) : use default
- Amount of bars to scan for pattern search (1500 = default): set this to more if you like to study and develop your own trading strategy
- Pattern Size Filter by Number of Candles: Filter out small patterns if you wish. If you want to see any size pattern, then set this to 0
2. Price Breakout Pattern Parameters 2 (Display Option)
This input controls interface of Price Breakout pattern scanner. For example, you can control color of each patterns, text size for pattern name, etc. You can also control the size of buttons from here. Especially if you wish to apply multiple Price Breakout Pattern Scanner in one chart, then you need to change the location of the button here. For example, set Button Coordinate Y to 80 if you want to offset the second button sets below your first button set from your previous Price Breakout Pattern Scanner. Likewise, you can set button coordinate Y to 100 if you want to offset the third button sets below your second button sets assuming that you are using button height 20.
- Bullish Breakout Pattern color
- Bearish Breakout Pattern color
- Bothway Breakout Pattern color
- Bullish Breakout Locked Pattern color
- Bearish Breakout Locked Pattern color
- Bothway Breakout Locked Pattern color
- Text size for name (0 = disable)
- Text size for trade instruction (0 = disable)
- How long the line should be projected (default = 2)
- Fill patterns with color
- Change size of ray for line object
- Support Resistance Line Width
- Use Small Button (G & B buttons): true or false only
- Button Coordinate X: 10
- Button Coordinate Y: 60 (80, 100, 120, 140 for next timeframe)
- Button Width: 60
- Button Height: 20
- Text size for button: 10
3. Price Breakout Pattern Parameters 3 (Search Option)
With this input, you can enable and disable pattern type. For example, if you do not want to see Triple Top Pattern, then set “Triple Top Pattern” = false.
- Search Triangle Pattern
- Search Falling Wedge Pattern
- Search Rising Wedge Pattern
- Search Head and Shoulder Pattern
- Search Reverse Head and Shoulder Pattern
- Search Double Top Pattern
- Search Double Bottom Pattern
- Search Triple Top Pattern
- Search Triple Bottom Pattern
4. Price Breakout Pattern Parameters 4 (Custom Risk Control)
With this input, you can set to see guided trading instruction. While you are trading, check this guided trading instruction to set your profit goal realistically.
- Use Custom Stop Loss and Take Profit
- Risk Reward Ratio (Reward/Risk): user more than 1.0
- Custom Take Profit and Stop Loss Line Length
- Custom Take Profit and Stop Loss Line Width
- Custom Take Profit and Stop Loss Text Size
- Custom Take Profit Color
- Custom Stop Loss Color
- Custom Open Price Color
- Show Guided Trading Instruction
- Guided Trading Instruciton X Coordination
- Guided Trading Instruction Y Coordination
- Your Target Success Rate: 55%(0.55) = default
- Your Risk per Trade: 2% (0.02) = default
- Your Target Trade Number: 100 = default
Button Description in your chart
There are six buttons in chart for your convenience. Price breakout pattern scanner scans many historical bars and store patterns in the memory. Depending on your data, sometime, it can store as many as 100 patterns and sometimes, there can be no pattern at all. Price breakout pattern scanner will show pattern one by one in time order for your optimal analysis. However, you might want to see previous patterns for your analysis. In that case, you can press the button “<<” once. Click the button “<<” twice, to go back to more previous patterns. Likewise, while you are looking at old patterns, you might want to see newer patterns, then click the button “>>”. Sometime, you want to trade with a particular pattern. You may need to observe the patterns for some times. In that case, click the button “Lock” to lock the pattern from your chart. The locked pattern will remain even new pattern is found in the future. To unlock the pattern, just click the button “Lock” once more. Next to “Lock” button, you can see timeframe button like H1, H4, D1, etc. This button is there to show that these buttons are controlling the price breakout pattern scanner for the time frame. In fact, when you click this time frame button, Price breakout pattern scanner will recalculate over all the historical bars again. Sometime, when you believe that recalculation is necessary, then just click this timeframe button. The small button “G” can control the appearance of guided trading instruction. The small button “B” can hide or unhide all the other buttons from chart.
Recommended Usage
You will need Meta Trader 4 or Meta Trader 5 platform installed in your computer to use this indicator.If you are going to use VPS, then we recommend to use at least 2G Ram or more. You can apply it to any time frame including M1, M5, M15, M30, H1, H4 and daily. You can also apply it to any currency pairs or future contracts tradable through your brokers.
You may apply established conventional trading setup upon breakout pattern detection but you can also apply modified trading setup according to your backtesting and strategy development. Note that our Price Breakout Pattern Scanner allow you to create your own trading strategy in full scale. When the pattern is detected, you can trade several different ways including:
- Prediction of direction of future price movement
- Breakout of price outside the detected pattern
- Bouncing back of price within the detected pattern
Compatibility with Other Trading Strategy
Price Breakout Pattern Scanner is powerful trading system on its own. However, Price Breakout Pattern Scanner can be combine with many trading system. For example, the Price Breakout Pattern Scanner is perfectly compatible with Harmonic Pattern Plus or Harmonic Pattern Scenario Planner. You can combine the power of Harmonic Pattern with these price breakout patterns to improve your profits. You will be one of very few traders who makes sophisticated trading decision by combining these two advanced tools. You can also add full version of Smart Renko Tool on top of Price Breakout Pattern Scanner for backtesting and developing strong and unique trading strategy based on trend and price action of Renko chart.
Important Note
This product is the off the shelf product in the store. Therefore, we do not take any personal modification or personal customization request. For our products, we do not provide any code library or any support for your coding.
YouTube Video about Price Pattern
YouTube Link: https://www.youtube.com/watch?v=aKeSmi_Di2s
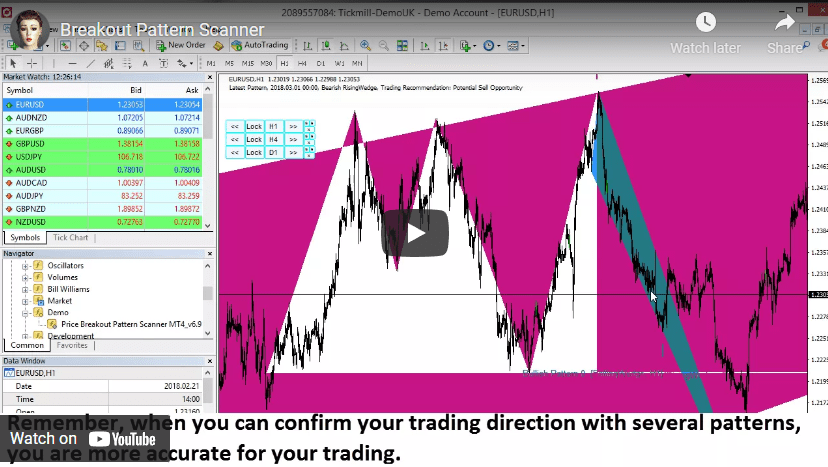
Price Pattern YouTube