Supply Demand Zone Trading Guide
In Technical Analysis, Supply and Demand zone can be considered as the extended version of support and resistance trading with several advantages for your trading. The advantage of Supply demand zone over the support and resistance is the capabilty to control your risk. It does not mean that you can not controll the trading risk with support and resisatnce. However, it is typically harder to controll your trading risk with support and resistance. In supply demand zone trading, we concern the trading zone instead of just a price level.
Say that you want to trade with the continuation buy pattern (i.e. rally base rally pattern) in D1 timeframe for Bitcoin. This involves trading with the demand zone for buy setup. After identifying the demand zone, you need to decide your stop loss and profit target. Typically, the stop loss comes at the bottom of the demand zone. However, I do not recommend to put the tight stop loss at the bottom of the demand zone because sometimes the price can touch the bottom of the demand zone before making a sharp upward movement. Hence, try to give some margin below the bottom of the demand zone. If you can draw sufficiently high profit target, you can have bit more margin. Hence, the size of margin really depends on the Reward to Risk ratio. Next, the sensible place to set your profit target is near the peak of the last rally. However, if you believe that the surrounding market condition is strong bullish, then you can set the profit target higher. Hence, depending on the surrounding market condition, you can set your profit target above the peak or you can set your profit target below the peak.
For successful trading, it is important to analyse your trading. Typically, we can use some measurements to assess this. The win rate is one of them to analyse your trading. The win rate tells how often your trading is successful. For example, if your trading is successful for five times out of ten trades, then the win rate is 50%. The next important measurement for your trading is the breakeven win rate. The breakeven win rate is referred to the minimum win rate to breakeven. In another words, you will make money if your win rate is above the breakeven win rate and you will lose money if your win rate is below the breakeven win rate. To make money, do we need 90% win rate or 75% win rate? What sort of win rate will you need to make money? How can we check or calculate the correct win rate we need to achieve? In fact, the answer depends on the reward to risk ratio (=Reward/Risk). In another words, the win rate to make money can be known by comparing the size of target profit (=reward) against the size of stop loss (=risk).
We provide our own Supply and Demand Zone indicator, Ace Supply Demand Zone Indicator. This is non repainting supply and demand zone indicator.
Supply and Demand Features
- Automatic profit target and stop loss detection for any supply demand zone
- Daily, Weekly and Monthly Market Profile Analysis to further gauge the mean reversion characteristics of market (Value area and point of control calculation included.)
- Daily, Weekly, Monthly Pivot Analysis to improve your mean reversion analysis
- Capability to do multiple time frame analysis on the same chart (Recommended to use no more than two zones per chart)
- Automatic Retouch detection of each supply demand zone. (Easy to identify which zone is virgin and which are not.)
- Sound, Email, Push notification is possible when any supply demand zone is touched or for selected zone only (Recommended mode).
Trading Direction
You can perform the typical supply and demand zone trading. For example, you can use Supply and Demand Zone to predict market direction (Drop Base Rally pattern, Rally Base Drop pattern, Rally Base Rally pattern, Drop Base Drop pattern). Secondly, you can also use the supply demand zone as the horizontal support and resistance. On top of that, you can use Market Profile as an additional decision making tool.
- Supply Demand Reversal Trading
- Supply Demand Continuation trading
- Market Profile
- Support Resistance
- Price Pattern trading
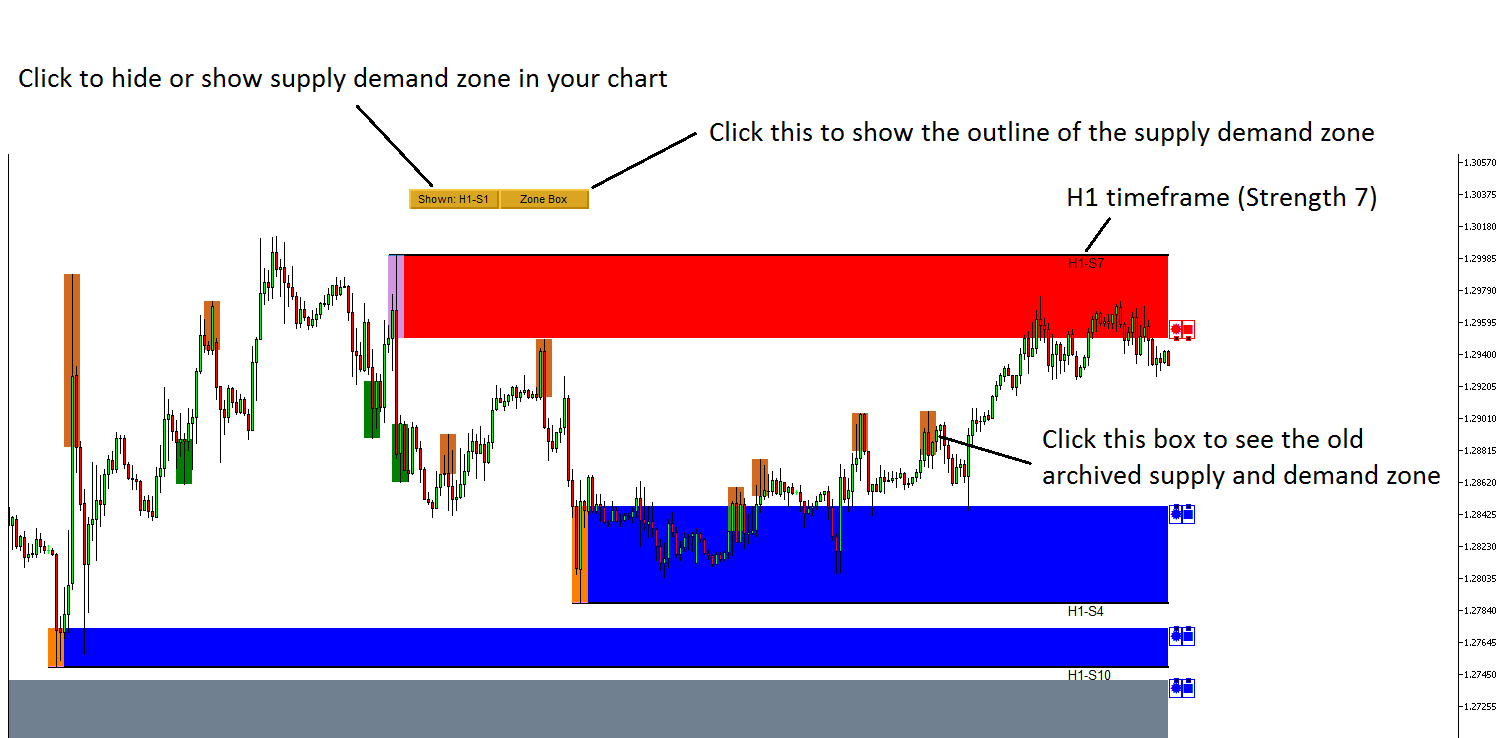
Here is the basic guideline in using Ace Supply Demand Zone indicator. First of all, here is what the notation like H1 or S3 means in your chart when you applied this Supply Demand Zone indicator.
- H1 = Zone detected in H1 timeframe
- S3 = Zone Strength 3
You can also show or hide zones from your chart using button click. Check the screehshot for some more tips.
Below are the links to the Ace Supply Demand Zone indicator for MetaTrader 4/MetaTrader 5.
Below is link to Ace Supply Demand Zone Indicator.
https://www.mql5.com/en/market/product/40076
https://www.mql5.com/en/market/product/40075
https://algotrading-investment.com/portfolio-item/ace-supply-demand-zone/
Related Products


