Price Breakout Pattern Scanner and Smart Renko
Price breakout pattern scanner is very unique tool in the market because this pattern scanner have built in feature for Smart Renko inside. Before using the Renko Feature, let us cover what is renko chart first in Forex and Stock market context. The relationship between a Price Breakout Pattern Scanner and Smart Renko can be complementary in terms of technical analysis and trading strategies, particularly in identifying breakout patterns and smoothing price movements.
Here’s how they can work together:
- Price Breakout Pattern Scanner: A Price Breakout Pattern Scanner is a tool used to identify various breakout patterns in price charts, such as triangles, rectangles, flags, and pennants. It scans historical price data to detect instances where price breaks out of consolidation patterns, signaling potential trend continuation or reversal. Traders use breakout patterns to anticipate significant price movements and adjust their trading strategies accordingly, often entering trades in the direction of the breakout.
- Smart Renko: Renko charts are a type of charting technique that filters out minor price movements and focuses on significant price changes. Smart Renko is a variation that uses intelligent algorithms to adjust brick size dynamically based on market volatility. Smart Renko charts help traders visualize price trends more clearly by removing noise and providing smoother price action. Each brick represents a predefined price movement, rather than time intervals. Traders use Renko charts to identify trends, support/resistance levels, and potential entry/exit points with greater clarity compared to traditional candlestick or bar charts.
Now, let’s explore how these two tools can complement each other:
- Confirmation of Breakouts: Smart Renko charts can provide a clearer view of price trends and breakout movements. When a breakout pattern is identified using the Price Breakout Pattern Scanner, traders can confirm the breakout by analyzing price movements on Smart Renko charts. This confirmation can increase confidence in the validity of the breakout signal.
- Trend Confirmation and Entry Points: Smart Renko charts help traders identify trends more easily. After a breakout is confirmed using the Price Breakout Pattern Scanner, traders can use Smart Renko charts to assess the strength and direction of the trend. This information can guide entry points and help traders ride the trend with reduced noise interference.
- Filtering False Signals: Smart Renko charts filter out minor price fluctuations, reducing the likelihood of false breakout signals. By combining breakout pattern detection with Smart Renko analysis, traders can potentially avoid entering trades based on false breakouts that may occur in volatile or choppy market conditions.
- Trade Management: Once a trade is initiated based on breakout patterns, Smart Renko charts can help traders manage their positions by providing clear support/resistance levels and trend direction indications. This can assist traders in setting stop-loss orders, trailing stops, and profit targets more effectively.
In summary, the Price Breakout Pattern Scanner and Smart Renko can complement each other in identifying breakout patterns, confirming trend directions, and improving trade management. By integrating these tools into their trading strategies, traders can make more informed decisions and potentially improve their trading outcomes.
Renko chart is the popular visualization technique, which does not use the fixed time interval. The charting principle of the Renko Chart is quite different from the rest. For example, Renko chart is constructed by drawing bricks of fixed height in series. To illustrate the idea, if the price moved up by 5 points from the top of brick, then we will draw one white up brick. Likewise, if the price moved down by 5 points from the bottom of the brick, then we will draw one black down brick. The brick will be drawn either on the top or on the bottom of the other brick always.
Consider what happens when we transform about 100 candlesticks into Renko bricks with height of 20 pips in EURUSD 1 hour chart. As you can guess, Renko bricks are much more concise and 100 candlesticks was transformed into only 52 Renko bricks. During this transformation, we are losing time information of our candlestick chart. Another important point you can observe here is that the Renko chart provide much smoother and readable visualization representation of trend. This is because the equal height of Renko brick reduces a lot of noise present in candlestick chart. With Renko Brick chart, it is much easier to identify trend and reversal patterns.
There are some drawbacks in Renko chart too. Because Renko chart lose all time information from our candlestick chart, you are no longer able to compare your normal candlestick chart to your Renko chart. In addition, unlike the candlestick chart, you have to select the sensible height of brick. Since there are many benefits using Renko chart, some traders are never worried about these disadvantages. Overall, Renko chart provide quite a lot of features which other chart does not provide.
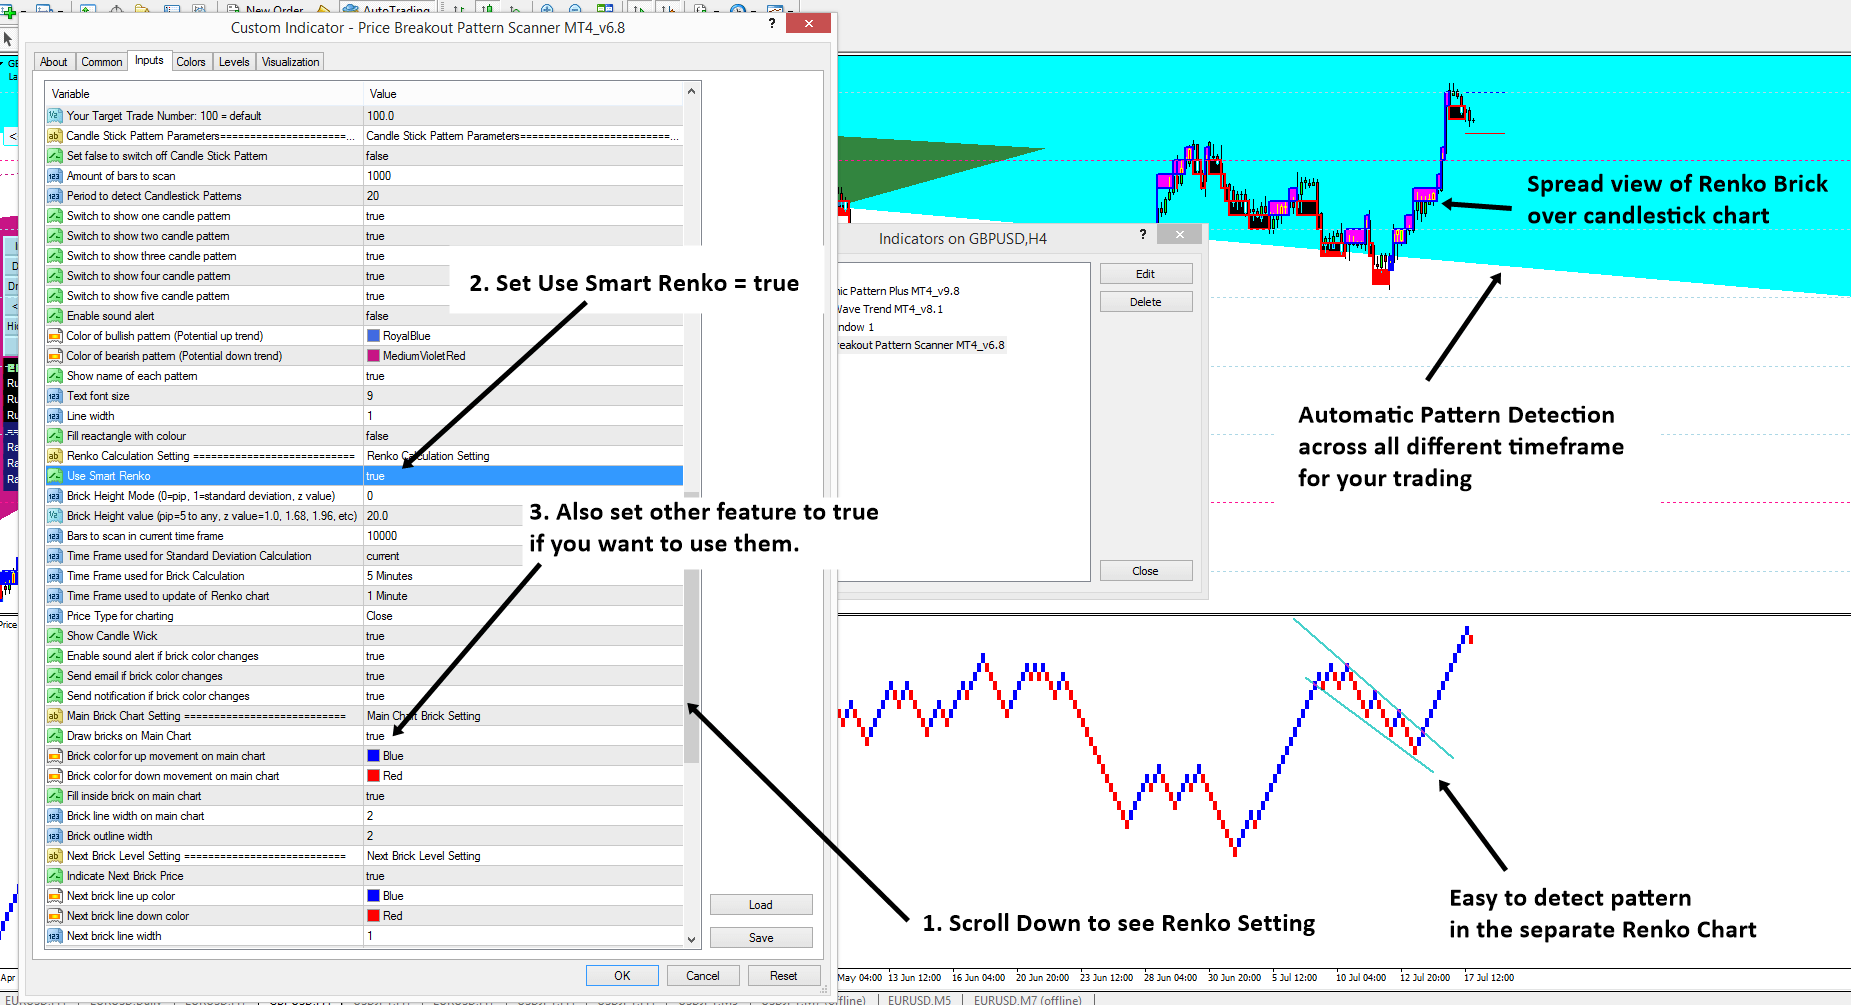
Smart Renko is really helpful for any pattern detection in the separate window. So they will reinforce your trading decision. Imagine that in the candlestick chart, Price Breakout Pattern Scanner is automatically detecting the patterns for you. In the indicator window, you can also detect any other important patterns readily. If you can collect evidence for your trading from both candlestick chart and renko chart, you can make very powerful trading decision.
Let us show how to switch on and off the Smart Renko chart from your price breakout pattern Scanner. Before you are using Smart Renko feature enabled, you might download sufficient history in your chart first. Once you have done it, set Use “Smart Renko = true” from your indicator setting. See the screenshots for your better understanding. Some of our customer know that there is great way of trading with Price breakout pattern scanner and our Harmonic Pattern Plus (or Harmonic Pattern Scenario Planner or Profitable Pattern Scanner).
Here are the links for the Price Breakout Pattern Scanner for MetaTrader 4 and MetaTrader 5 platform.
https://www.mql5.com/en/market/product/4859
https://www.mql5.com/en/market/product/4858
https://algotrading-investment.com/portfolio-item/price-pattern-scanner/
Related Products


