Gann Angles with Probability
We believe that you have the complete understanding on how to use the geometric prediction equation in your financial trading by reading all the guidance given in this book. In fact, the geometric prediction equation can be applied outside the Forex and Stock market trading. For example, the fashion, architecture, and engineering are all applicable area. You can always bring the general version of geometric equation for your area. By tuning the equation for your specific needs, you can make the successful career in your industry. Just remember that in some industry, you might have to consider the colour variable in your equation to make the geometric prediction more accurate. In addition, you might have to tweak the type of variables in both statistical regularity and geometric regularity.
Geometric Prediction (General version) = statistical regularity + geometric regularity + surrounding knowledge around object
In this chapter, we will provide you one special example of geometric regularity to aid your understanding on the geometric prediction. In the previous chapters, we have used the intersection, proportion, and ratio to find the geometric regularity in the chart in the Forex and Stock market. You might notice that this regularity was based on either price dimension or time dimension. By extending the concept further, it is possible to have a cross dimensional geometric regularity. For example, the slope between price and time axis are the good example of the cross dimensional geometric regularity. Especially, we can show that the turning point probability in price and time dimension can be used to provide the answer to the unsolved questions in the trading community for many decades.
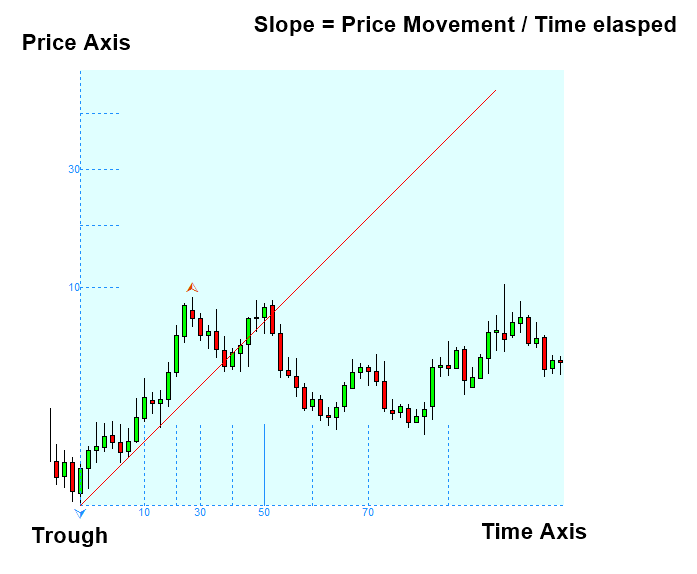
Figure 4.7-1: The conceptual drawing of slope in the candlestick chart
Let us have a look at the first idea of using the slope in the financial trading. The very first idea of applying the slope (or angle) in the financial trading was conceived by W. D. Gann. In 1935, Gann used the angles to predict the Stock market. He also shared his idea through his written course (Gann, 1996). In his book, he measured the angle using the ratio of 1 unit price to 1 unit time. He recommended using the paper with 8 x 8 grid to inch to draw these angles. He presented the nine important angles for trading. The first important angle is the 1 x 1 angle where 1 unit of price movement is equating to 1 unit of time movement.
| Angles | Angles in degrees |
| 1×8 | 82.5 |
| 1×4 | 75 |
| 1×3 | 71.25 |
| 1×2 | 63.75 |
| 1×1 | 45 |
| 2×1 | 26.25 |
| 3×1 | 18.75 |
| 4×1 | 15 |
| 8×1 | 7.5 |
Table 4.7-1: Gann’s Nine Angles (i.e. Gann’s Fans)
In his practice, he recommended using 1×2, 1×3, 1×4, and 1×8 angles along with 2×1, 3×1, 4×1, and 8×1 angles. He occasionally recommended using 1×16 and 16×1 line too. 1×2 angle refers to the two price unit movements per 1 time unit movement. Likewise, 1×3 angle refers to the three price unit movements per 1 time unit movement. The nine angles are pointing different direction for both bullish and bearish cases. In another words, if you draw the angles from trough, then the nine angles will point the northeast direction. If you draw the angles from peak, then the nine angles will point the southeast direction.
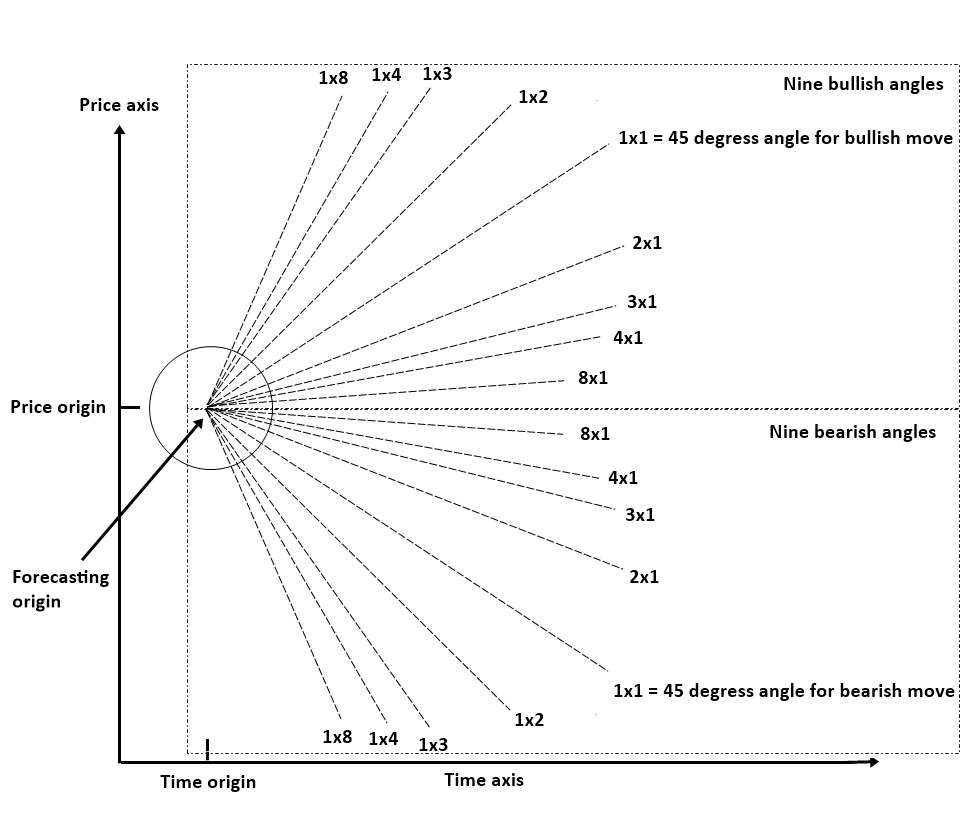
Figure 4.7-2: Conceptual drawing of nine bullish angles and nine bearish angles
The concept of Gann Angles is appreciated by many traders. However, there is a fundamental problem in implementing the idea. The question on scale remained unresolved for many decades since Gann invented the nine angles in 1935. The question is how do we equate 1 unit of price to 1 unit of time. The question is well phrased in the Wikipedia in the Layman’s terms (Visited on 2020 April 13, https://en.wikipedia.org/wiki/Gann_angles). For example, if we try to equate 1 point of Dow John’s industrial average to 1 bar in the chart, it does not have much meaning in our trading because Dow Jones industrial average is now trading at 23,000 points. Now some people suggest that it might be better to use the certain number of points like 100 or 1000 points instead of 1 point. For example, it is the suggestion you can read from Wikipedia (Visited on 2020 April 13, https://en.wikipedia.org/wiki/Gann_angles). This might work for one specific instrument. However, this is not the universal solution across all the instruments. For example, say that we applied 1000 points for Dow Jones industrial average successfully. Would this 1000 points work for S&P 500 index, the performance of 500 large companies listed on the US stock exchanges? Well, S&P 500 index is trading at 2,789 points for the time being. Using 1000 points to equate 1 bar, you can only draw 3 price unit in the price axis. You can tell that equating 1 price unit to 1 time unit is troublesome as well as equating a certain number of points to 1 time unit.
What is even worse? Many of us do not use the daily chart. We want to use 1 hour chart, 5 minutes chart, 4 hour chart, and so on. This is the typical provision from the modern charting platform. Using this approach, what worked in daily chart will not necessarily work in the rest of charts. When your chart timeframe is different, you are having different number of bars in your chart. For example, if you are having 1000 bars in your daily chart, you will have 8000 bars in the 1 hour chart in the case of US Stock market. Hence, the same points can not be used across different periods of the chart. This simple math reveals that this idea of angles can not be implemented in this way because we have to keep choosing different number of points per instrument and per timeframe. If you are trader, this is troublesome. In another words, we have a consistency issue here with this approach.
This is only technical side of story though. Fundamentally speaking, there is no theoretical guidance on how many number of price points we have to use for 1 time unit. Hence, even if you have chosen some number of points, it is hard to back up your choice with any theoretical point of view. In summary, implementing Gann Angles can introduce huge subjectivity in our trading. Subjectivity is bad. It makes us hard to reproduce any profitable strategy or profitable trading system.
All these implementation problems behind Gann Angles can be understood. For example, in 1935, it is rare for someone to have an electronic charting platform on his personal computer. The accuracy offered from the modern electronic charting platform now is all missing back then. For example, backtesting and other computer simulation help us to study hundreds of trading ideas over the night for many different instruments. In 1935, one can have a good idea for trading but it is possible that his idea can remain unstudied for many different instruments. We still respect that Gann’s ability to see the value of angles for trading without the help of any personal computers. It is no doubt that he is the great pioneer in the industry. Now we will show you how to overcome this inconsistency and subjectivity in using Gann’s Angles (aka Gann’s Fans).
We have spotted the several implementation issues of Gann Angles (i.e. Gann Fans). In spite of all these implementation problems, the idea of Angles is attractive for our trading. Gann’s Angle is one of few ideas trying to relate price and time directly in the world of trading. Hence, it provides the geometric regularity cross the two different dimensions including price and time. If we can make use of this cross-dimensional geometric regularity, we have no doubt that we can improve our trading marginally over just using the one-dimensional geometric regularity. This implementation has to be done with much smaller room or no room for subjectivity.
The turning point probability introduced in this book can provide an alternative approach over drawing the angles by equating 1 price point to 1 bar or the certain number of points to 1 bar. Fortunately, probability is the universal language. For price and time, probability works in the same way. In another words, it could act as the linking variable between two different dimensions. Using probability, we can make sense out of both price and time. For example, 90% probability for price is equal to the 90% probability in time. If you are hard to visualize the concept, then just consider the standard deviation of 90% probability. For example, equating 90% probability of price to 90% probability of time is equivalent to equating the standard deviation of 1.645 in price to the standard deviation of 1.645 in time. In another words, we can equate price and time in fair manner using probability.
There is no perfect thing in this world. We still have some issues using the probability too. For example, in practice, we use empirical probability based on available price data. Hence, there could be some discrepancy in our probability measurement between theoretical and empirical one. However, this is minor problem in comparing to the huge roller coast experience using the angle of 1 point per bar or 1000 points per bar. When you use probability, you do not have to worry about picking up new value for the angle every time. You can just use one setting for every different instruments and for different timeframes. They will divide price and time with sensible spacing automatically for your trading. Hence, Gann Angles with probability is an automated version of the original Gann Angles. In addition, it provides much less subjectivity over the original version. In Figure 4.7-3 and Figure 4.7-4, we provide bullish and bearish examples of Gann Angles with probability.
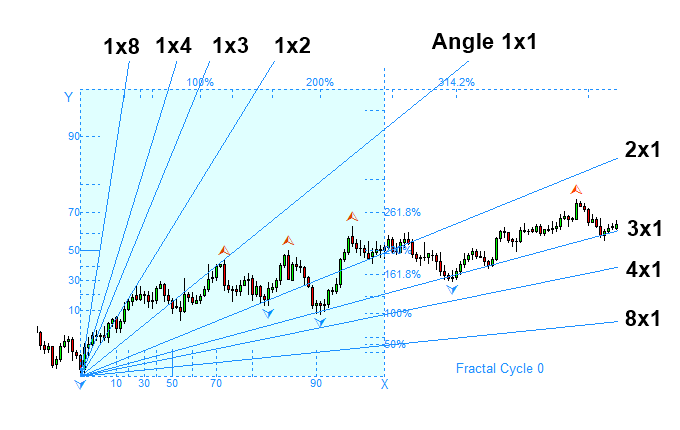
Figure 4.7-3: Gann Angles with probability for bullish projection in GBPUSD D1 timeframe
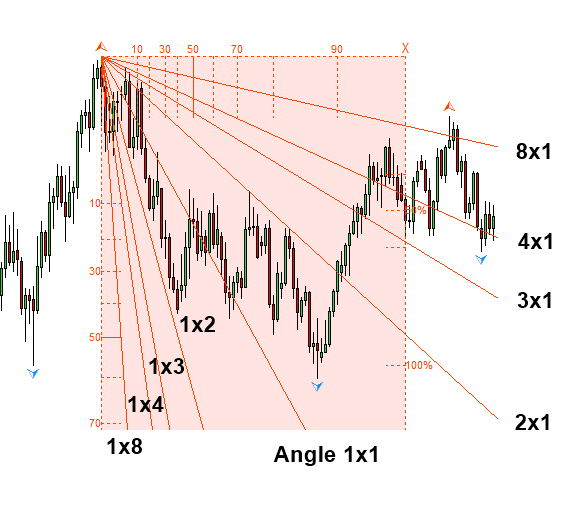
Figure 4.7-4: Gann Angles with probability for bearish projection in GBPUSD D1 timeframe
We have covered enough about the idea behind the Gann Angles with probability. Now we will cover the application side of Gann Angles with probability. Gann Angles with probability does not change anything on the application side of the original version. It only automates the process to equate price and time. Hence, what was taught by Gann is applicable to Gann Angles with probability too. In fact, the Gann’s angle is the ratio of price to time. The ratio is in a way similar to the concept of speed in physics.
Speed = Distance travelled / Time elapsed.
Hence, the most important application of Gann angles is measuring the speed of market. For example, in Figure 4.7-5, the price departed with high speed from trough. Then we can see that market is going through some speed reduction reaching from 1×3 line to 2×1 line. When we know the speed of the market, it helps us to read the market intention better.
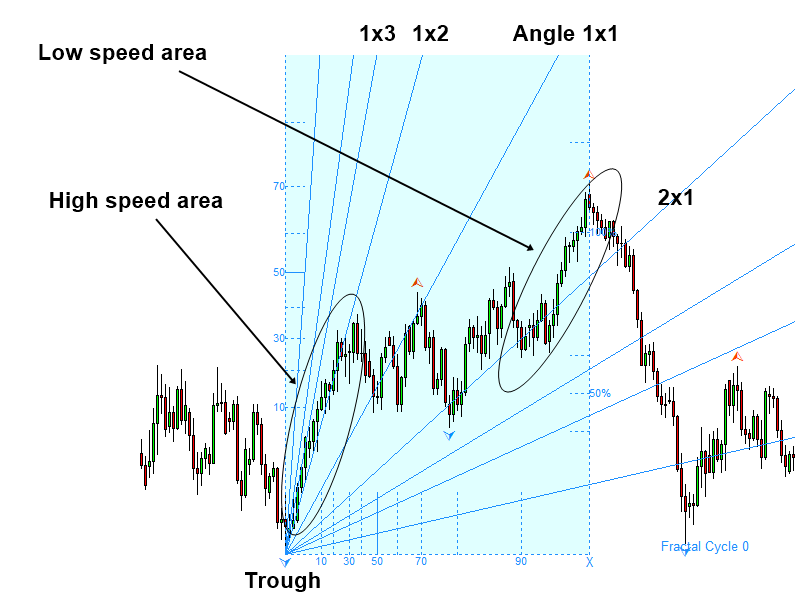
Figure 4.7-5: Gann Angles with probability for bullish projection in GBPUSD D1 timeframe
Likewise, in Figure 4.7-6, the price departed with high speed. Then we can see that market is going through some speed reduction reaching from 1×3 line to 1×1 line. Such a speed reduction helps us to predict a turning point with good reward to risk ratio often.
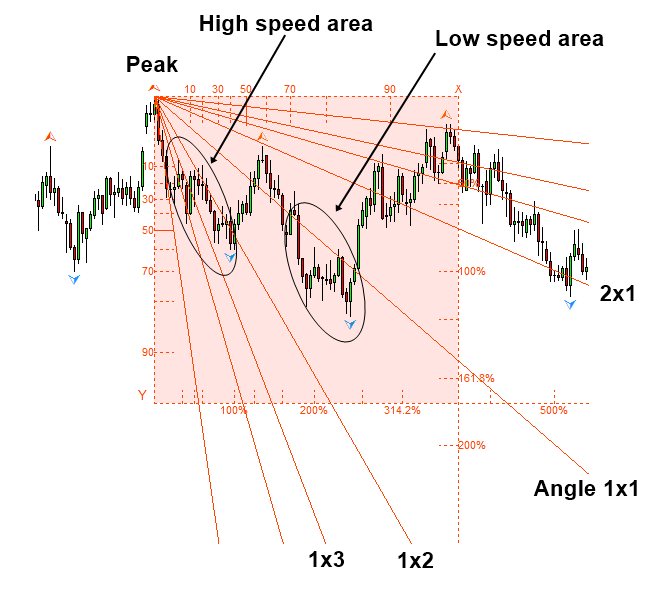
Figure 4.7-6: Gann Angles with probability for bearish projection in GBPUSD D1 timeframe
The second application of Gann Angles is the functionality as the support and resistance. Gann Angles can be used as the diagonal support and resistance for our trading. One thing you have to note is that Gann Angles are not geometric support and resistance lines, which are drawn by connecting peaks and troughs of fractal waves. However, it still does its job. For example, in Figure 4.7-7, the 2×1 line acts as the support line on the bullish turning point. Before the bullish turning point happens, you can see that the price is hitting the 2×1 line three times.
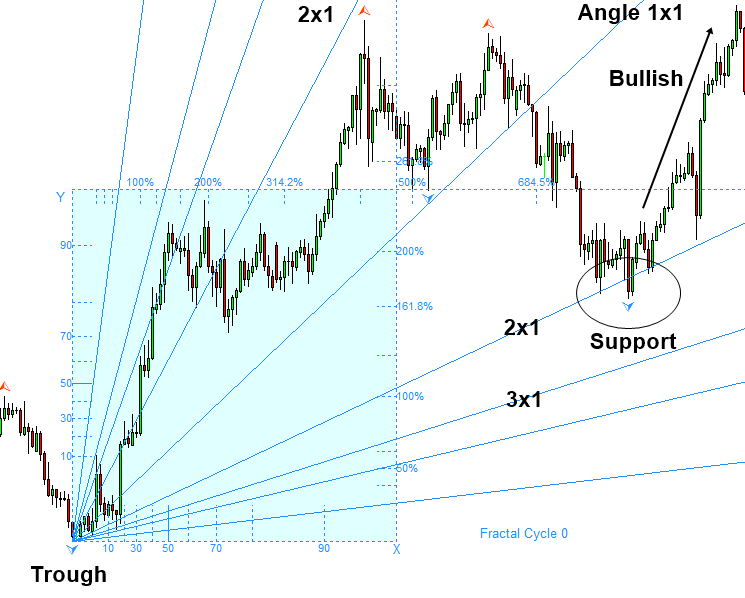
Figure 4.7-7: Gann Angles with probability for bullish projection in EURUSD H4 timeframe
Likewise, in Figure 4.7-8, we provide the example of resistance. In Figure 4.7-8, we can see that price is hitting the 8×1 line nearly five times. It is hard to take this as random event. Price is treating the 8×1 lines as the important resistance. Next, price breaks the 4×1 line below to continue its bearish movement.
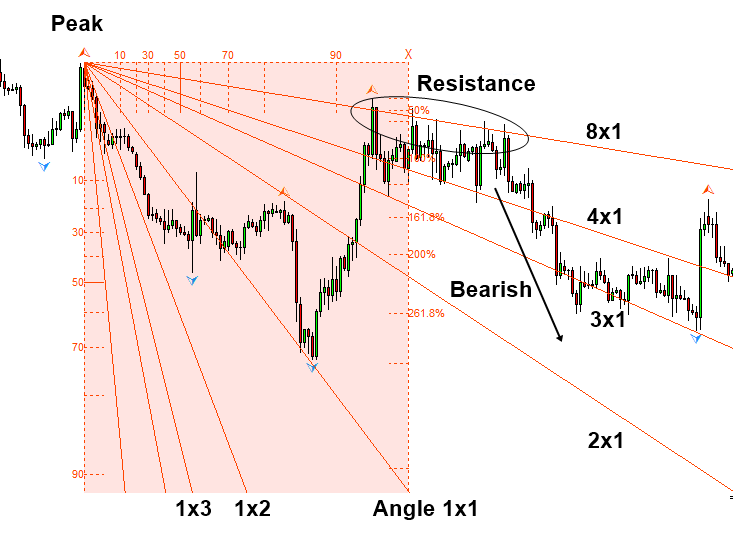
Figure 4.7-8: Gann Angles with probability for bearish projection in EURUSD H4 timeframe
So far, we have covered the brief usage of Gann Angles with probability. Since Gann Angles with probability does not change the way the original Gann Angles works, you can always refer to the original strategy book written by W.D. Gann (Gann, 1996) and new strategy book written by other authors about Gann Angles. Although Gann Angles can be used as the support and resistance, it is important to note that they are diagonal lines. Before using diagonal support and resistance, we recommend you to have a complete understanding on the horizontal support and resistance first.
When you use Gann Angles, picking up the location of Gann angles is another important consideration. Location of Gann angles can affect the accuracy of your prediction. Typically, you will start with either peak or trough. When price is moving upwards, you will typically select a trough to project the nine angles. Often it is recommended to use the lowest trough to project the nine angles. This does not mean the adjacent trough cannot be used at all. All we are saying is that it could be rather less optimal. The reason for this is that the distant trough provides better spacing between the angles lines. It is important that you keep the sufficient distance between the point of interest and the origin of Gann angles. Analogically speaking, it is like that moving average with 13 bars is more prone to noisy movement than moving average with 100 bars.
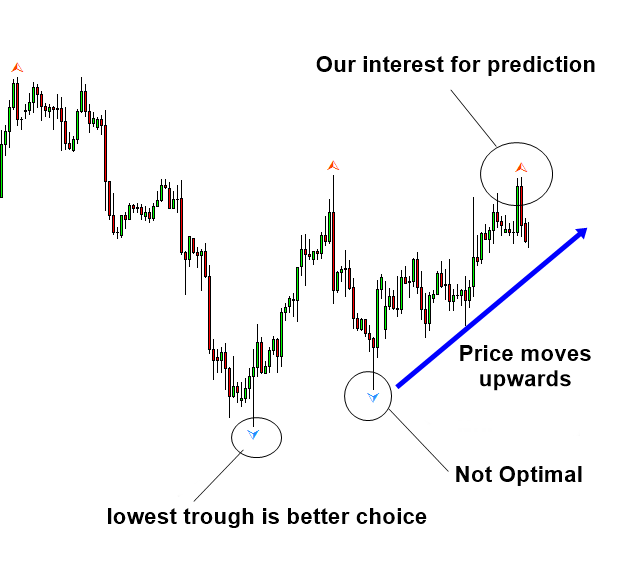
Figure 4.7-9: Gann Angles with probability for bullish projection in EURUSD H4 timeframe
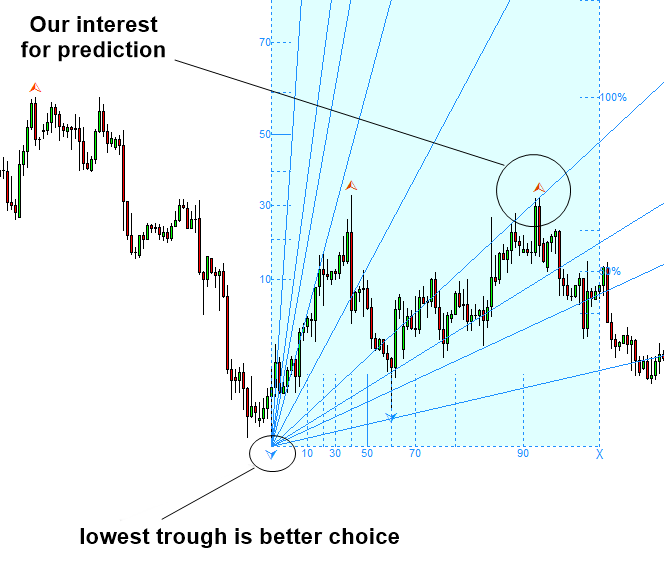
Figure 4.7-10: Gann Angles with probability for bullish projection in EURUSD H4 timeframe
Likewise, when price is moving downwards, you will typically select a peak to project the nine angles. It is important that you keep the sufficient distance between the point of interest and the origin of Gann angles. Often it is recommended to use the highest peak to project the nine angles.
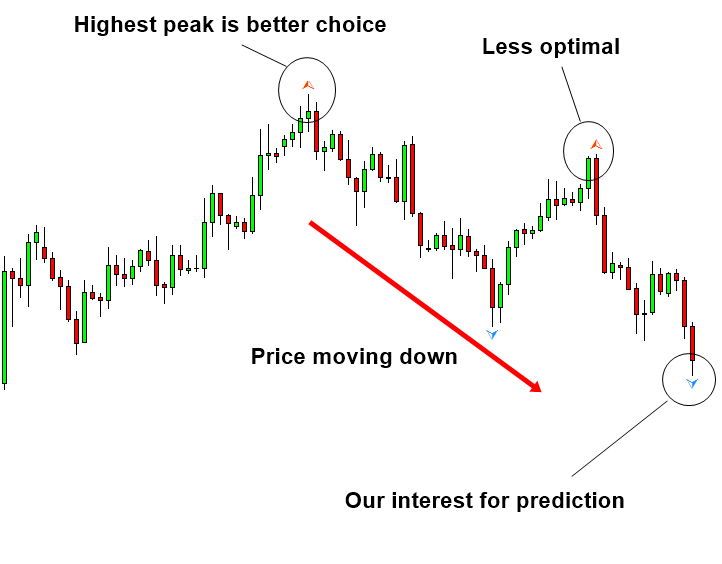
Figure 4.7-11: Gann Angles with probability for bearish projection in EURUSD H4 timeframe
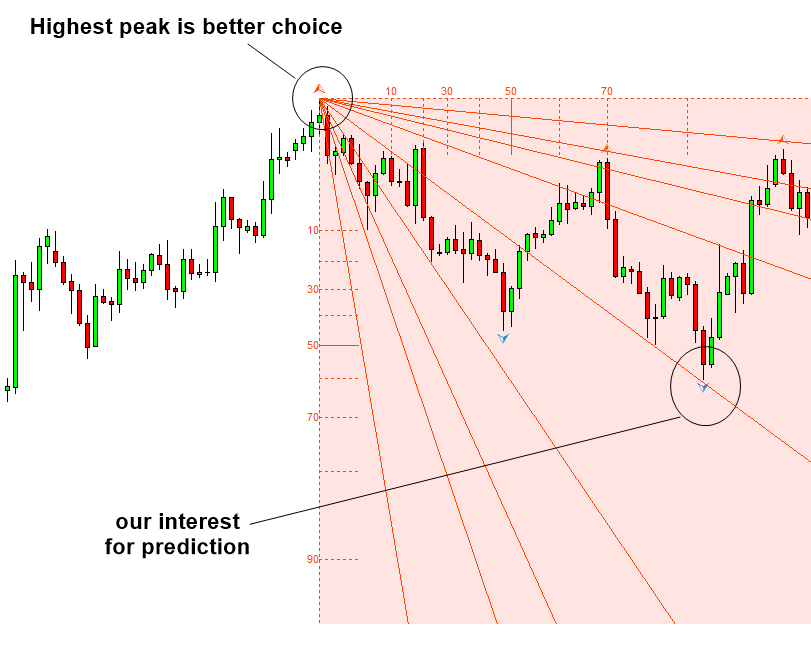
Figure 4.7-12: Gann Angles with probability for bearish projection in EURUSD H4 timeframe
So far, we have covered the basics of Gann Angles. Next, we will introduce the advanced application of Gann Angles. The nine angle lines are useful in measuring the speed of the rising price. However, it is limited to the opposite case. By adding the mirrored lines of the nine Gann Angles through the time axis, we can create the reinforced version of Gann Angles. I personally call this 18 Gann angles as the Lotus formation as it resembles the appearance of the lotus flower (Figure 4.7-13).
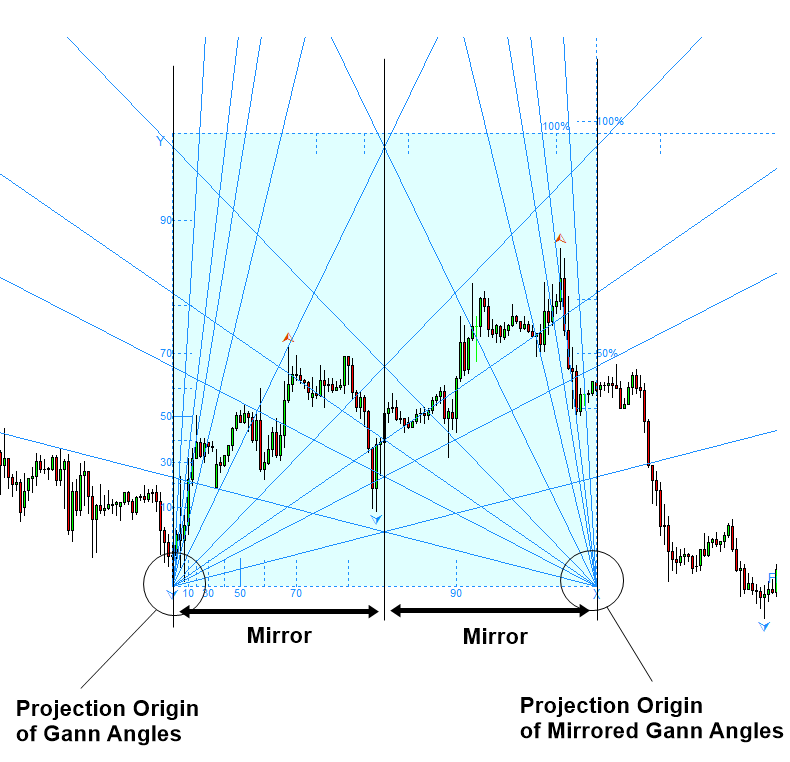
Figure 4.7-13: Lotus formation of 18 Gann Angles in EURUSD H1 timeframe

Figure 4.7-14: Pink Lotus flower
The usage of 18 Gann angles lines are the same. It is useful in measuring the speed of price. With 18 Gann Angles, we can measure the speed of falling price too. For example, when price rises, we use the Gann angles projected from the left bottom corner. When price falls, we use the Gann angles projected from the right bottom corner. This helps us to find out the intention of the market better. In Figure 4.7-15, we show the case in which the speed of falling price is slower than the speed of rising price. It is easier to guess that market sentiment is rather bullish by comparing of the two speeds.
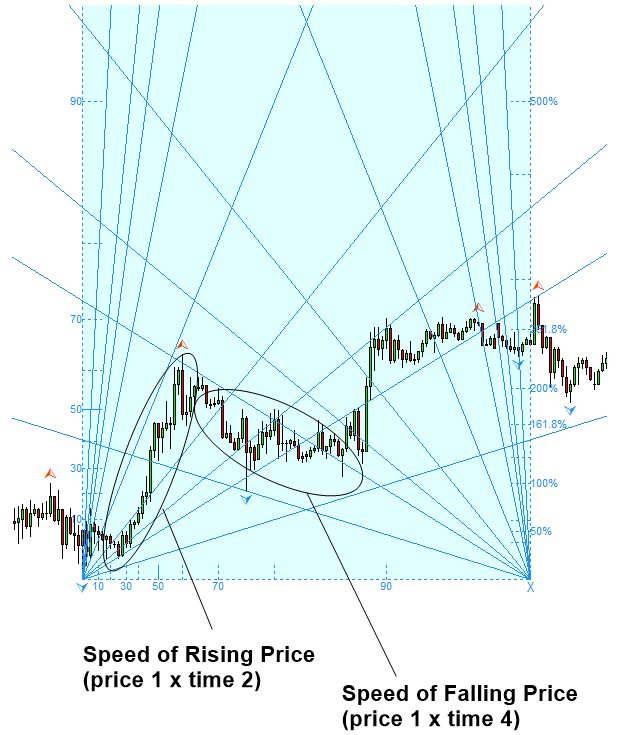
Figure 4.7-15: Lotus formation of 18 Gann Angles in EURUSD H1 timeframe
Another important usage of this 18 Gann angles is the provision of the reinforced support and resistance. When the mirrored Gann Angles cross the original Gann Angles, the crossed angle lines help us to define an important support and resistance. In Figure 4.7-16, we provide the example of reinforced support made from Gann Angle Cross + 61.8% Fibonacci Retracement. In this case, the support provided the robust turning point for the further impulsive bullish movement.
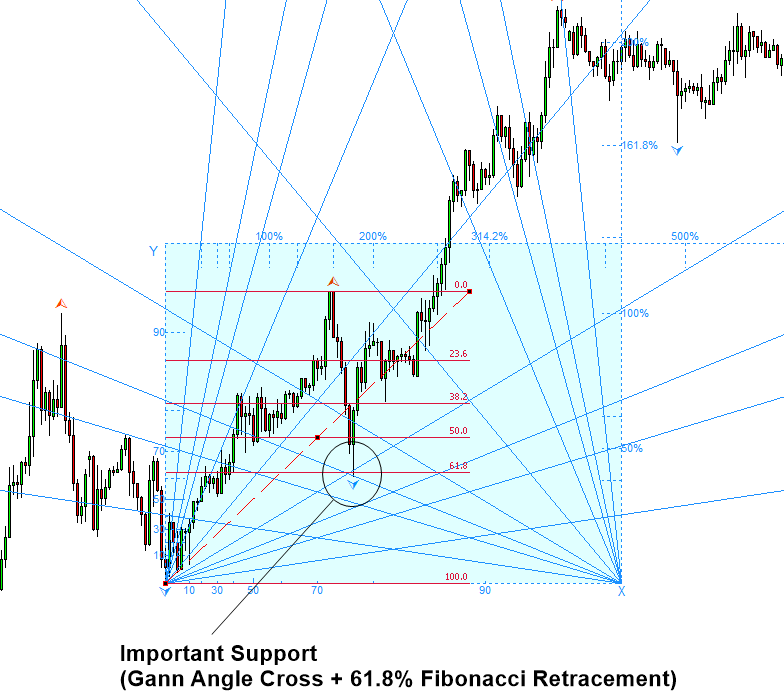
Figure 4.7-16: Lotus formation of 18 Gann Angles in GBPUSD H1 timeframe
It is possible to project the mirrored Gann angles through price axis. In this case, we get the rotated Lotus formation. The basic application of the rotated Lotus formation is similar to the original Lotus formation. It helps to measure the speed of price. It also provides the support and resistance in our trading. However, when we measure the speed of falling price, the lotus formation is more accurate because it provides the exact mirrored angle line through the time axis. Hence, it is easier to interpret the market intention.
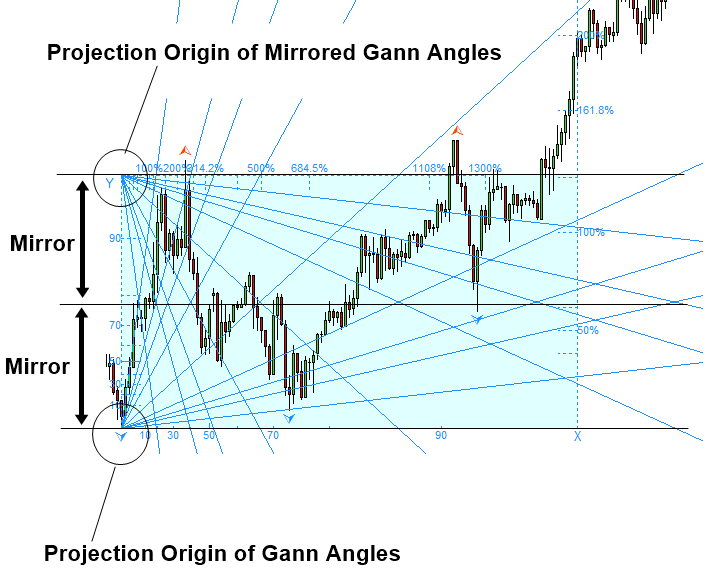
Figure 4.7-17: Rotated Lotus formation of 18 Gann Angles in GBPUSD H1 timeframe
Bringing the multiple projection of Gann angles further, we can combine several set of Gann angles projected from different peaks and troughs. When you combine several set of Gann angles, the most recommended approach is to pick one peak and one trough. Comparing to the Lotus formation, this approach might take more time to search for good peak and trough to project Gann angles. However, this approach provides good flexibility covering the blind side of one set of Gann angles. The chosen peak and trough might be used together with the Fibonacci Retracement analysis. It should be noted that the conjoint analysis is always better than a single analysis from one tool. Especially, the Fibonacci analysis including Fibonacci Retracement and Fibonacci Expansion is the good match for the Gann angles.
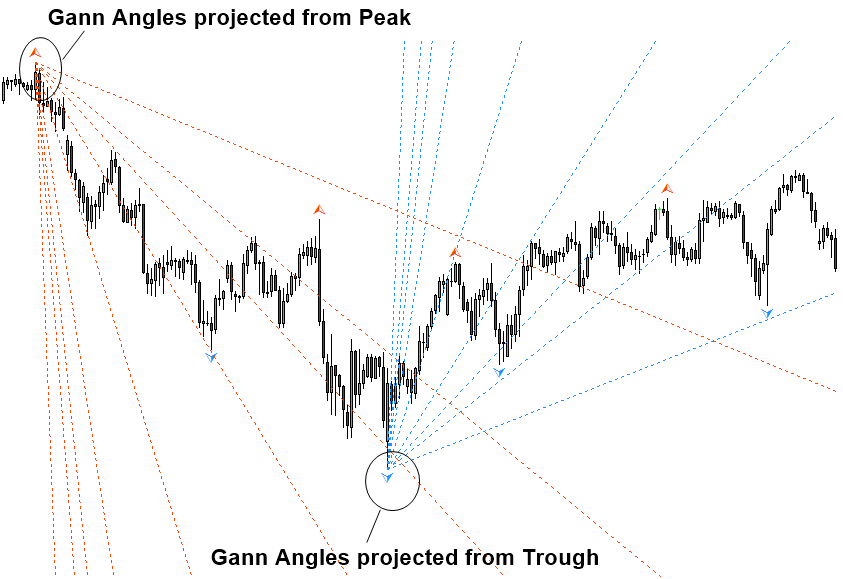
Figure 4.7-18: Combining two set of Gann Angles in USDJPY D1 timeframe
About this Article
This article is the part taken from the draft version of the Book: Predicting Forex and Stock Market with Fractal Pattern. This article is only draft and it will be not updated to the completed version on the release of the book. However, this article will serve you to gather the important knowledge in financial trading. This article is also recommended to read before using Fractal Pattern Scanner, which is available for MetaTrader or Optimum Chart.
Below is the landing page for Fractal Pattern Scanner for MetaTrader 4 and MetaTrader 5. The same products are available on www.mql5.com too.
https://www.mql5.com/en/market/product/49170
https://www.mql5.com/en/market/product/49169
https://algotrading-investment.com/portfolio-item/fractal-pattern-scanner/
Below is the landing page for Optimum Chart
https://algotrading-investment.com/2019/07/23/optimum-chart/
Related Products


