Fractal To Advanced Technical Analysis
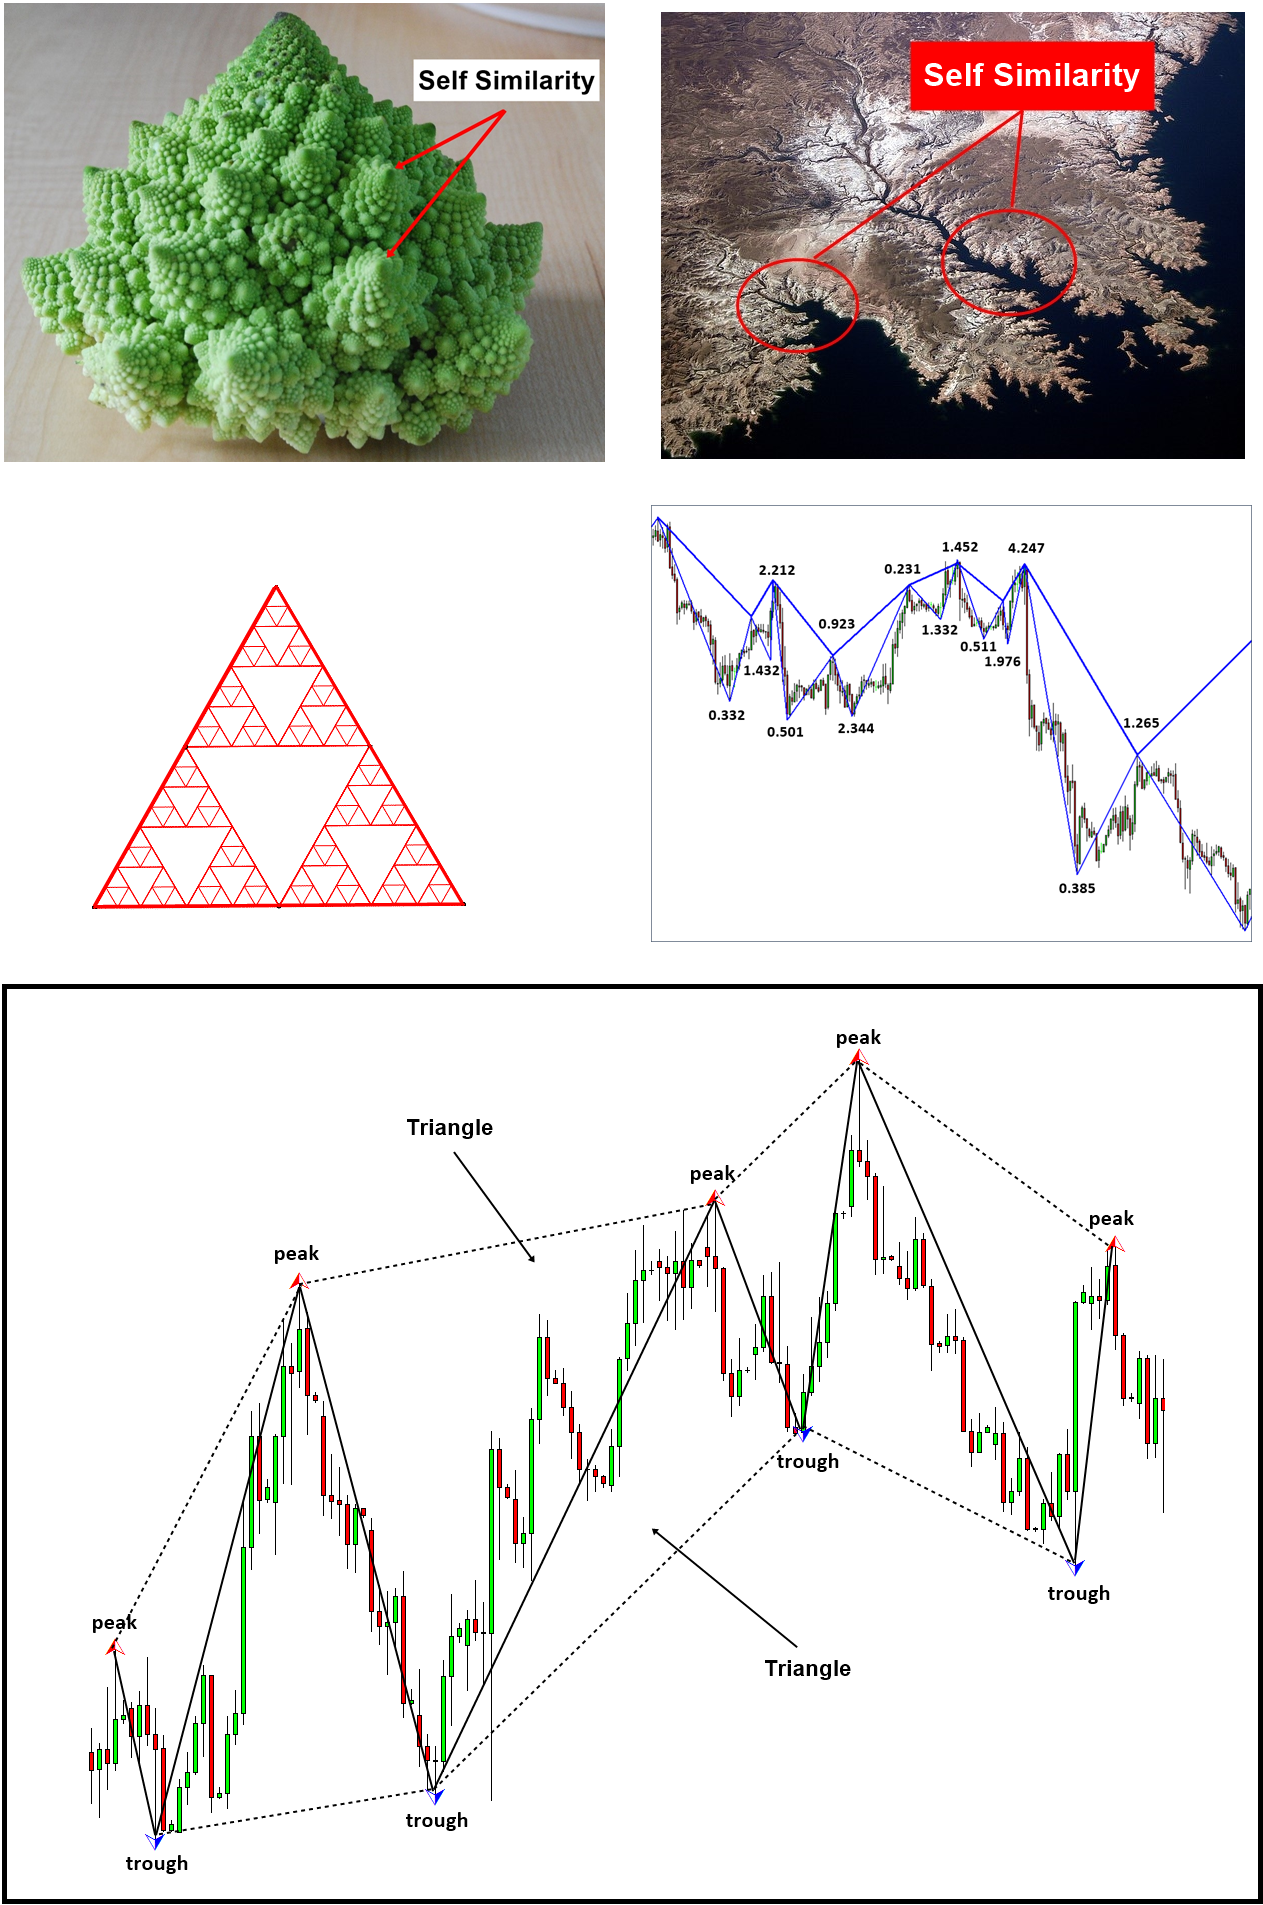
We will explain the Fractal in Forex and Stock Market to provide you the direction and guidance for the advanced technical analysis. Let us begin with some simple definition of Fractal first of all. When the same or similar geometric shape is repeating infinitely in different scales, we call it “Fractal”. The self-similarity is the typical property of fractal. Fractal can be observed everywhere in the universe. In the space, tree, human anatomy, mountain, and, coast, we can observe fractal. For example, in the Romanesco Broccoli, the smaller piece, if they are broken off from the bigger piece, do look like the big piece. Like this, in Fractal, the same or similar patterns are occupying the entire structure of an object.
Another example of fractal in nature is a coastline. The coastline shows the similar details on different scales. The waves provide a steady force to shape the coastline over time. When the coastline is straighter, the waves will keep pounding until they become more fractal. This mechanism cut the straighter line of coastline more wobbly in the zigzag pattern. Then, the straighter line inside the zigzag line will be cut into the smaller zigzag pattern. As a result, the coastline will look similar whether you zoom in or zoom out in the map.
If you still found it difficult to understand fractal, then let us introduce more straightforward example. For example, Sierpinski triangle is good example of self-similarity and fractal. Sierpinski triangle is made up from identical shape, the triangle. In Sierpinski triangle, the triangle is continuously expanding to build the bigger triangle. As we magnify any part of Sierpinski triangle, we see the identical triangles. Hence, Sierpinski triangle is one of the good example to explain fractal.
Beside Sierpinski triangle, snowflake, heartbeat rate, structure of brain and, internal organs are another examples of fractal too. Fractals can be classified into few different types depending on the degree of the self-similarity. For example, when the repeating geometry is strictly identical like snowflake and Sierpinski triangle, we call them as the strict self-similarity. When the repeating geometry is similar but not identical like coastline and heartbeat rate, we call them as the loose self-similarity. This loose self-similarity is often referred to as the statistical self-similarity because we can observe the repetition in the degree of complexity within statistical range not the exact pattern.
Price data in the financial market represent fractal with the loose self-similarity. In “The Misbehavior of Markets: A Fractal View of Financial Turbulence”, Benoit Mandelbrot and Richard L. Hudson applied the fractal theory to understand the financial market. They explained that the financial market can impose a greater risk than it can be explained by the modern mathematical assumption. In addition, they believed that the financial market possess a memory. As a result, the similar events in the financial market can repeat in certain rhythm.
With the assumption that price continuously rises and falls, then the price can behave like fractal. Either we connect a peak, trough, and peak or we connect a trough, peak, and trough, it would form a triangle. Like other fractal object, the small triangles will form the bigger triangle. Eventually, the entire historical price would be described as one or two big triangles. The price data in the financial market possess the property of the loose self-similarity than the strict self-similarity. More precisely, since the price is recorded over time, we can call it as “Fractal Wave”.
Finally, to accomplish your complete understanding of Fractal to Advanced Technical Analysis, you can watch the YouTube Video titled “Fractal To Advanced Technical Analysis in Less than 6 minutes”.
YouTube link: https://youtu.be/RiTsWthvxfA
Blog Link: https://algotrading-investment.com/2021/09/28/fractal-to-advanced-technical-analysis/
Here is the landing page for the Free Peak Trough Analysis Indicator for MetaTrader 4 and MetaTrader 5.
https://www.mql5.com/en/market/product/23797
https://www.mql5.com/en/market/product/22420
https://algotrading-investment.com/portfolio-item/peak-trough-analysis-tool/
Or You can watch the YouTube Video titled “Fractal in Forex and Stock Market” directly from this blog below.
Related Products


