Elliott Wave Analysis
Elliott wave analysis is a popular technical analysis that looks for repeating patterns in the price movements in Forex and Stock market. Elliott Wave theory was developed by Ralph Nelson Elliott, a brilliant accountant from USA. Elliott wave analysis is based on the idea that markets are driven by the collective psychology of investors (i.e. crowd psychology), which manifests in waves of optimism and pessimism. According to the Elliott Wave Theory, there are two types of waves: impulse waves and corrective waves. Impulse waves move in the direction of the main trend and consist of five sub-waves, while corrective waves move against the main trend and consist of three sub-waves. These waves can be observed at different scales, from minutes to centuries, and form a fractal structure. Elliott wave analysis can help investors identify the current stage of the market cycle, anticipate future price movements, and plan their trading strategies accordingly.
Elliott Wave theory can be beneficial to predict the market movement if they are used correctly. Junior traders are often fear to use Elliott Wave because their complexity. From my experience, Elliott wave is not a rocket science, anyone can probably learn how to use the technique with some commitment. However, not all the book and educational materials will teach them in the scientific way. If we are just looking at the three rules from the original Wave principle only, there are definitely some rooms where subjective judgement can play in our wave counting. This makes the starters to give up the Elliott Wave Theory quickly. Fortunately, there are some additional tools to overcome the subjectivity in our wave counting. First tool but the most important tool is definitely the three wave rules from the original Wave Principle. They can be used as the most important guideline for the wave counting. Below we describe the three rules:
• Rule 1: Wave 2 can never retrace more than 100 percent of wave 1.
• Rule 2: Wave 4 may never end in the price territory of wave 1.
• Rule 3: Out of the three impulse waves (i.e. wave 1, 3 and 5), wave 3 can never the shortest.
Second tool is the Fibonacci ratio. As in the Harmonic pattern detection, Fibonacci ratio can play an important role in our wave counting because they describe the wavelength of each wave in regards to their neighbouring wave. For example, the following relationship is often found among the five wave of the impulse wave. Depending on which wave is extended among wave one, three and five, the Fibonacci ratios are different. Most of time, the extension of wave 3 is most frequently observed in the real world trading.
Optimum Chart also provides the tools to analyze Elliot waves or to automatically identify specific Elliot Wave patterns. First, we will explain how to use the tools to analyze Elliott Waves in the Optimum Chart. Anyone who uses Elliot waves knows that there are several waves in the Elliot Wave Theory.
- Impulse wave
- Diagonal triangle wave (or diagonal wave)
- Corrective wave
Optimum Chart provides tools to analyze all of the above Elliott Waves including impulse wave, diagonal waves and corrective waves. There are a total of 7 Elliott Wave Analysis tools. You can use the following 7 analysis tools by clicking the Elliott Wave menu in the chart menu.
- Impulse wave 123
- Impulse wave 12345
- diagonal wave 12345
- Corrective ABC Wave
- Corrective ABCDE Wave
- Corrective WXY Wave
- Corrective WXYXZ Wave
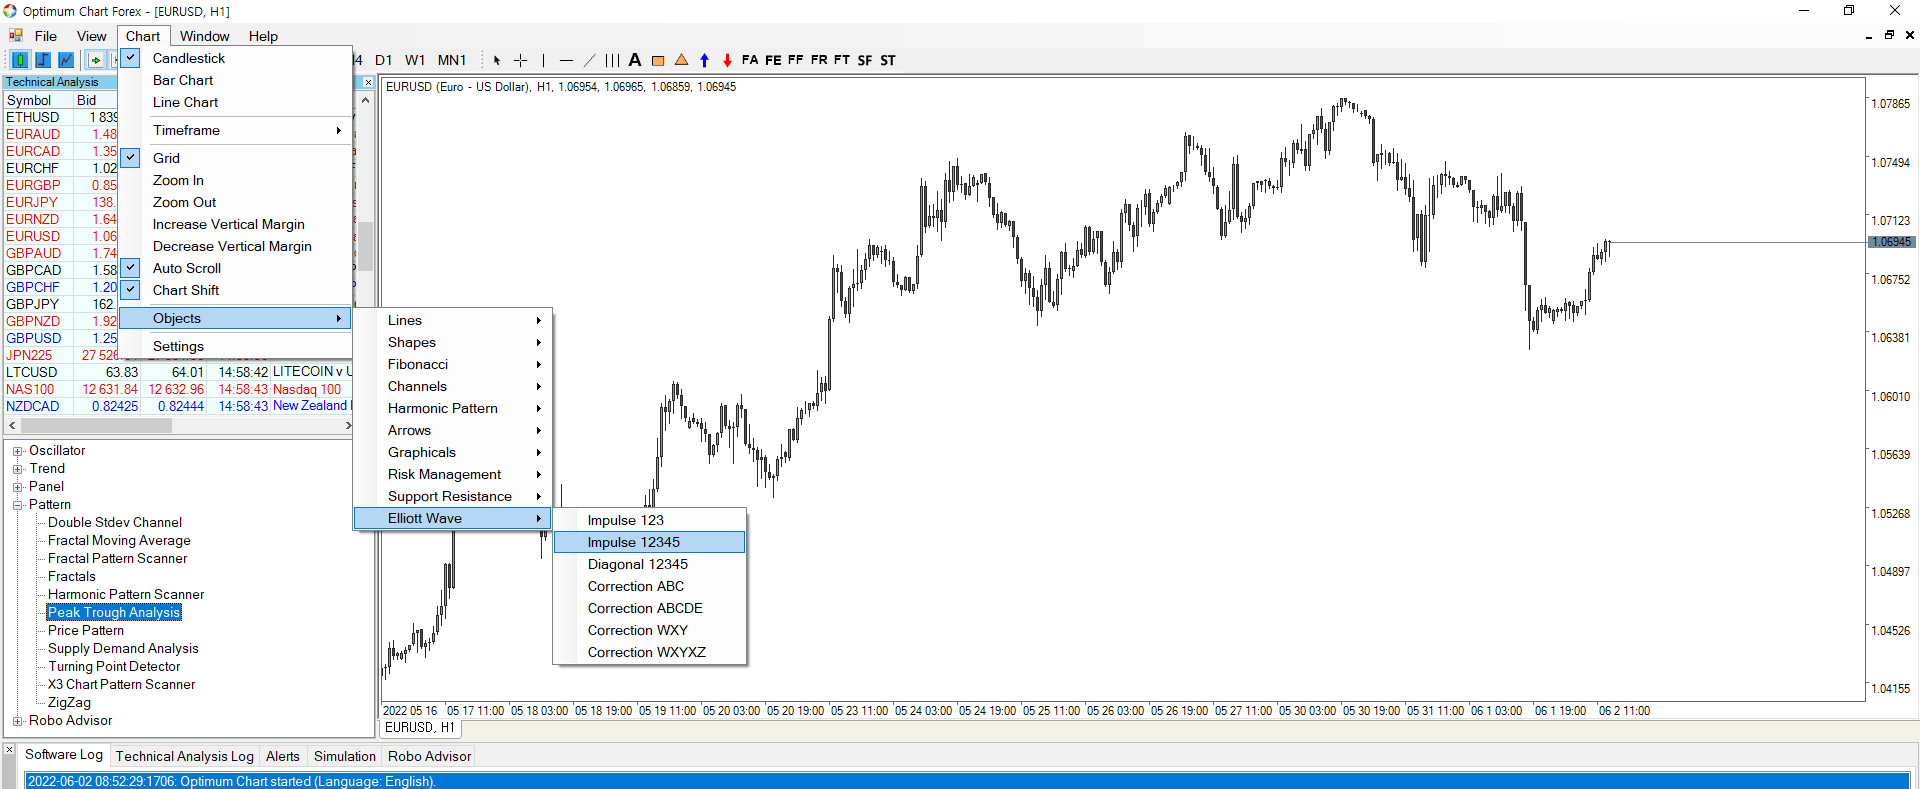
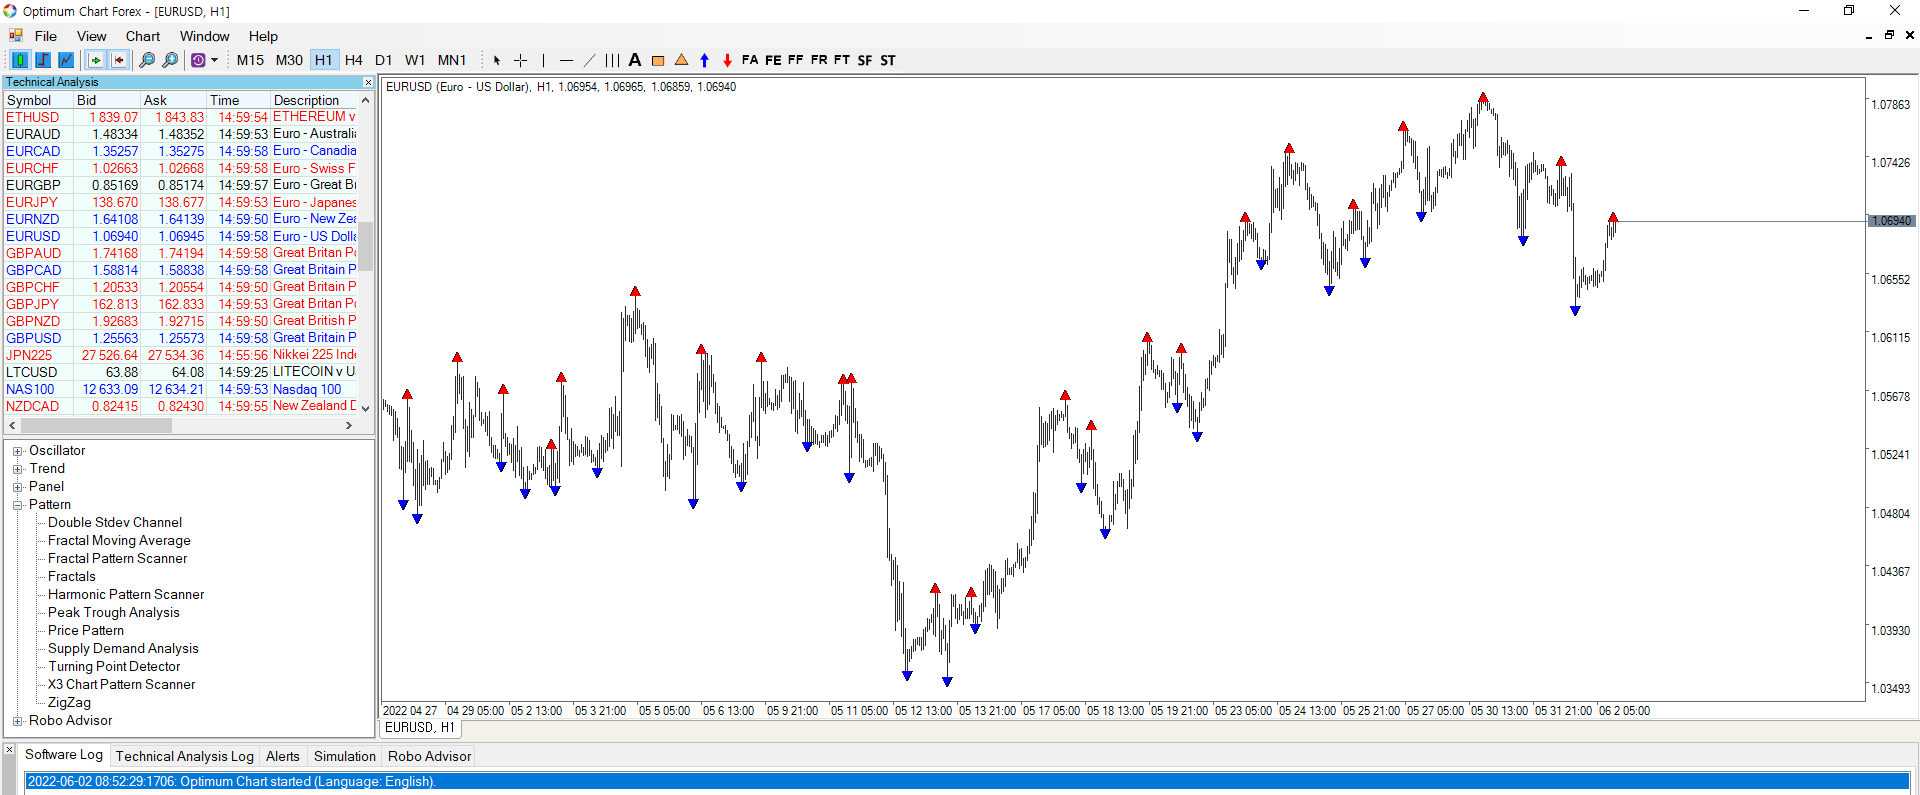
Then we will explain how to use the Elliott Wave tools. Firstly, you need to apply the Peak Trough Analysis under the “Pattern” in the Indicator List in the left side of the Optimum chart. When the Peak Trough analysis is applied to the chart, it automatically identifies highs and lows, also known as fractal waves. The Peak Trough Analysis serves as a kind of template to help the Elliott Wave analysis. Then click the Elliott Wave menu in the chart menu to use the Elliott Wave analysis tool you want. Here we will apply the Impulse wave 12345 menu.
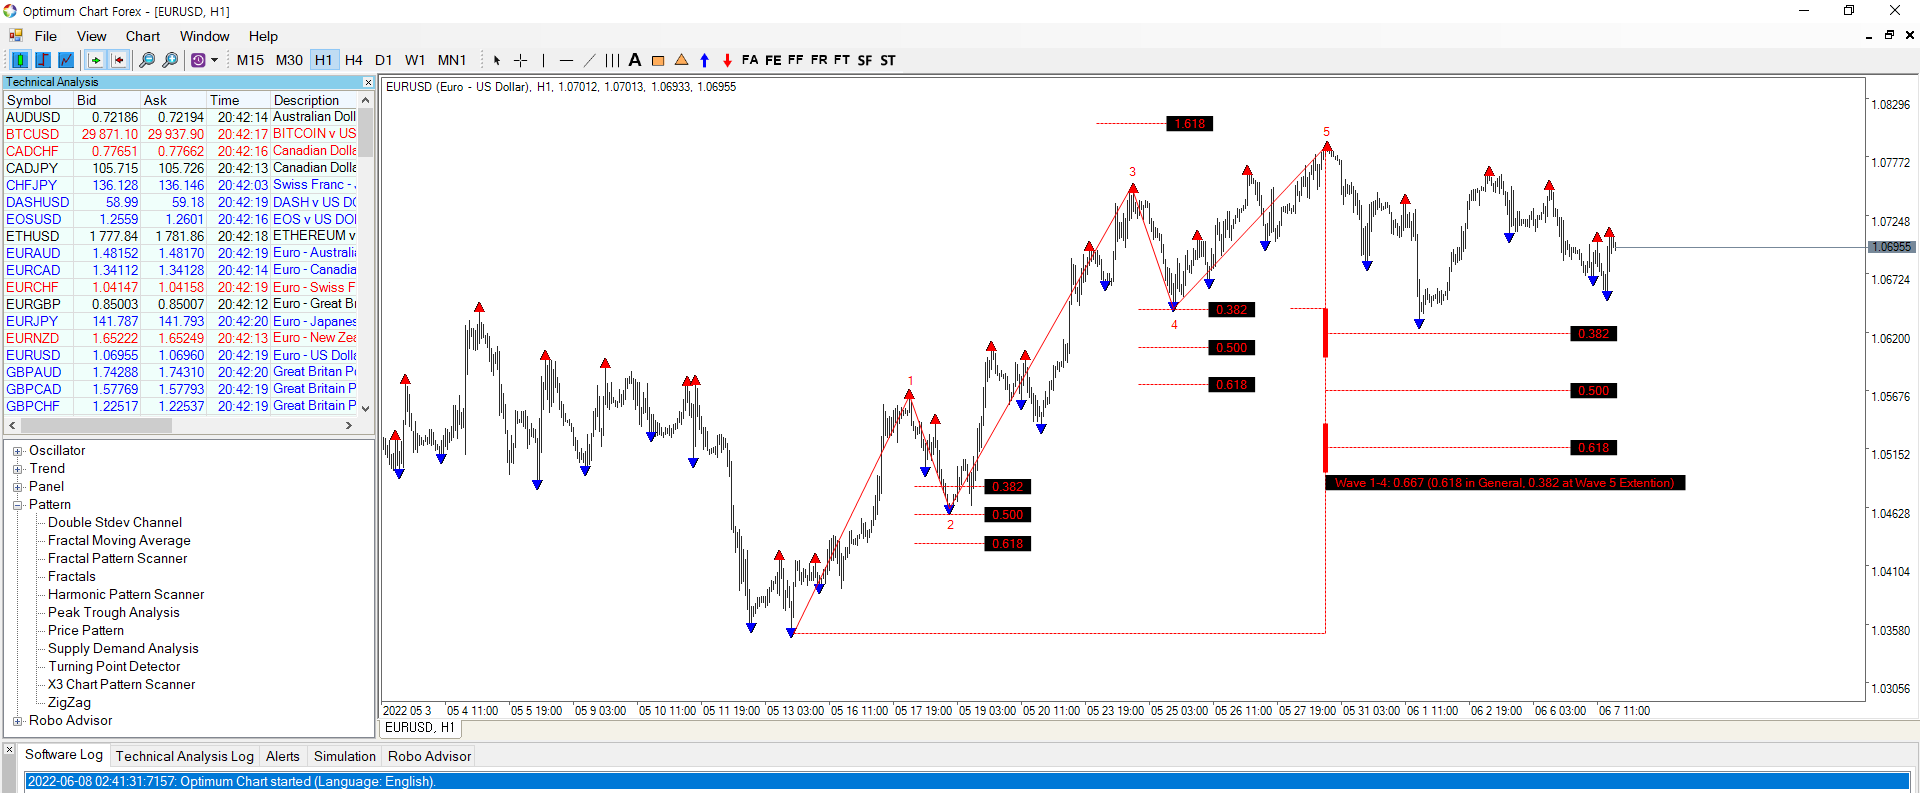
Since impulse wave 12345 consists of a total of 6 points from the start of the wave, you need to click 6 times to connect peak and trough points on the chart in turn. When doing this, first draw the approximate shape of the impulse wave, and then use the Fibonacci ratio provided by the impulse wave tool to check that each wave is in the correct position, and finally you can confirm to confirm the impulse wave. For example, as you can see in the chart below, you can see that wave 2 is near the 50% retracement and wave 4 is near the 38.2% retracement. One downside is that wave 3’s position is below 161.8%. However, wave 3 is longer than wave 1 and wave 5, wave 4 does not overlap with wave 1. It cannot be said that the impulse wave violates the three waves. Although it does not perfectly satisfy all conditions, but if we assume that the impulse wave 12345 is correct, we can predict that a correction wave will be created in the future.
In this short article, we learned how to analyze impulse wave 12345 among Elliot wave tools in Optimum Chart. How to use Impulse wave 12345 in practice is summarized in the following three steps.
- Apply the Peak Trough Analysis tool in “Pattern” in the indicator list in Optimum Chart
- Draw impulse wave 12345 roughly using the Elliott wave analysis tool by clicking 6 points on the chart
- Examine the details whether the impulse wave 12345 conditions are met
Of course, when using diagonal wave, corrective wave ABC, or corrective wave ABCDE, you can execute the above 3 steps in order too. However, you should know that you must analyze the impulse wave first before analyzing the diagonal wave or corrective wave. In Elliott Wave Theory, the impulse wave 12345 serves as a kind of backbone. That’s why it’s a good idea to first identify the most probable impulse wave before using any kind of corrective or diagonal wave. Of course, it is also possible to automatically identify specific Elliot wave patterns in the Optimum chart. We will explain that part in another article.
Optimum Chart is a standalone charting and analysis package. You can find details about Optimum Chart from the link below:
https://algotrading-investment.com/2019/07/23/optimum-chart/
Optimum Chart is probably the most powerful technical analysis package in the internet. However, if you must use Metatrader, then we have also excellent Elliott Wave analysis tool in the MetaTrader 4 and MetaTrader 5. Please check out Elliott Wave Trend from the below links.
https://algotrading-investment.com/portfolio-item/elliott-wave-trend/
https://www.mql5.com/en/market/product/16472
https://www.mql5.com/en/market/product/16479
At the same time, you can watch YouTube video titled as “Elliott Wave Trend Intro to find out more about Elliott Wave Trend Indicator for MetaTrader.
YouTube Link: https://youtu.be/Oftml-JKyKM
Related Products


