Trading Sideways
A sideways market is a market in which price moves within a narrow range. Sideways trading is a trading strategy that enters trades when price starts to build momentum from Sideways market. In terms of trading point of view, Sideways market can serve as the very good entry timing for traders. Sideways market is also the representation of accumulation of large orders from big investors. Therefore, identifying Sideways market can help you to decide good entry and exit timing.
Traditionally, the Average Directional Index (ADX) indicator or moving average of standard deviation indicators was used to roughly determine the presence of Sideways Market. However, both of the indicators are lagging with very low correlation with future price movement. They will not provide you clear idea on when the Sideways Market started and when it ends. Missing all these important information leaves traders with a very uncertain picture on the current market situation.
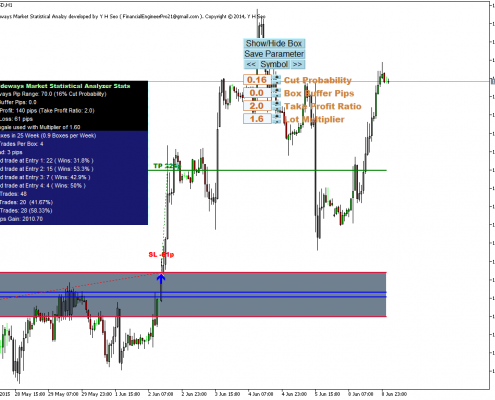
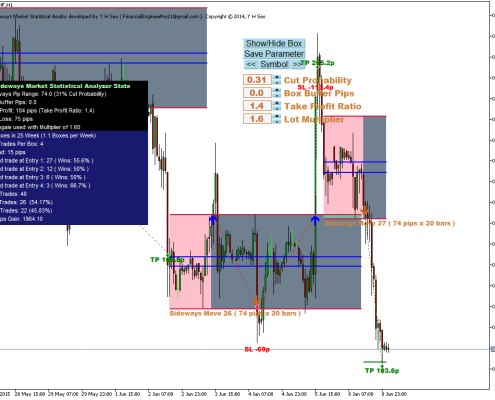
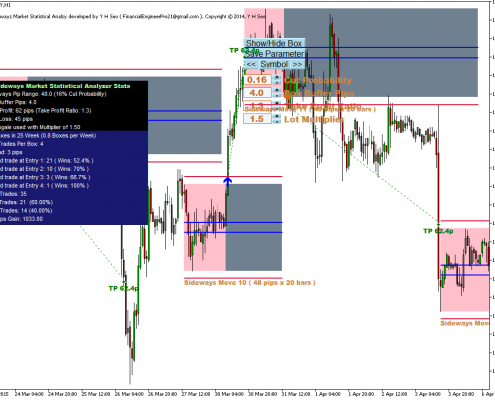
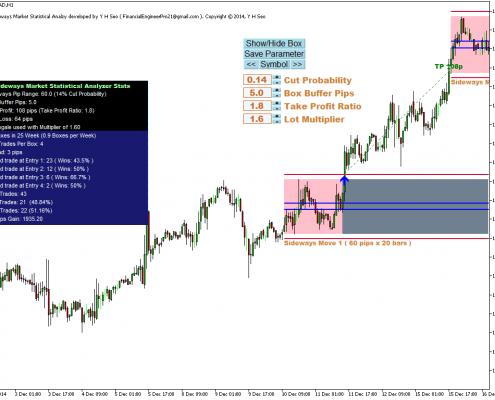
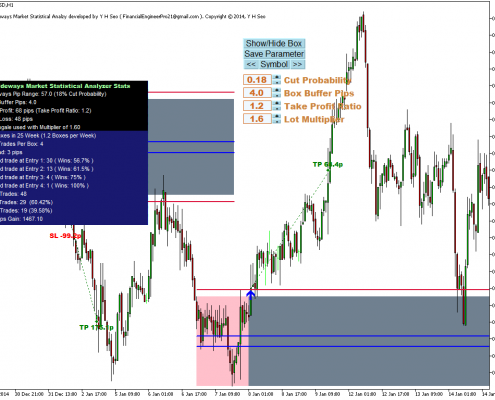
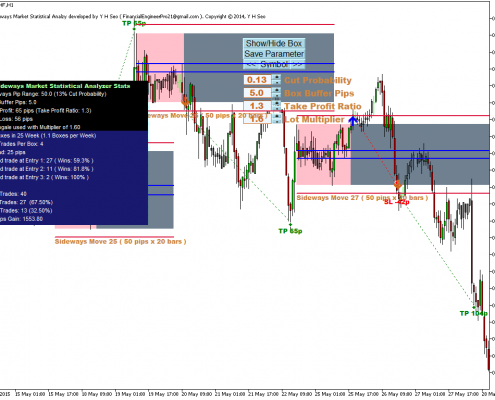
Here we have very accurate Sideways Market Analyzer inspired by the statistical theory. Indeed, this Sideways Market Statistical Analyzer can detect Sideways Market just like human eyes can do. In terms of trading signal, you open a buy order when the price hits the top of the Sideways and you open a sell order when the price hits the bottom of the detected Sideways Box. Sideway Market Analyzer provides you with a fixed stop loss and take profit levels. Sideways Market Statistical Analyzer works well for most of the currency pairs.
Trading Sideways Features
- Automatic sideways market detection
- Automatic backtesting feature
- Trading statistics per entry
- Email alerts can be setup
- Sound alerts can be setup
- Push Notification to your mobile Meta Trader terminal on your smart Phone can be setup
Indicator Setting
Unlike some of our software, Sideways Market Statistical Analyser do need to fine tuning parameter before trading. However, we made parameter tuning extremely simple and user friendly. Here are description for some of important parameters for Sideways Market Statistical Analzyer.
- Cut Probability – you can enter from 0.01 to 0.99. The value will mostly stay between 0.05 and 0.5. This cut probability is the criteria to qualify the Sideways Movement of the current group of candle bars based on the probability distribution.
- Box Buffer Pips – you can enter from 0 to 100. The value will mostly stay between 0 and 10. The pip value is the offset distance from the detected Sideways Market. This will be represented by the long horizontal line above and below the detected Sideways Market on your chart. This line can be used as the trigger point for your buy and sell orders.
- Take Profit Ratio – the Ratio of your take profit pips/box height. The value will mostly stay between 1 and 3. 1 indicates that your take profit’s pips are equal to the height of the box.
- Lot Multiplier – Lot Multiplier is used when your previous trading hits stop loss. The value will mostly stay between 1.5 and 2.0. It is recommended to use the value less than 1.7.
When you find good parameter setting, you can save them on your chart by clicking “Save Parameter” buttons.
Recommended Usage for Trading
You can apply Sideways Market Statistical Analyserto any time frame including M1, M5, M15, M30, H1, H4 and daily. However, from our experience, the preferred time frame is M15 and H1. You can apply Sideways Market Analyser to many currency pairs and you can look for many tradable opportunities each day.
In terms of trading, you can use purely mechanical trading setup based on backtesting statistics on your chart. You can trade selectively the best entry you want only among 4 entries. You don’t have to strictly stick with all the four entries shown on your backtesting statistics. So check which entry offer you better profits and decide your preferred trading setup. Slightly modified Entry decision by adding little support and resistance level around your Sideways Box can yield even more promising results according to our research.
Compatibility with Other Trading Strategy
Sideways market is a powerful trading system on its own. However, its power can be extended further by combining with Harmonic Pattern Plus (or Harmonic Pattern Scenario Planner) and Price Breakout Pattern Scanner. Also Smart renko tool can be a great supplementary tool for entry, stop loss and trail stop loss decision.
Important Note
This product is the off the shelf product in the store. Therefore, we do not take any personal modification or personal customization request. For our products, we do not provide any code library or any support for your coding.

