Quick Guide for Harmonic Pattern
This article provides a guide for Harmonic Pattern and Harmonic Pattern Indicator used in Forex and Stock market. Harmonic Pattern Plus detects the reversal (turning point) patterns in your chart automatically. The software will recommend you to the potential entry and exit for your trading at turning point. With some discretionary thinking together, using Harmonic Pattern Plus is the profitable and convenient way for your trading. With a lot of automation, you have very little work to do for your trading. Harmonic Pattern Plus was evolved for many years to meet the needs for the professional traders. As a result, Harmonic Pattern Plus contains many different features and functionalities in one software. Because of this comprehensive feature, starters can get little frustrated at the beginning. However, it is important to remember that everyone evolve to different stage and different mind-set in his or her trading career. It is better not assume anything too quick. As your skills improve with your trading, you will be glad that Harmonic Pattern Plus offers those features and functionalities for your trading. Obviously, there are clear reasons that those feature and functionality are there. You may not see the benefit now but you can see the benefits in the future. Just avoid making too quick assumption or judgement on the software just after few days of using them. It is important to remember that you do not have to use all of features and functionalities at the same time. You will likely to use some features and functionalities depending on your experience and preferences. Please switch off rest of feature and functionality and only leave the features best suit for your needs. In this article, we provide brief description of features in Harmonic Pattern Plus.
Important Note: This document is applicable to Harmonic Pattern Scenario Planner too. So you can read it if you are Harmonic Pattern Scenario Planner User.
1. Automatic Reversal Pattern Detection
It is the primary function of Harmonic Pattern Plus. Once the reversal (turning point) pattern is detected, you can anticipate the turning point in the market. It is not bulletproof strategy but many professional trader uses these patterns successfully in the financial market. Since each pattern show the direction of trading, it is not difficult to follow each pattern for your trading.

Harmonic Bat Pattern
Figure 1: Harmonic Bat Pattern Example in Forex
2. Custom Take Profit and Stop Loss based on Pattern Completion Interval
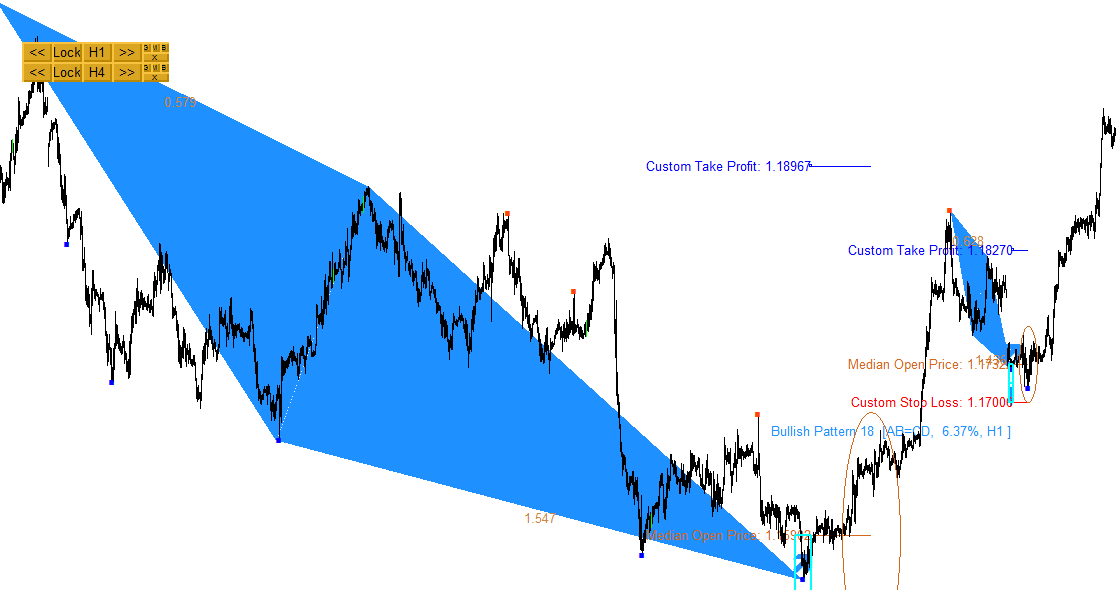
Harmonic Pattern Plus can provide you automatic take profit and stop loss at your desired rewards/risks. For your live trading, you can just tune your actual order according to the provided stop loss and take profits. In addition, the provided custom stop loss and take profit is interactive one. Therefore, you can drag them in your chart to adjust them in real time. I know it is amazing that you can interactively control your stop loss and take profit from your chart. This feature is useful in the fast trading environment because you can think less to produce the right take profit and stop loss targets.
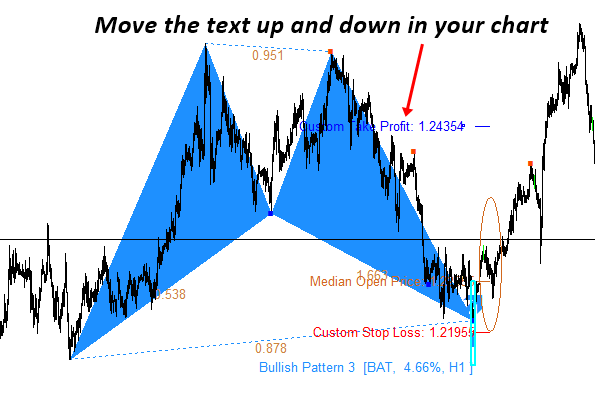
Take Profit and Stop Loss for Harmonic Pattern
Figure 2: Adjust Take Profit and Stop Loss for Harmonic Bat Pattern
To control the size of take profit or stop loss, simply go to the indicator setting. In the indicator setting, you can control the size of take profit and stop loss as well as many other features. If you want to change anything on take profit and stop loss, just visit the indicator setting first.
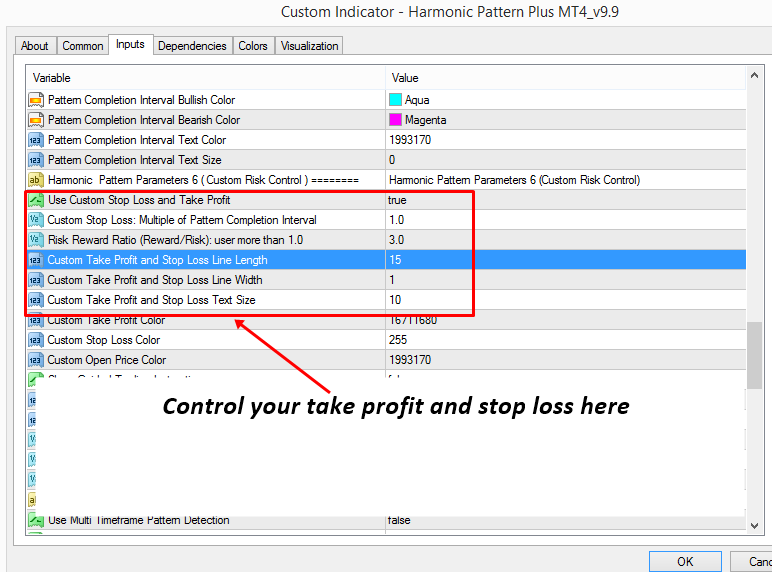
Input for Take Profit and Stop Loss for Harmonic Pattern
Figure 3: Input to control Take Profit and Stop Loss for Harmonic Pattern Indicator
3. Pattern Completion Interval Box
Pattern Completion Interval Box provides few very important information. Firstly, Pattern completion interval is the basis for our custom takes profit and stop loss levels. Stop loss size 1 equals to one box of pattern completion interval. Secondly, PCI box can help you to identify your worst entry point (median open price). When the pattern is detected, you should aim to enter before the price cross over the median open price. Otherwise, your rewards/risk can be ruined and you have to hold your position longer to achieve the same rewards/risks. Before the median price, you can keep searching for the best entry point where the price can least move against your position.

Pattern Completion Zone for AB=CD pattern
Figure 4: Pattern Completion Zone for Bearish ABCD pattern
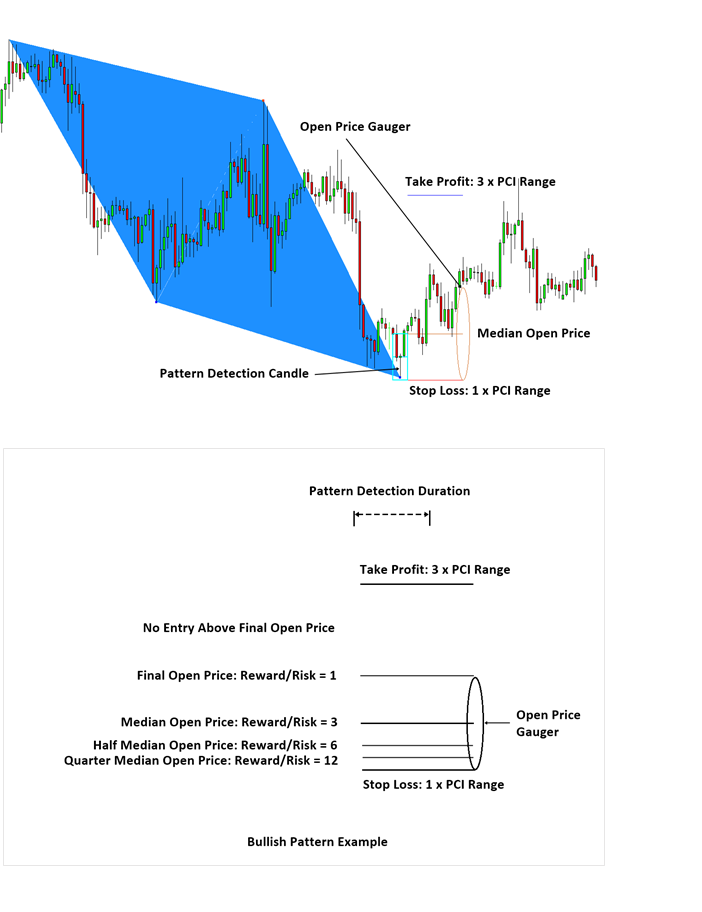
Take Profit and Stop Loss with Pattern Completion Zone
Figure 5: Take Profit and Stop Loss with Pattern Completion Zone
4. Potential Reversal Zone (PRZ) and Potential Continuation Zone (PCZ)
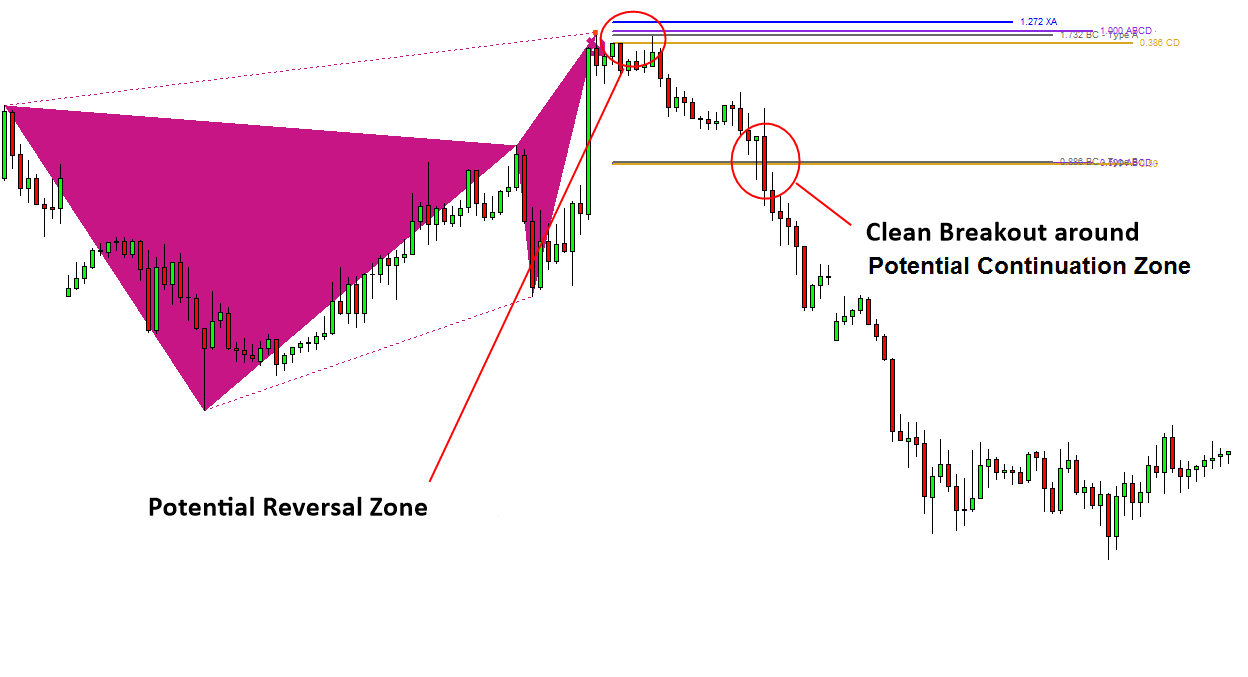
Simply speaking Potential Reversal Zone (PRZ) is the area where three or four Fibonacci levels are converging together. The original concept of Potential Reversal Zone was devised by Scott Carney to identify the final point D of the pattern. On the other hands, Potential Continuation Zone can be used to predict the future price movement (devised by Young Ho Seo). As contrast to the original Potential Reversal Zone, Potential Continuation Zone is constructed after the final point D is formed. Potential Continuation Zone is the level the price must penetrate in the case of global turning point. Potential Continuation Zone often helps us to gauge important milestones in price movement for our trading. For Precision Harmonic Pattern Trading, you will need to use Pattern Completion Interval, Potential Reversal Zone and Potential Continuation Zone together.

Potential Reversal Zone in Bullish Harmonic Pattern
Figure 6: Potential Reversal Zone in Bullish Harmonic Pattern
Potential Reversal Zone in Bearish Harmonic Pattern
Figure 7: Potential Reversal Zone in Bearish Harmonic Pattern
5. Japanese Candlestick Patterns Detection
In Harmonic Pattern Plus, you can scan 52 Japanese candlestick patterns automatically. This Japanese candlestick pattern can support your trading decision on top of the reversal harmonic patterns. However, you can only use this features if you prefer to use. It is not a compulsory to use these Japanese candlestick patterns. You can switch on and off this feature from indicator setting too. Visit indicator setting to enable the Japanese candlestick patterns.
Japanese Candlestick Pattern
Figure 8: Japanese Candlestick Patterns
6. Automatic Channel
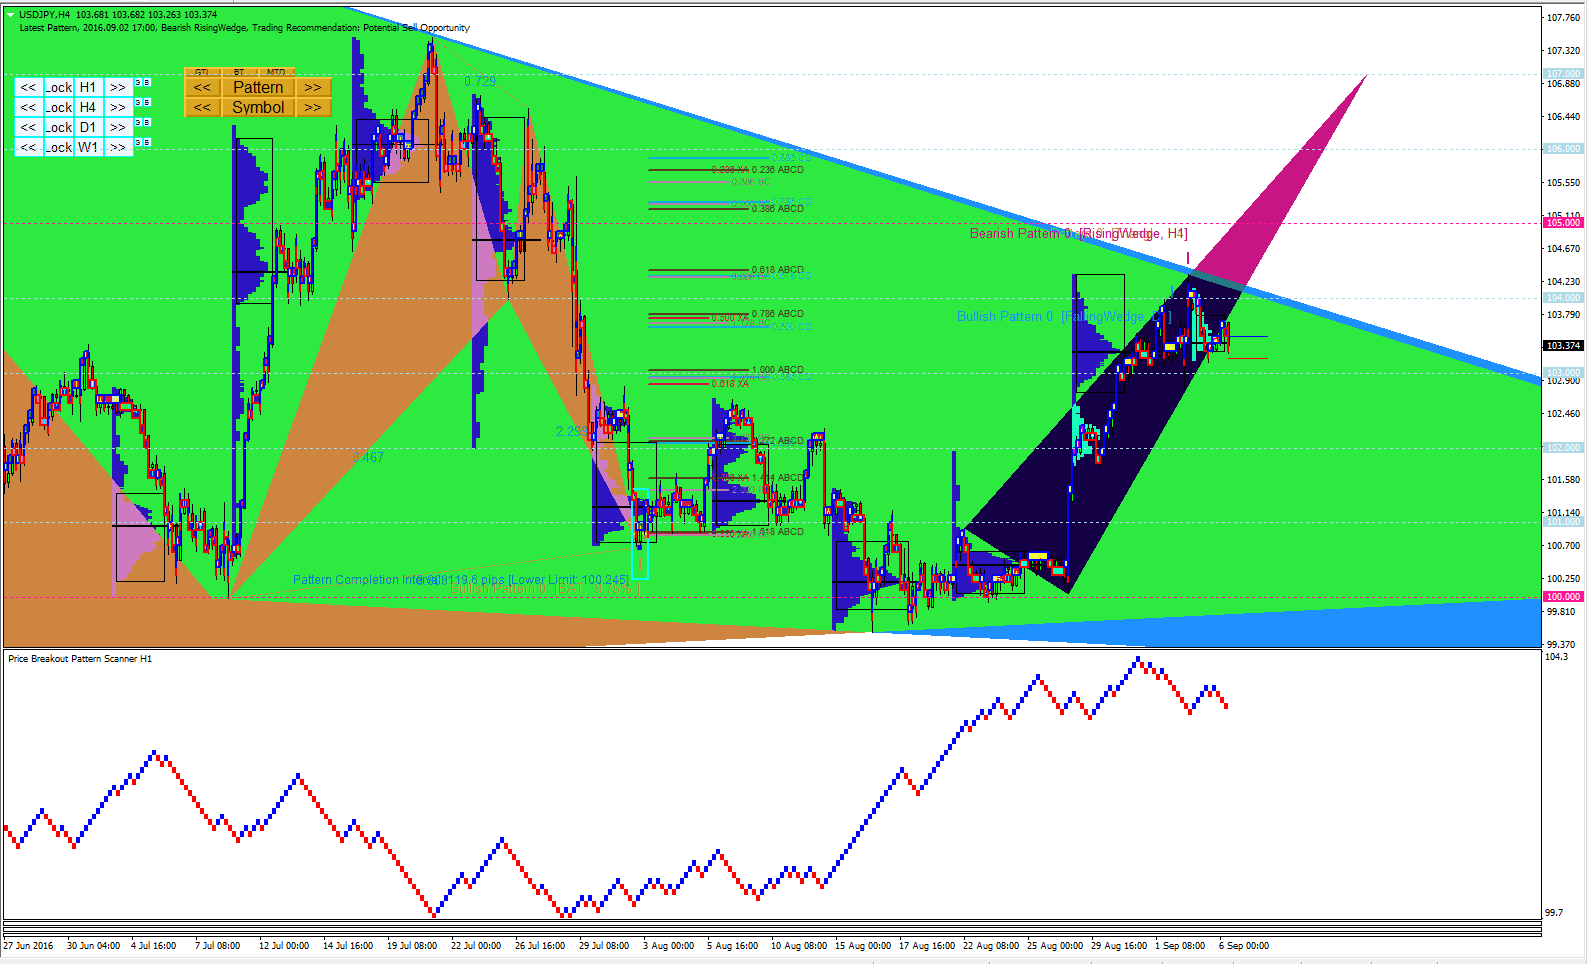
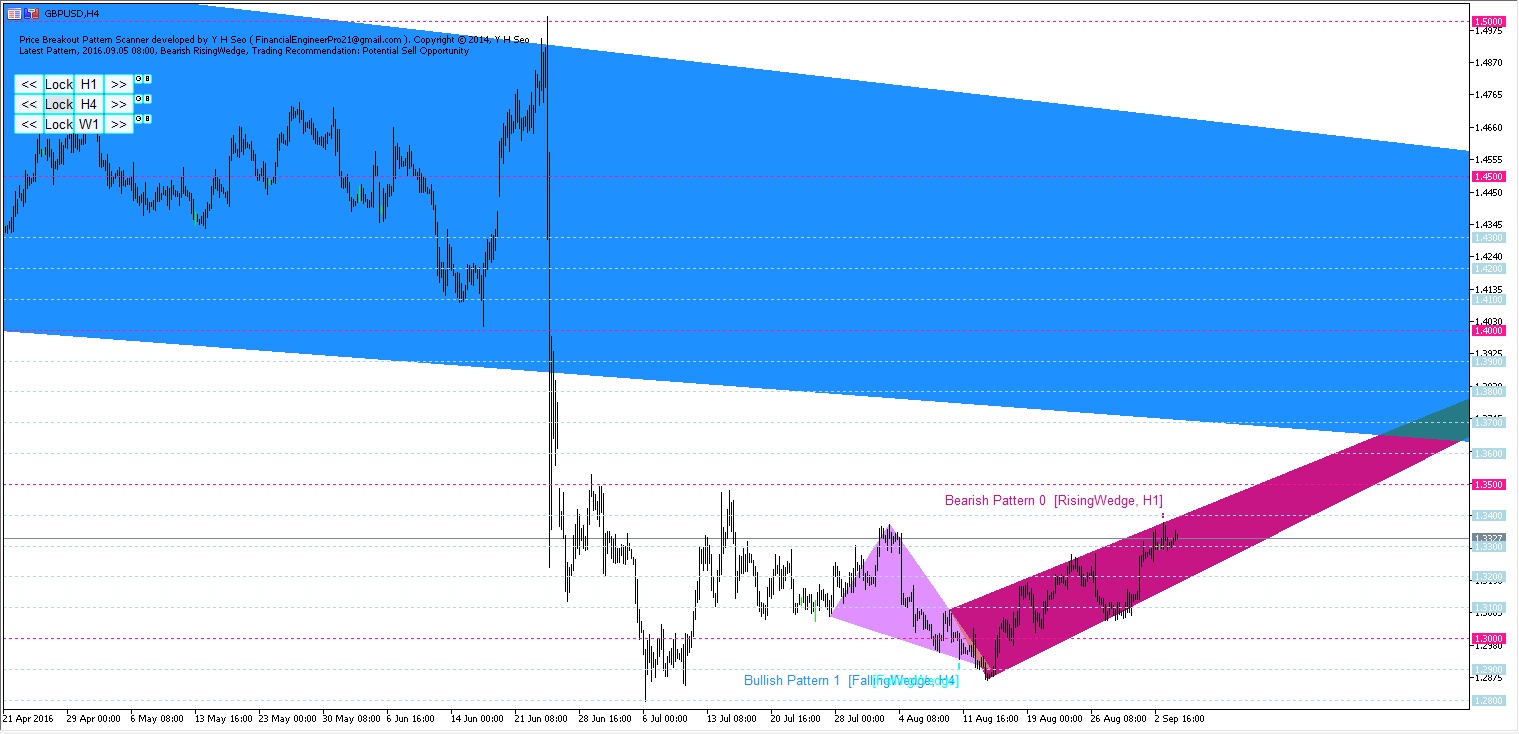
Beside the 52 Japanese candlestick patterns, the automatic channel is another feature to support your trading decision. Detection of turning point is much easier when the channel is located together with the pattern. For example, screenshot below shows the bearish turning point detected together with AB=CD pattern and channel together. You can switch on and off this automatic channel from indicator setting too. Visit indicator setting to enable the automatic channel.

Channel in Harmonic Pattern
Figure 9
Figure 9: Channel in Harmonic Pattern
7. Multiple Timeframe Pattern Analysis (No longer supported due to Multiple Timeframe Pattern Analysis Built in)
You will appreciate the power of multiple timeframe pattern analysis. With Harmonic Pattern Plus, you can bring the harmonic patterns in lower timeframe to upper timeframe. Or you can bring the Harmonic Patterns in upper timeframe to lower timeframe. To do this simply use Lock button in your chart. When you lock the pattern in your chart, they will stay even if you change the chart timeframe. In addition, you can even detect D1 and H4 Harmonic Patterns from H1 timeframe chart at the same time. To do so you have to put several Harmonic Pattern Plus into one chart. In addition, it is important to differentiate multiple timeframe pattern analysis from multiple timeframe pattern detection. Multiple timeframe pattern analysis brings the patterns detected in different timeframe into single chart to allow you visually reinforced trading decision. For example, if you have bearish BAT pattern in D1 timeframe and butterfly pattern in EURUSD H1 timeframe, then you have much stronger reason to sell EURUSD. In multiple timeframe pattern detection, you can be alerted when the pattern is detected from different timeframe. However, they will not bring the patterns into your chart. For your information, this feature is no longer supported due to the multiple timeframe pattern analysis implemented.
Input for Multiple Timeframe Harmonic Pattern Analysis
Figure 10: Input for Multiple Timeframe Harmonic Pattern Analysis
Multiple Timeframe Harmonic Pattern Analysis
Figure 11: Multiple Timeframe Harmonic Pattern Analysis
8. Multiple Timeframe Pattern Detection (alert)
Multiple timeframe pattern detection allows you to monitor the patterns in different timeframe efficiently. For example, if you attach Harmonic Pattern Plus to H1 timeframe EURUSD chart. Then you can still monitor what is happening in another period like M5, M15, M30, H4 and D1etc without actually opening another chart.

Multiple Timeframe Pattern Detection for Harmonic Pattern
Figure 12: Multiple Timeframe Pattern Detection for Harmonic Pattern
9. Even More Features
I think there are even more features you can use than just described features in this article. You can probably try to find out by yourself.
10. Steps to improve Trading Performance with Harmonic Pattern Plus
For starters, we recommend you to practice these steps on demo account first. These steps can be applied to Harmonic Pattern Scenario Planner too. Typically, fund management firm or investment banks offer 1 to 3 month initial training for junior traders before they go for the live trading.
1. Firstly, make sure that you understand the basic concept of Pattern Completion Interval, Potential Reversal Zone and Potential Continuation Zone. Then make sure that you understand the basic secondary confirmation like RSI, Bollinger Bands, MACD, and other price action tools.
2. Understand the risk management principle with Pattern Completion Interval. You must be confident to apply them in real world trading. For example, you do not need 90% or 80% winning rate but your rewards/risk ratio matter for your profits.
3. While you are practicing step A and B, understand the number and figure in the Guided Trading Instruction. If Reward/Risk =5, you only need 20% success rate to break even. You can also set your target goal using Guided Trading Instruction.
4. Try to understand the price action around Potential Continuation Zone and Potential Reversal Zone. Frequently watch these levels to understand how the market works.
5. Many Harmonic pattern traders combine Harmonic Pattern Plus with more advanced secondary confirmation techniques like Mean Reversion Supply Demand, Price Breakout Pattern Scanner, or Elliott Wave Trend.
Appendix –Mean Absolute Percent Error (MAPE) in details
1. Mean Absolute Percent Error
As harmonic pattern detection and statistical geometric pattern detection share a lot of common knowledge, we use some established concepts from statistics, econometrics and other financial theory for our harmonic pattern software. Firstly, we introduce the concept of pattern matching error. The pattern matching error is the error between the detected pattern (by Harmonic Pattern Plus) and the ideal pattern in the textbook. The pattern matching error represents how closely the detected patterns are matching to the reference pattern in the textbook. Some traders might doubt why we do not introduce the reverse concept of pattern accuracy (pattern accuracy = 1 – pattern matching error) instead of pattern matching error. Simply speaking, it is because it is the industrial standard to report the error than accuracy in many financial and statistical organizations. However, the difference between pattern matching error and accuracy is none. You need to get used to convert pattern-matching error to pattern matching accuracy for your financial trading.
There are many error metrics or loss function can be used for pattern matching error for harmonic patterns including MSE (Mean Squared Error), RMSE (Root Mean Squared Error), MDE (Mean Absolute Error), MAPE (Mean Absolute Percent Error). We list some of common error functions for your better understanding:

Harmonic Pattern Error Calculation
Figure 13: Harmonic Pattern Error Calculation
To provide the universal measure of pattern matching error regardless of pattern types and their size, we use MAPE (Mean Absolute Percent Error) in our Harmonic Pattern Software. To help more clear understanding of our users, we present full formula for our pattern matching error, MAPE:

Harmonic Pattern Error Calculation with MAPE
Figure 14: Harmonic Pattern Error Calculation with MAPE
As the pattern matching accuracy is equal to 1 – pattern matching error, Harmonic pattern with smaller MAPE represents the cleaner and more beautiful pattern. Both our Harmonic Pattern Plus and Harmonic Pattern Scenario Planner will report MAPE to traders. Traders can use this MAPE metrics to fine tuning entry and exit timing for their trades. Also remember that both Harmonic Pattern Plus and Harmonic Pattern Scenario Planner have the ability to reply historical pattern from your charts for your complete strategy development.

Harmonic Pattern Error Calculation Example with MAPE
Figure 15: MAPE 0.54% is good and trader can trade such a pattern with more confidence.
2. Pattern Matching Accuracy VS Success Rate
One common mistake for traders is to take pattern matching accuracy (= 1 – pattern matching error) as success rate of the pattern. This mistake is sometimes found in commercial software too. This is quite misleading and traders must not confuse between pattern matching accuracy and success rate. Pattern matching accuracy represents how closely the detected patterns are matching against the ideal pattern introduced in the text book. Pattern matching accuracy will tell you how much the shape of the detected patterns are alike to the ideal pattern known to traders. Normally the detected patterns are expected to have MAPE less than 10%. However, we often observe that some patterns are as ugly as having MAPE 25%, but they still have quite good predictive power. However if MAPE is too large, then you may decide not to trade. The pattern look like a perfect pattern can still fail to spot trend reversal point due to many factors like noisy in data and round up errors in computing, etc.
On the other ends, Success rate represents how many times the patterns were successfully predicted the trend reversal in historical data. The success rate is highly subjective to pattern itself. For example, Shark pattern and butterfly pattern have different success rate. Our harmonic pattern software is well designed for you to study the success rate of each pattern and to improve your trading skills. Although we have pointed the difference between patterns matching accuracy and success rate by their definition, both have strong connection too. For example, you will less likely to make a mistake in your trading when you spot the patterns with smaller MAPE in your charts. Because the pattern with large MAPE might indicate that the pattern is still immaturely formed, therefore the price might continue to move in the trend direction instead of tuning.
3. Further note on Pattern Matching Error MAPE
As we described, there are quite bit of mathematics used to describe how closely the detected harmonic patterns are matching against the ideal patterns. We did it by taking industrial standard approach. If you found it is difficult to digest the concept of Pattern Matching Error (MAPE), then good analogical concept can be found from Multiple Regression equation. For example, pattern matching error, MAPE is similar concept to Mean Square Error (MSE) of multiple regression equation.
For professional traders and investors, this can be very usual things they come across in their trading floor each day. Although there are little bit of theory to digest, traders are not necessarily need to know the math behind our pattern detection theory. Therefore, our harmonic pattern software can be used for any level of traders including beginners. So feel free to give a go with our harmonic pattern software. Traders just need to know that smaller MAPE (%) for the detected pattern indicates that the detected pattern is more close to ideal or perfect patterns from the text book.
Harmonic Pattern Plus is a repainting but powerful pattern scanner with tons of professional features. It also provides the pattern completion zone to manage your trading risk.
https://algotrading-investment.com/portfolio-item/harmonic-pattern-plus/
https://www.mql5.com/en/market/product/4475
https://www.mql5.com/en/market/product/4488
Harmonic Pattern Scenario Planner is a repainting but predictive pattern scanner. It is the most advanced Harmonic Pattern Scanner available in the market. Of course, it comes with tons of professional features too. It also provides the pattern completion zone to manage your trading risk.
https://algotrading-investment.com/portfolio-item/harmonic-pattern-scenario-planner/
https://www.mql5.com/en/market/product/6101
https://www.mql5.com/en/market/product/6240
X3 Chart Pattern Scanner is the non repainting and non lagging Harmonic Pattern and Elliott Wave pattern. This pattern scanner provide you a lot of advantage for your trading from its non repainting and non lagging pattern detection algorithm. This is our next generation chart pattern scanner. At the same time, you can customize each pattern structure to find the most optimal trading entry and exit. It also provides the pattern completion zone to manage your trading risk.
https://algotrading-investment.com/portfolio-item/profitable-pattern-scanner/
https://www.mql5.com/en/market/product/41992
https://www.mql5.com/en/market/product/41993
PDF version of article can be found from the link below:
Related Products


