Trading Tips for Newbie in Forex and Stock Market
In this article, we cover some trading tips for newbie staring Forex and Stock market. We will use the Q & A approach to share the useful information for newbie. Below the questions and answers will explain the key elements of successful trading in Forex and Stock market.
What is trading in Forex and Stock Market ?
Trading is a profit seeking operation with buying and selling the financial asset like a currency, stock or cryptocurrency. Profit seeking in long run is often based on materializing the regularities in the financial market. If anyone made money from the market in long run, this means that the market was not random, at least to them. In another words, you have found some sort of regularities in the market. Some people call these regularities as correlation, pattern, trend, wave, volatility, holes in the financial market, or many other names. But they are all regularities regardless of how you call them. Even you are doing some sort of arbitrage trading, you are still making use of some regularities that are known to few people. For example, in this case, you have found a pattern that some place selling the finanical asset cheaper than the other place or the other way around. Typically, this sort of arbritage information in financial market can be found using positive or negative correlation between two brokers or two exchange.
What are the regularities you should know for live trading ?
There are regularities from simple to complex in the financial market. To make your life simple, I have gathered five most occurring and most important regularities for trader in the price pattern table. They are Trend, Seasonality, Cycles, Fractal Wave and Correlation. Typically each trading strategy around Forex and Stock trading is designed to capture one of these five regularities. The best way to understand these regularities is to visualize the market using the chart. Typically, the candlstick chart is used mostly in Forex and Stock trading. When we use the candlestick chart, we can see these regularities in the chart. We can make a buy or sell decision based on our understanding of the market.
How to capture these regularities for profit ?
To visualize the market and to understand the regularities in the market, it is important to understand your tools. Depending on the tools, you may or may not able to identify the specific regularties existing in the market. If the market consists of a simple regularty, then you may not need any tool. However, this is very unlikely in the modern financial market. In addition, you need to understand why a particular tool is designed. Any tools used in the financial market has some assumption around the tool. When the assumption of the tool does not fit for the market, the tool can fail. Before blindly applying any technical indicator like MACD, CCI, RSI, etc, you need to ask how these tools are constructed and what the purpose of these tools are. This is the most important question for the successful trading. For example, the price action, price pattern and chart pattern are the direct price analysis. The main assumption of the direct price analysis is based on the endless zig zag movement of the price, also known as the fractal wave.
Explain the regularties in detail so I can trade better
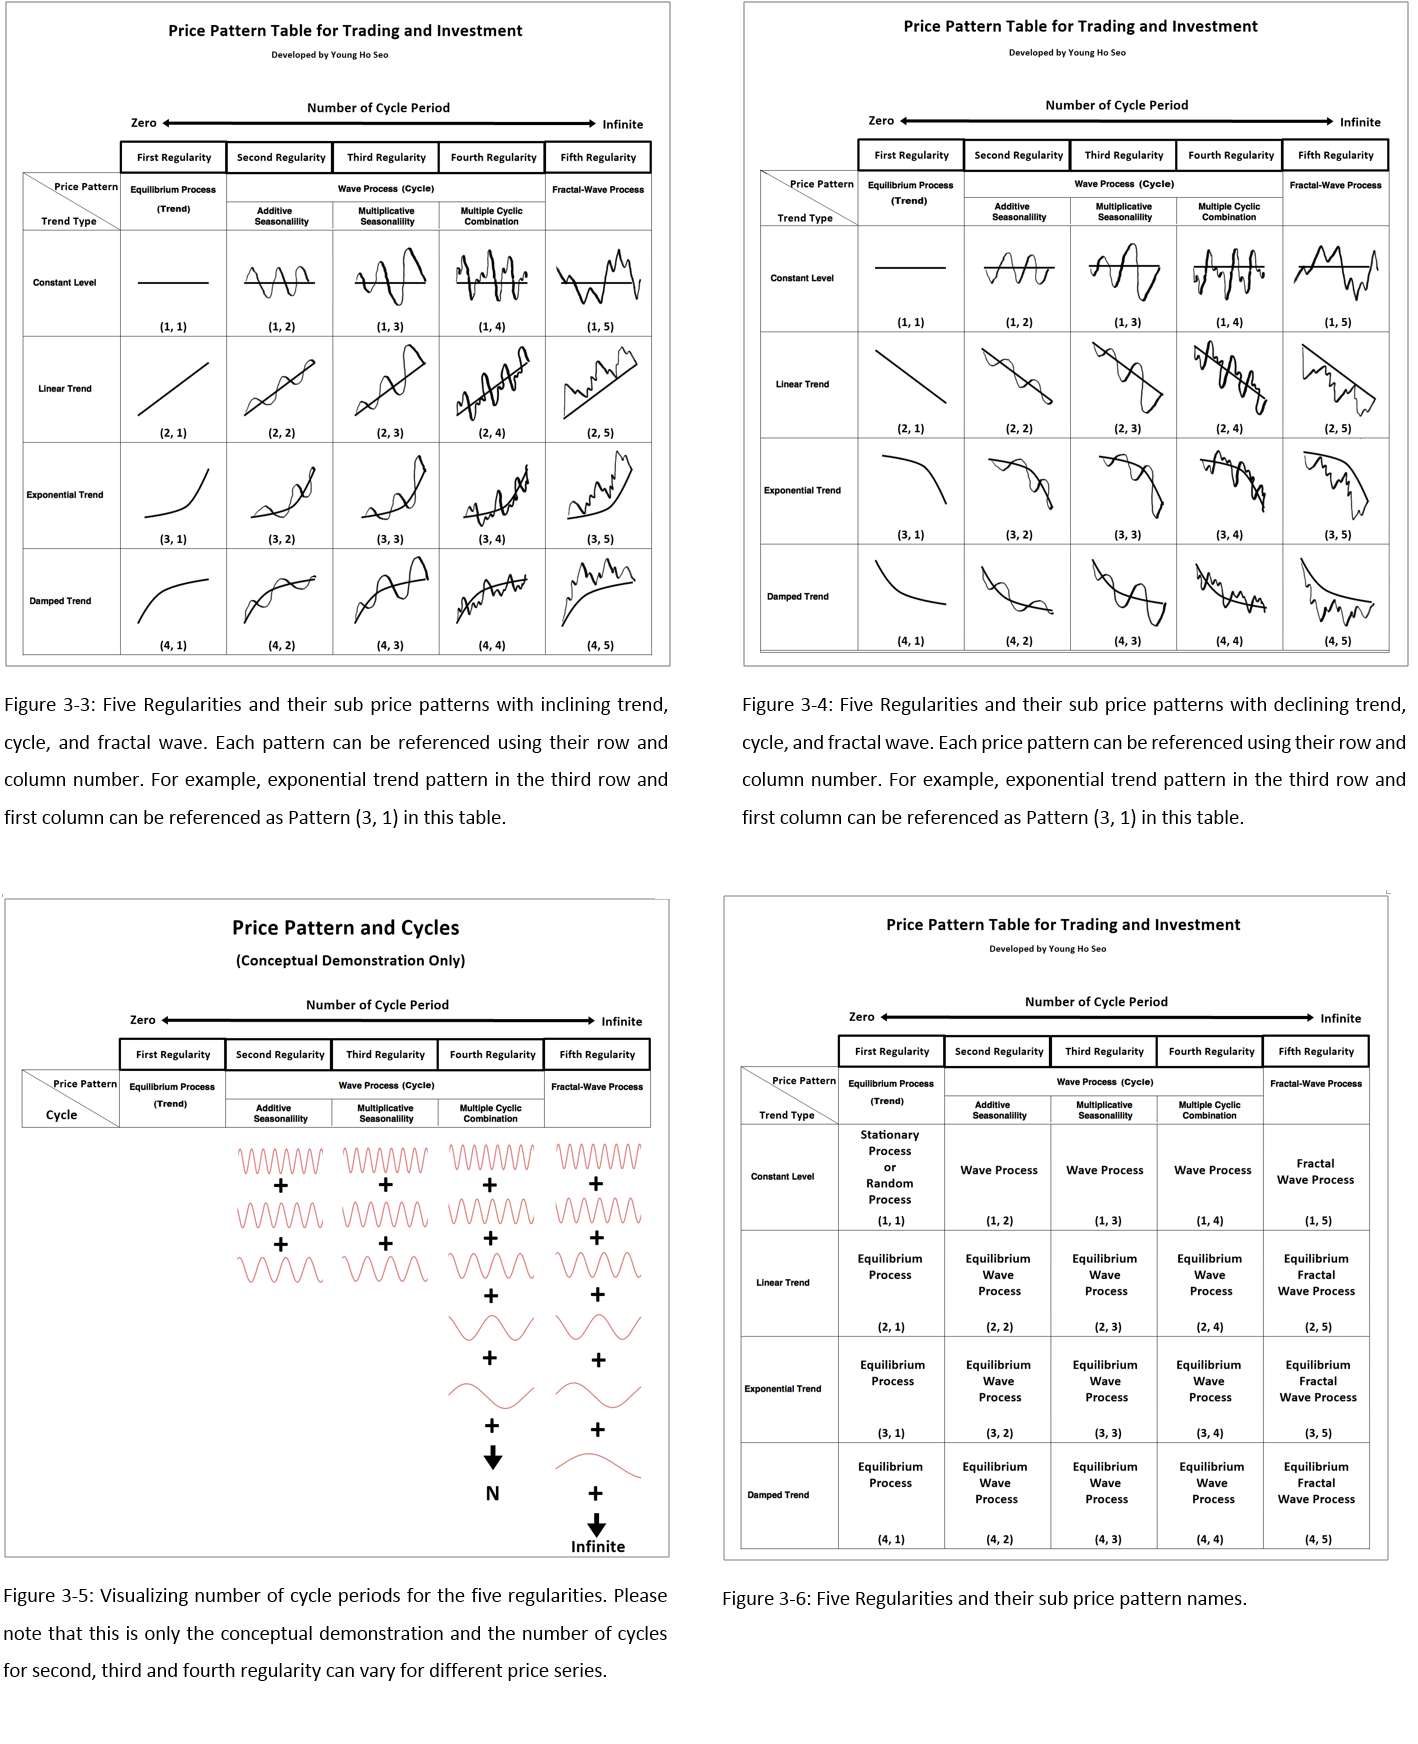
If you want to understand the regularities in detail, then it is best to use the price pattern table showing the five regularities. Price pattern table shows five regularities existing in the market. From left to right, we are having more complex form of regularities (or market) depending on what internal and external factors are correlated with. Price pattern table is also the representation of how financial market evolves from simple to complex with number of influencing internal and external factors.
Trend (Column 1 in Price Pattern Table)
This is extremely simple market, where only few variable affect the market. Hence, it is showing steady increase or stead decrease. Trading this type of market is not so complicated. You would become just successful trader using some simple technical indicators like moving average, MACD, etc. However, in reality, we do not get this sort of simple market most of time because real world market is filled with so many government regulations, diversified players, fast information release, etc.
Seasonality (Column 2: Additive Seasonality + Colum 3: Mutiplicative Seasonality in Price Pattern Table)
When market started to correlate with time, we will start to see some sort of cycles in the market. When there is single cycle you would notice but several of the combined cycles can confuse many average people if they are not trained. Buy and sell decision making can be more complicated comparing to the market state in Column 1. The most important assumption with this market type is that existance of some deterministic cycle. In another words, if we can identify the wavelength and amplitude of the cycle, we can make money.
Combined Cycles (Column 4 in Price Pattern Table)
Many cycles are mixed and it is difficult spot the presence of one dominating cycle because there are too many cycles mixed. We need more and more skillful decision making to become successful trader in this type of market.
Fractal Wave (Column 5 in Price Pattern Table)
Number of influencing variables in the market are too many. For example, there are too many government regulations, too many diversified players, too many information release, etc in the market. One or few cycles are no longer dominating the market patterns. The market looks like fully chaotic. Sometimes, it shows orders and sometimes, it shows disorders. To be successful in this market, we need to understand the stochastic cycle. Stochastic cycle means that a cycle does not have a determinstic wavelength and amplitude. Instead, the cycle shows the probablistic wavelength and amplitude + multiple cycles are combined. This complicated cycles structure is known as the fractal wave. This sort of the market is even more complicated than the mixed cycle market in column 4 in the price pattern table.
If you want to become successful, it is best to think outside box for this type of the market. The key to is to use a higher order or superior method beyond the general method to deal with cycles. Instead of trying to spend countless hours trying calcuate probablistic wavelength and amplitude of the cycle, it is better to use a geometric method that provides the combined insight over the small cycles, medium cycles, large cycleds and superimposed cycles. Such geometric analysis include the price action, price pattern, chart pattern and so on.
Summary on Regularties
So far, we have discussed four regularties or four market types from top to bottom. From top to bottom, the market type becomes simple to complex. In fact, you can say that top one is the sub class of the bottom one. For eaxmple, trend can be included in the seasonaltiy type of market too. Likewise, seasonaltiy can be included in the combined cycle type of the market too. Likewise, the combined cycle type of market can be included in the fractal wave type market too because deterministic cycle is only the sub set of stochastic cycle. In addition, the fractal wave type market can possess the trend property too. Choosing the right technical anlaysis is really based on your belief on how complex the market is. Now you probably have the complete understanding over the price pattern table.
What type of market do you believe you are dealing with in Forex and Stock market?
If you know what type of market you are dealing with, you can choose the right tool for the market. It is the first step toward the success. Hence, this is a important question for the successful trading. Most of us, including the average trader, do not believe that the market is simple. Hence, it is likely that two latter market types might be close to the real world financial market instead of the first two market types. Many people are pessimistic about seeing the deterministic cycles in the financial market. For example, the economist will not say that the business cycle is 5 years or 10 years. However, they will say the business cycle is 5 to 10 years. This means that it can be any period between 5 years and 10 years. In some extreme case, it can be longer than 10 years and it can be shorter than 5 years too. This means that the business cycle is stochasic and not determinstic. Hence, it is very likely that the financial market is also based on the stochastic cycle too. Hence, fractal wave would provide the best understaning for Forex and Stock trading. If then, the direct price analysis like the price action, price pattern and chart pattern could be the good choice to trade in Forex and Stock market.
What else trader should know about for safe capital increase ?
Risk management and position sizing is the golden rule for successful trading. Key point is to understand these three variables for your trading.
- Breakeven win rate
- Success rate
- Reward/Risk ratio
Physically and psychologically, with these concepts in your head, you will get a lot of buffer for losing trades but spring board for winning trades.
Any further tips on improving profit ?
Trade with deep decision making instead of superficial decision making. It is the quality matter and not quantity. It is useless that you trade fast reckless. Many number of trade will not guarantee your success. Even for one trade, put the quality piece of information technically (from chart) and fundamentally (from surrounding market environment) together.
If you are looking for the tools for the direct price analysis like the price action, price pattern and chart pattern, then visit our website. Our website provides the best tools geared up for the price action, price pattern and chart pattern. Our products include the technical indicator, expert adviser, inter-market analysis tools and pattern scanner making the best use of Support, Resistance, Fibonacci Analysis, Harmonic Pattern, Elliott Wave, Supply Demand Analysis, Volume Spread Analysis and Market Volatility. MetaTrader product range includes the Harmonic Pattern Indicator, Elliott Wave Indicator, Momentum Indicator, Volume Spread Analysis, Support Resistance Indicator, Supply Demand Indicator, Pairs Trading Indicator, Renko Chart Indicator, Volitility Indicator and Expert Advisors.
https://www.mql5.com/en/users/financeengineer/seller#products
https://algotrading-investment.com/
Related Products


