Fibonacci Chart Pattern
Fibonacci chart patterns are the chart patterns that structured with Fibonacci ratio. Fibonacci ratio is based on Fibonacci analysis. A Fibonacci analysis is a popular tool among technical traders. It is based on the Fibonacci sequence numbers identified by Leonardo Fibonacci in the 13th century. The Fibonacci sequence numbers are:
0, 1, 1, 2, 3, 5, 8, 13, 21, 34, 55, 89,144, 233, 377, 610, 987, 1597, 2584, 4181, 6765, …………………
As the Fibonacci number become large, the constant relationship is established between neighbouring numbers. For example, every time, when we divide the former number by latter: Fn-1/Fn, we will get nearly 0.618 ratio. Likewise, when we divide the latter number by former: Fn/Fn-1, we will get nearly 1.618. These two Fibonacci ratio 0.618 and 1.618 are considered as the Golden Ratio. We can use these Golden ratios to start our Fibonacci analysis. However, many technical traders use additional Fibonacci ratios derived from the Golden ratio. Since the calculation of each Fibonacci ratio is well known, I have listed all the available Fibonacci ratio calculation in Table 6.1.
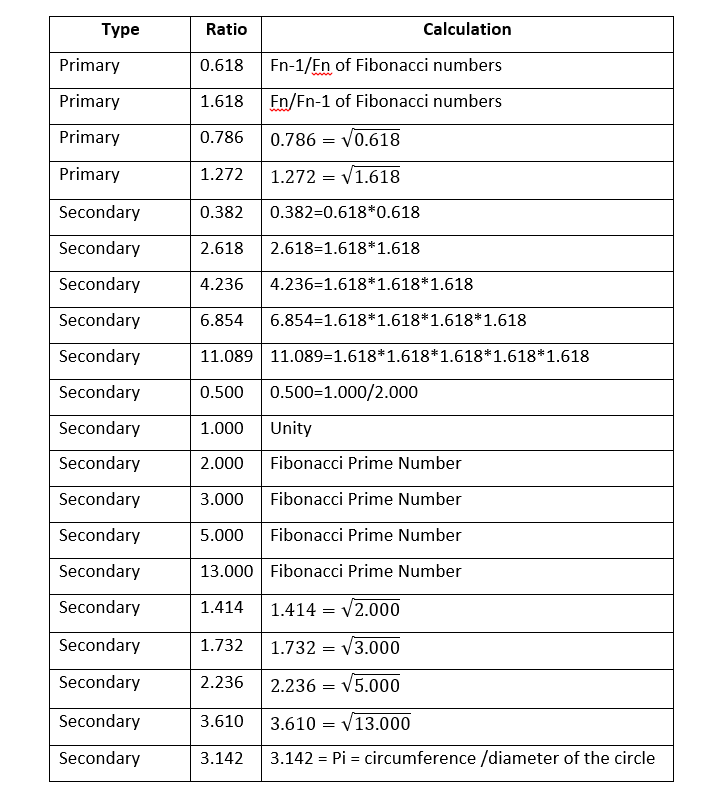
Fibonacci Ratio Table
In fact, Fibonacci pattern analysis in financial trading is extremely popular. As with support and resistance analysis, Fibonacci analysis is probably the most popular technical analysis among traders. There are two important techniques in Fibonacci analysis. First technique is Fibonacci retracement. Second technique is Fibonacci expansion. In fact, former is just one triangle pattern and latter is two triangle patterns. Hence, you can consider these two as Fibonacci price patterns. These two price patterns share the identical concept to the retracement ratio and expansion ratio.
There are two important points in regards to Fibonacci patterns. Firstly, you need to spot swing high and swing low in price series to identify Fibonacci price patterns. The easiest way of doing this is just to apply Peak Trough Transformation using either ZigZag indicator or Renko chart. Therefore, you start with predefined swing points in your chart. Secondly, Fibonacci retracement technique will concern one triangle that is two price swings. Fibonacci expansion technique will concern two triangles that are three price swings. Most importantly, calculation of Fibonacci retracement and expansion is identical to the retracement ratio and expansion ratio calculation in RECF notation. Sometimes, we might use percentage format instead of decimal format. However, two quantities are the same. For example, the Golden ratio 0.618 is the same as 61.8%.
Let us start with Fibonacci retracement example. For simple example, we use 61.8% Golden ratio. For retracement, we can have two cases including bullish (Trough-Peak) retracement and bearish (Peak-Trough) retracement. In bullish retracement, 61.8% retracement level will act as a support level. Price will reverse in the correction phase to follow the previous bullish movement. In RECF pattern definition, 61.8% bullish retracement can be expressed as below:
R0 = 0.618 = Right swing of first triangle / Left swing of first triangle
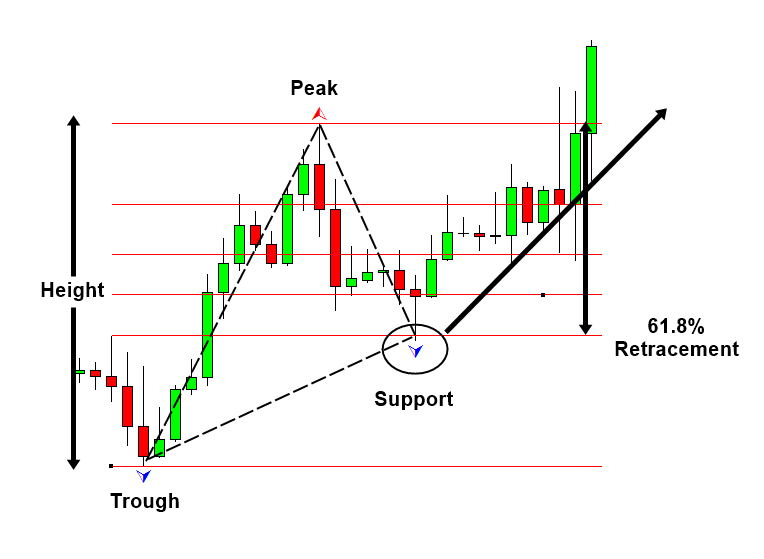
Buy after Retracement
Likewise, in bearish retracement, 61.8% level will act as resistance. Price will reverse in the correction phase to follow the previous bearish movement. In both case, the 61.8% retracement will be measured from end of correction phase to previous peak or trough. We have used percentage in this example. Some technical traders prefer to use the ratios in decimal places like 0.618. It is just your preferences. Using ratio or percentage does not affect the accuracy of trading. In RECF pattern definition, 61.8% bearish retracement can be expressed as below:
R0 = 0.618 = Right swing of first triangle / Left swing of first triangle
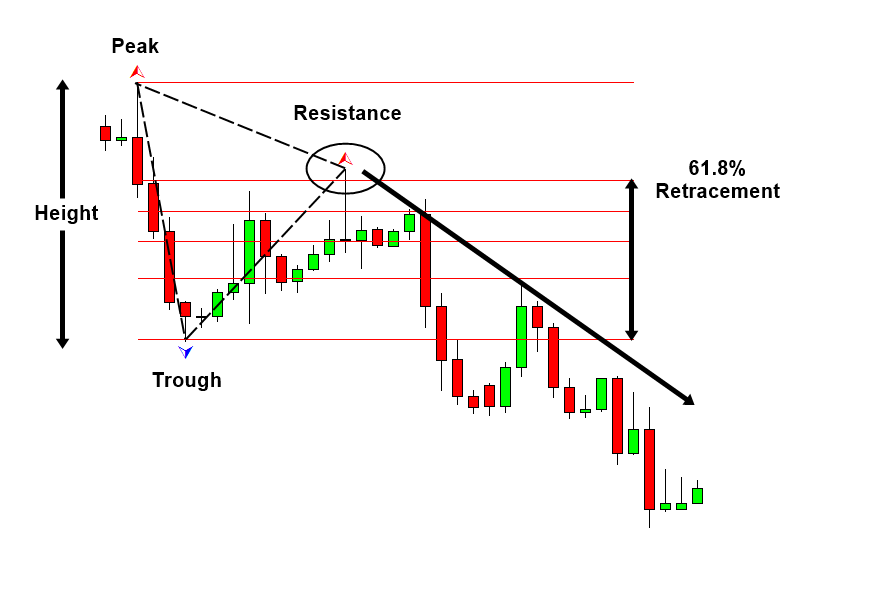
Sell after Retracement
You can use other Fibonacci ratios like 0.382 or 1.618 in the exactly same way as 0.618. Some traders use secondary Fibonacci ratios in addition to the primary ratios.
Fibonacci expansion is slightly more complicated than Fibonacci retracement because it concerns two triangle (i.e. three price swings). As in retracement technique, we can have two cases including bearish (Trough-Peak) expansion and bullish (Peak-Trough) expansion. In bearish expansion, we will measure the expansion from where the correction ends to next peak. In the next peak, we will expect the bearish reversal in the same direction to the correction. In fact, the 100% Expansion level is act as the resistance in Figure 6-3. Likewise, in bullish expansion, we will expect the bullish reversal in the same direction to the correction. In Figure 6-4, 61.8% expansion level acts as the support. In RECF pattern definition, 61.8% bearish and bullish retracement can be expressed as below:
E0 = 0.618 = Right swing of first triangle / Left swing of second triangle
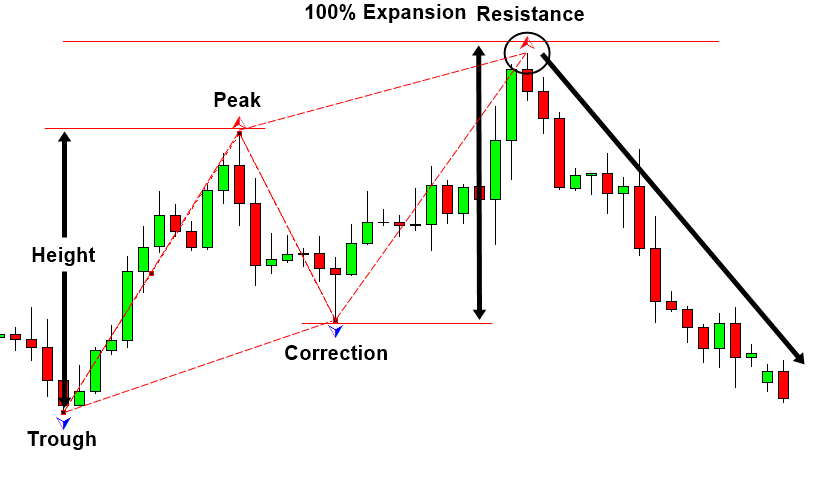
Sell after Expansion
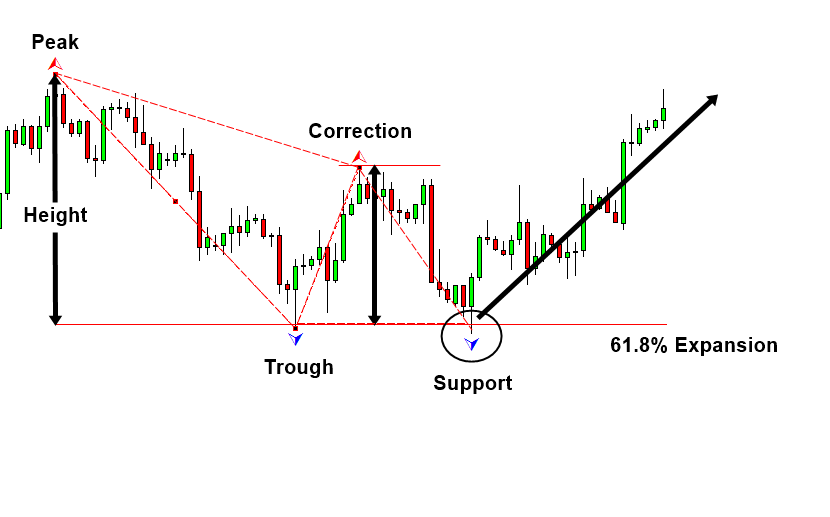
Buy after Expansion
About this Article
This article is the part taken from the draft version of the Book: Profitable Chart Patterns in Forex and Stock Market: Fibonacci Analysis, Harmonic Pattern, Elliott Wave, and X3 Chart Pattern. Full version of the book can be found from the link below:
You can also use Harmonic Pattern Plus in MetaTrader to detect Fibonacci Chart Patterns. Harmonic Pattern Plus is the advanced Fibonacci Analysis Indicator for your trading. Below are the Links to Harmonic Pattern Plus
https://www.mql5.com/en/market/product/4488
https://www.mql5.com/en/market/product/4475
https://algotrading-investment.com/portfolio-item/harmonic-pattern-plus/
Below is the landing page for Optimum Chart (Standalone Charting and Analytical Platform).
https://algotrading-investment.com/2019/07/23/optimum-chart/
Related Products


