Optimum Chart – Pair Trading Analysis with Correlation
In this article, we will explain how to use Optimum Chart to perform pairs trading with correlation and cointegration analysis for Forex Trading. Optimum chart provides the automatic correlation and spread analysis in just one or two button clicks providing you good potential entry and exit. Pairs Trading or statistical arbritage is known as the cutting edge trading strategies among the Forex and Stock market trader. Pair trading strategy is one of the built in trading strategy inside Optimum Chart. Here is a step by step guide on how to use this advanced pair trading analysis for your benefit.
We provide Pair Trading strategy as scanner. This means that our Pair trading strategy scanner will scan across all symbols in your symbol list. Then it will automatically apply statistical test and product the results you need for your trading.
First step is of course to open one chart. You can open any chart.
In this example, we are opening AUDCAD H1 chart. Now go to Panel and expand it. You will see Panel called “Pair Trading Analyzer”. Attach the Pair Trading Analyzer to AUDCAD H1 chart we have just opened.

Once it is attached to chart, it will look pretty empty because we have not asked to perform any analysis yet. To ask the panel to perform analysis, click “Analyze Pair” button. Note that the analysis is fully automatic but it can take few minutes to few hours. While it is doing analysis, do not disturb.

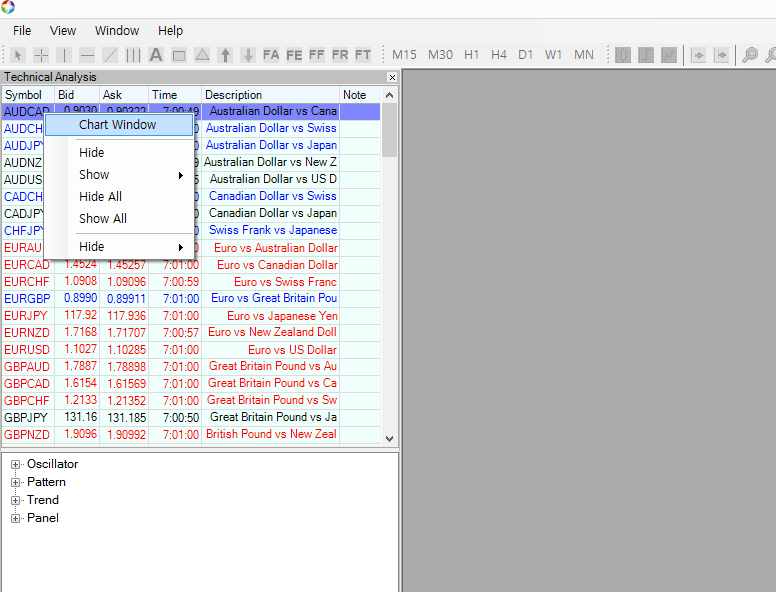
The Panel will product the results for pairs analysis. It looks like below. Pairs trading is basically the analysis on two correlated and cointegrated pairs. Now to find out the strongest spread, just click the column header of Absolute spread.

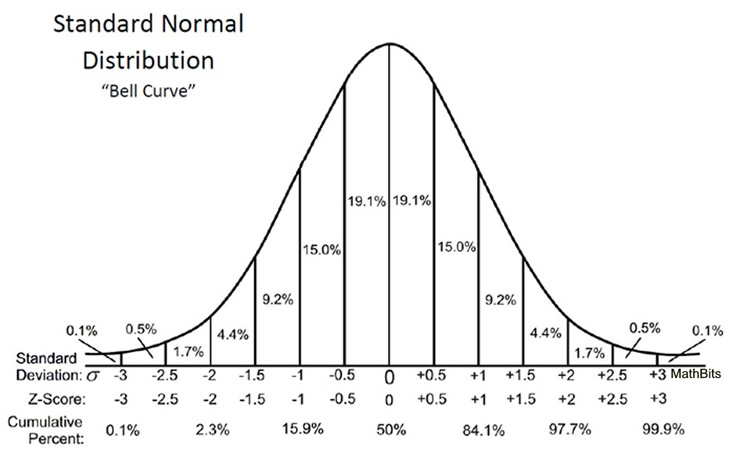
Note that our spread is standardized one. This means that spread displayed is in fact Z score. As you know, Z score will be fluctuating between 4 and -4 in its extreme. Most of time, it would stay inside 2 and -2. You can apply the similar intuition as you learnt from normal distribution as below.
Now, to get more catch analysis, just open Chart. This will give you even better analysis. When you open chart, it will show you the histogram of Pair spread. At the same time, it draws the moving average of spread in the same window. This helps you to check any pull back in the spread. In addition, it also provides the 1 to 1 scaled chart between two correlated symbols. Hence, it helps which symbol is acting more dominant bullish which symbol is acting more dominant bearish.
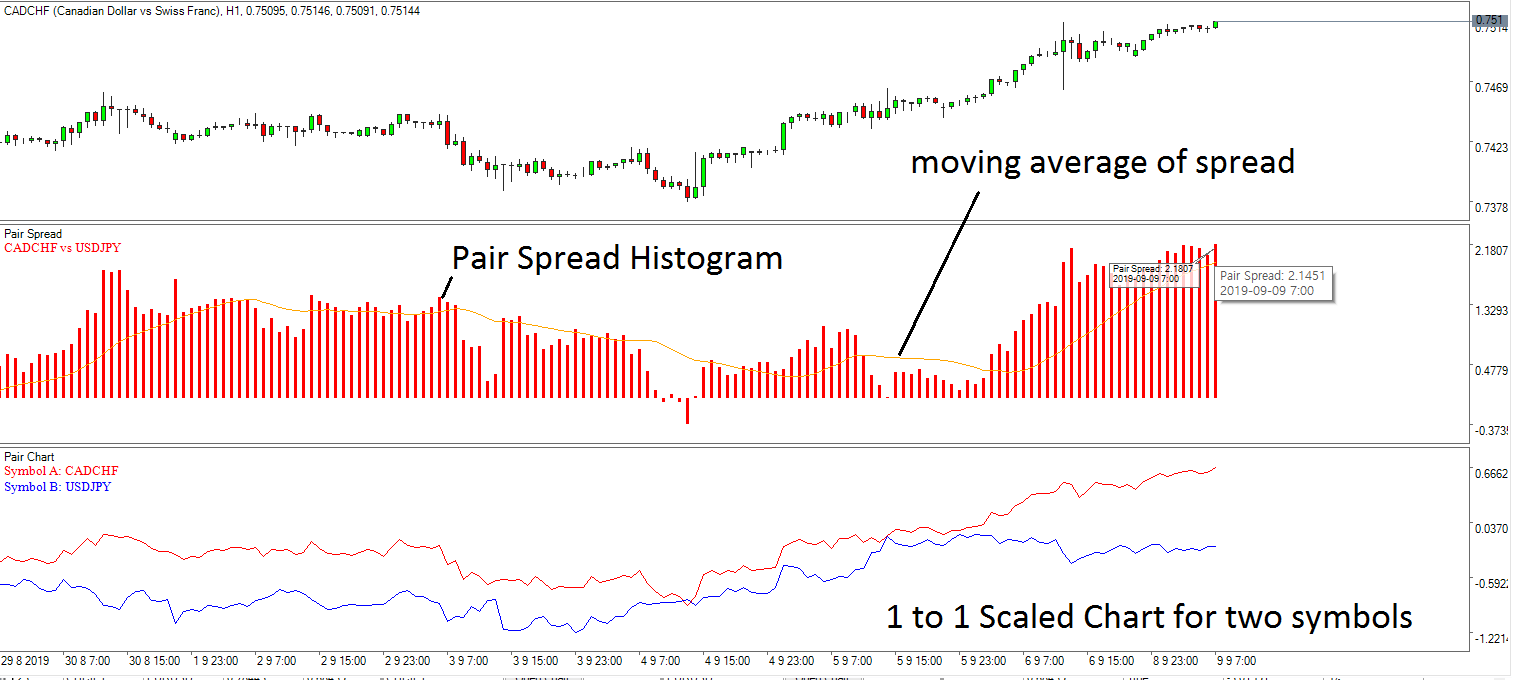
When the spread is in its extreme (i.e. Z score > 2.5), we can expect that the spread will be eventually converging. This means that you can long on one position and you can short on the other position to create a pair of hedging positions.
Good news is that we do provide other powerful techniques like Harmonic Patterns and Elliott Wave pattern and advanced support and resistance tools to decide which currency is likely to get bullish reaction and which currency is likely to get bearish reaction.

Let us say that you had your analysis in H1 timeframe and then you want to see the analysis D1 timeframe. In that case, you have to close your H1 timeframe analysis first, and then open new D1 chart and then apply Pair Trading Spread Analyzer from Panel again. This is the recommended approach instead of just switching the timeframe from the same chart. We recommend to use fresh chart for fresh recalculation of everything.
We do not allow the simultaneous viewing of the H1 timeframe and D1 timeframe analysis at the same time for Pair Trading Analysis Panels because it would impose a lot of computation on your CPU and Memory. However, for Forex, the calculation should be quick and fast. For other panels like Harmonic Pattern Scanner and Correlation Ranking Heat Map, you do not need to worry about this because they will scan across multiple timeframe. Do understand each algorithm takes different CPU and Memory usage.
https://algotrading-investment.com/2019/07/23/optimum-chart/
In addition, we provide the standalone pairs trading analyzer in MetaTrader 4 and MetaTrader 5. Although the user interface is different from Optimum chart, Pairs Trading Station in MetaTrader provides the robust correlation and spread analysis tool kit for your trading. You can also use the Pairs Trading Station to accomplish the Correlation and Spread Analysis in MetaTrader. Here is the landing page for Pairs Trading Station in MetaTrader 4 and MetaTrader5.
https://algotrading-investment.com/portfolio-item/pair-trading-station/
Related Products


