Take Profit and Stop Loss using Chart Pattern
We will discuss how to set take profit and stop loss using Chart Pattern when you trade in Forex and Stock market. First of all, let us talk about some basics of stop loss and take profit. Stop loss and take profit are two types of exit orders to manage your risk and reward in forex and stock trading. A stop loss order is an instruction to close your position if the market moves against your order by a certain amount. A stop loss order can help you limit your losses and protect your capital. For example, if you buy GBP/USD at 1.1000 and set a stop loss at 1.0950, your position will be closed if the price falls to 1.0950 or lower.
A take profit order is an instruction to close your position if the market moves in your favor by a certain amount. A take profit order can help you lock in your profits and avoid losing them due to market fluctuations. For example, if you buy GBP/USD at 1.1000 and set a take profit at 1.1050, your position will be closed if the price rises to 1.1050 or higher.
For the retail traders, there are four options to set stop loss and take profit orders, depending on your trading strategy and risk appetite. Some common methods are:
- Using a fixed number of pips from your entry price
- Using a percentage of your account balance or risk per trade
- Using technical indicators or chart patterns
- Using trailing stops or dynamic take profits that adjust with the market movement as well as your current profit amount
In this article, we use X3 Chart Pattern Scanner to demonstrate how to set take profit and stop loss in Chart Pattern. X3 Chart Pattern Scanner is an automatic software that detects Harmonic Patterns, Elliott Wave Patterns and X3 Chart Patterns in just one button clicks. For example, the detectable harmonic patterns include Butterfly, Gartley, Bat, Alternate Bat, AB=CD, Shark, Crab, Deep Crab, Cypher, 5-0 Patterns, 3 Drives Pattern and so on. Elliott Wave patterns can include impulse wave pattern and corrective wave patterns that are identified with certain ratio scheme. There is no need for you to detect these chart patterns manually. In addition, you can also detect the customized chart patterns on top of these popular chart patterns. That is a great advantage as you can explore and develop the secrte chart patterns of your own that are not known to other traders if you wish.
Firstly you need to understand that take profit and stop loss are an important concept to manage your trading risk in Forex and Stock market. If you are already familiar with Harmonic Pattern, then you already know the concept of Pattern Completion Zone or Pattern Completion Interval to manage your take profit and stop loss with Harmonic patterns. The same idea goes to Elliott Wave patterns and X3 Chart Patterns. X3 Chart Pattern Scanner in MetaTrader 4 and MetaTtrader 5 is also using the risk management concept with Pattern Completion Zone for your trading. You can use the pattern completion zone to manage the odd of winning ratio in your trading. Technically, it is known as one single metrics called Reward/Risk ratio or Risk/Reward Ratio. As we descriped in the book: Guide to Precision Harmonic Pattern Trading, we prefer to use Reward/Risk ratio as a trader.
Please remember that trading without having good reward/Risk ratio is useless. They can blow your account pretty quickly. Please make sure that you understand the role of Pattern Completion Interval and how it can help for your trading. In X3 Chart Pattern Scanner, your stop loss and take profit is controlled for individual patterns. This is the main difference from Harmonic Pattern Plus and Harmonic Pattern Scenario Planner. Since X3 Chart Pattern Scanner have different categories of patterns like Elliott Wave patterns, Harmonic patterns and X3 patterns, you can apply different money management scheme if you wish.
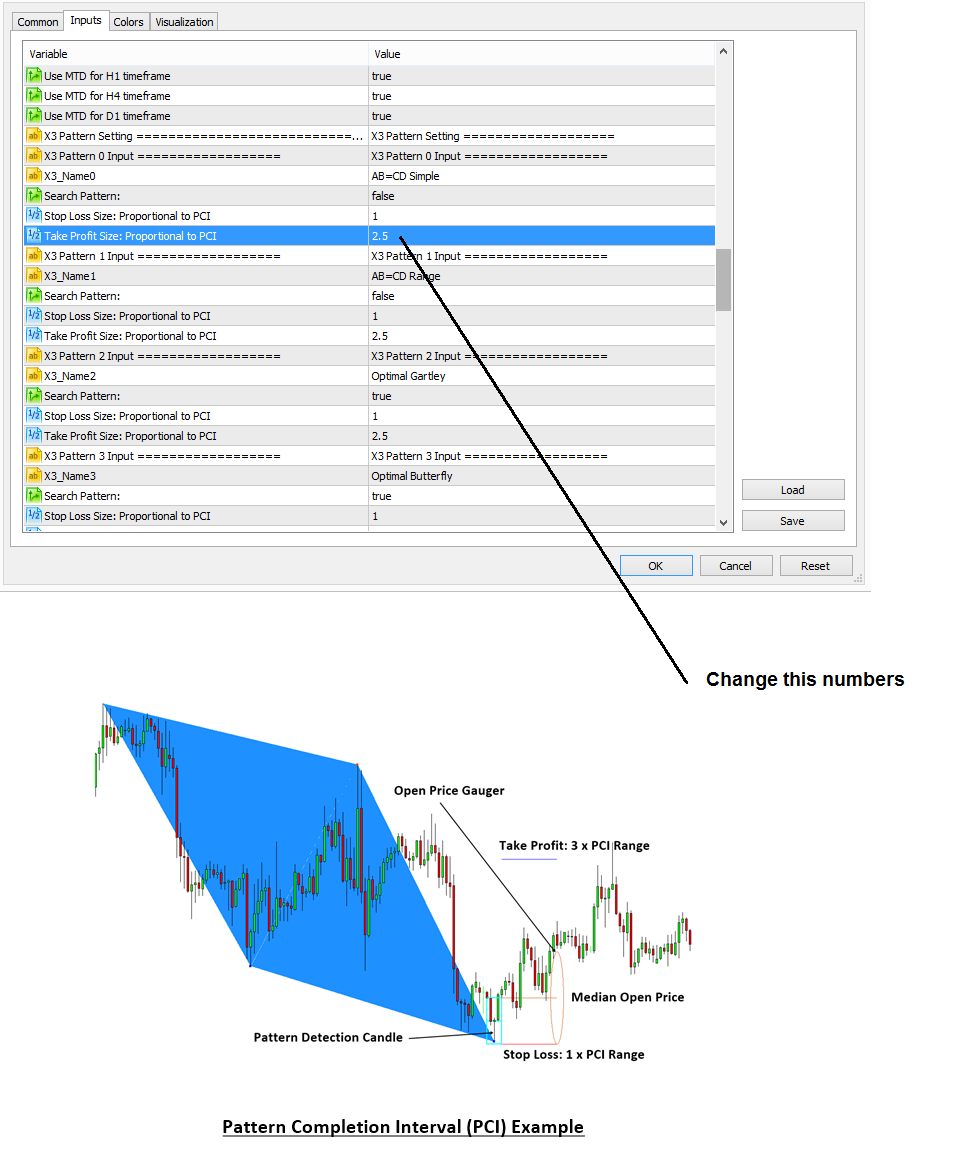
To change your stop loss and take profit, scroll down in your input. Stop Loss = 1 means that it is size of 1 x Pattern Completion Interval Box. Take Profit = 2.5 means that it is size of 2.5 x Pattern Completion Interval.
X3 Chart Pattern Scanner provide all the historical patterns, helping you to tune your strategy. Hence, please test your strategy and change your stop loss and take profit according to your observation from your chart. We have already shown you how to test your strategy with X3 Chart Pattern Scanner in another article here.
In addition, you can watch the YouTube Video to feel what is the automated harmonic pattern indicator like.
YouTube “Non Repainting Non Lagging Harmonic Pattern Indicator”: https://youtu.be/uMlmMquefGQ
Also check the screenshot for better understanding of this basic risk management concept.
https://algotrading-investment.com/portfolio-item/profitable-pattern-scanner/
https://www.mql5.com/en/market/product/41992
https://www.mql5.com/en/market/product/41993
Related Products


