Historical Chart Patterns with Chart Pattern Scanner
Historical chart pattern can be used to test the performance of the potential trading strategy or to improve the existing trading strategy in Forex and Stock market. Historical chart pattern is an important process if you want to test your trading strategy with real world market data. Chart Patterns are used by many seasoned trader to profit. Several different chart patterns include Elliott Wave patterns, Harmonic Patterns, X3 Chart Patterns and other geometric chart patterns. Elliott Wave patterns include the impulsive wave patterns and corrective wave patterns. Harmonic patterns include Butterfly, Gartley, Bat, Alternate Bat, AB=CD, Shark, Crab, Deep Crab, Cypher, 5-0 Patterns, 3 Drives Pattern and so on. X3 Chart Patterns include any chart patterns that are made up from fractal wave, it covers all the chart patterns that can be expressed with retracement and explantion ratio as mechanically as possible. Other geometric chart patterns include symmetrical triangle, ascending triangle, descending triangle, falling wedge pattern, rising wedge pattern, channel and so on. Among the above chart patterns, X3 Chart Pattern is mechanical and it is easy to generate the historical chart patterns to test your trading strategy in real world market data.
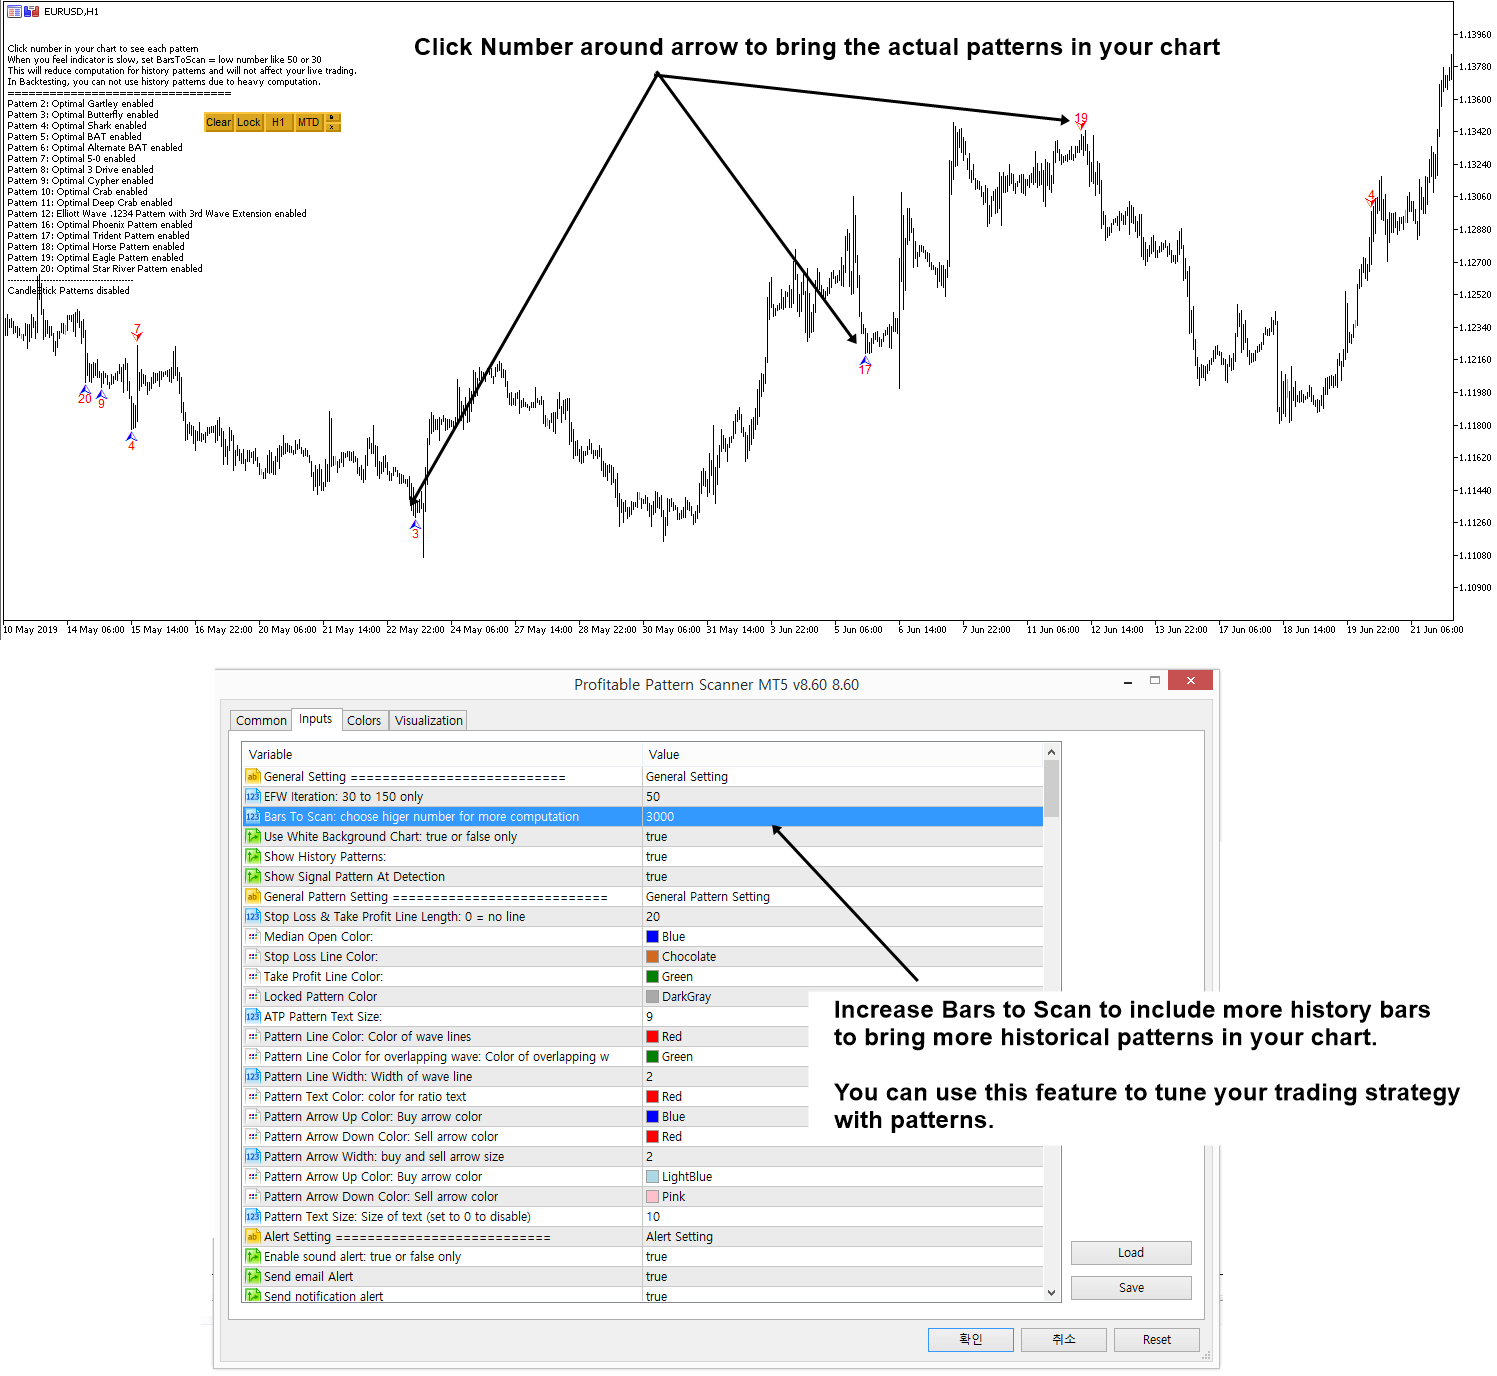
In trading, you get your profits as good as your tools and knowledge. X3 Chart Pattern Scanner is the superb Harmonic Pattern and Elliott Wave Pattern Indicator using the next generation pattern detection algorithm (The first Non Repainting + Non Lagging Harmonic pattern indicator.). To understand and to test your strategy, simply increase bars to scan to some higher number like 5000 or 10,000. Initially bars to scan is set to 250 to save some computation but you can increase as many as you can to just check your strategy. Screenshot shows how to do it.
1. Optimize your Strategy per symbol and per timeframe
As you can see, Harmonic Pattern and Elliott Wave pattern will perform differently per symbol and per timeframe. Hence, check history signals per symbol and per timeframe to optimize your strategy per symbol and per timeframe. While you are studying these patterns with Profitable Pattern scanner, you will gain more and more knowledge and skills for your trading.
2. Secondary Confirmation to improve your profits
To improve success rate, make sure that you are studying various indicators and filters together with the historical signal patterns in the scanner as secondary confirmation. In my opinion, you will gain practical knowledge within few weeks whereas other harmonic pattern trader takes typically 1 to 3 years to grab knowledge of harmonic pattern trading (and 2 to 4 years for Elliott wave trading). This is great advantage with this non repainting indicator.
3. Set Bars to Scan input = default in live trading to save computation
Another important note is that make the “Bars to Scan” input to 250 after you have finished your studying with historical signal patterns. If you leave Bars to Scan = 10,000, etc, this would be too heavy for your MetaTrader. For your live trading, set Bars to Scan = 250 or as small as possible. Since live trading results and historical signals are the same, you will not get lost anything even if you set Bars to Scan = 250 or other reasonably small number.
4. Simple and Easy to trade
Beside all this sophisticated technology running before your PC, trading with X3 Chart Pattern Scanner is easy and simple because of its non repainting features. Just study your charts and trade with what you see from your charts.
https://algotrading-investment.com/portfolio-item/profitable-pattern-scanner/
https://www.mql5.com/en/market/product/41992
https://www.mql5.com/en/market/product/41993
Related Products


