Breakout Pattern with Support and Resistance
The Breakout Pattern and Support/Resistance levels are closely related concepts in technical analysis, particularly in chart analysis within financial markets.
- Breakout Pattern: A breakout pattern occurs when the price of an asset moves above or below a significant level on the price chart, such as a trendline, channel, or horizontal support/resistance level. Breakouts are significant because they often indicate the potential for a sustained move in the direction of the breakout.
- Support and Resistance: Support and resistance levels are areas on a price chart where the price of an asset tends to find buying or selling pressure, respectively. Support is a price level where a downtrending price tends to find a floor, while resistance is a price level where an uptrending price tends to find a ceiling.
The relationship between breakout patterns and support/resistance levels is that breakouts often occur at or near these levels. Here’s how they are related:
- Breakout from Support or Resistance: A breakout pattern can occur when the price of an asset moves decisively through a support or resistance level. For example, if a stock price has been fluctuating within a range with a clear resistance level, a breakout occurs when the price moves above that resistance level. This breakout suggests that buying pressure has overwhelmed selling pressure, potentially indicating a bullish trend reversal or continuation.
- Validation of Support and Resistance: Breakouts can also serve to validate existing support or resistance levels. For instance, if a stock price consistently fails to break through a certain resistance level, but eventually breaks out above it, this breakout confirms the significance of that resistance level. Similarly, if a breakout fails to sustain itself and the price returns back into the previous range, it could indicate a false breakout, often called a “fakeout,” and the original support or resistance level remains valid.
- Targets and Stop-loss Levels: Traders often use support and resistance levels to set target prices for their trades or to place stop-loss orders to manage risk. Breakouts from these levels can signal entry or exit points for trades, depending on the direction of the breakout.
In summary, breakout patterns and support/resistance levels are interrelated concepts in technical analysis, with breakouts often occurring at or near these levels and providing valuable information to traders about potential trend reversals or continuations.
In terms of technical analysis, Price Breakout Patterns are in fact the extension of support and resistance trading. When you grab the idea of support and resistance with Price Breakout Patterns, you can really advance your trading performance. With Price Breakout Pattern Scanner, which is available in MetaTrader, this is easy task because it provide the built in support and resistance mode.
To explain the resulting breakout of triangle and wedge pattern, the top and the bottom of the triangle and wedge pattern can be treated as support and resistance. The thing is that the top and the bottom of the triangle and wedge patterns are angled lines and not the horizontal line. Therefore, they are more of diagonal support and resistance. Many textbook might teach you that support and resistance level are reversal area. However, in this book, we emphasize that support and resistance are where both reversal and breakout movement can occurs. For example, we treat support and resistance area as the price level where the price can penetrate hard or bounce back hard with high trading volume.
With diagonal support resistance lines, the effective support and resistance level changes with time. For example, the support and resistance levels move along the bottom and top of the triangle and wedge patterns as time goes. In addition, diagonal trend channels are another good example of the diagonal support resistance lines. With horizontal support and resistance line, the effective support and resistance levels are constant over time. The simplest horizontal support resistance example is the daily pivot point used by many traders. The price levels of the daily pivots are constant for one day. Next day, new daily pivot are calculated. Likewise, Fibonacci retracement levels or round numbers are another example of horizontal support resistance levels. In addition, Potential Continuation Zones from Harmonic pattern are another good example of horizontal support and resistance too.
What is the significant point about the perspective of diagonal support and resistance with triangle and wedge pattern? As we have mentioned before, triangle and wedge pattern does not answer the question of when to breakout. However, when they are combined together with horizontal support and resistance level, they are likely to provide better answer on the question. The typical good example of combining diagonal support resistance with horizontal support resistance can be illustrated combined usage of triangle and wedge pattern with Harmonic Pattern. Since the classic entry for Wedge pattern is often taken outside the wedge pattern, our entry near the D point of ABCD pattern is much faster than the classic entry. At the same time, our size of stop loss become smaller too making our Reward/Risk profile much more attractive.
Another significant point of using diagonal support and resistance come from using the multiple timeframe pattern Analysis. When we say multiple timeframe pattern analysis, we are not talking about watching many charts. We are talking about placing the triangle and wedge patterns detected from the higher timeframe and the lower timeframe in the single chart. If one can place the important diagonal support and resistance line from hourly, daily, weekly and monthly chart on the signal chart, traders can benefited from this rich information. Combing diagonal support and resistance line with horizontal support resistance line can be even more effective with multiple timeframe pattern analysis.
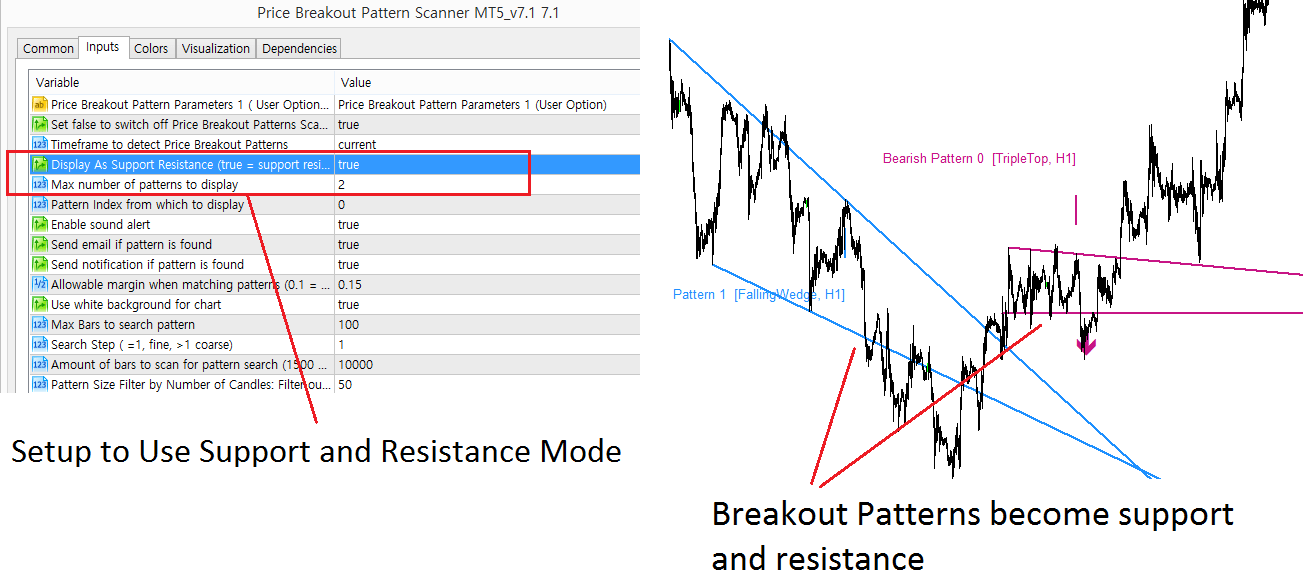
Let us have a look at the automated and extended feature of support and resistance inside the Price Breakout Pattern Scanner in MetaTrader. In the support and resistance mode, your price breakout patterns will be turned into support and resistance. In doing so, you need to set support and resistance mode in your input setting. We will show this in our screenshot.
Once this setup is in place, Price Breakout Pattern will become support and resistance for your trading. With conventional support and resistance together, this could indicate highly probable trading entry.
Below is the YouTube Video link for Price Breakout Pattern Scanner:
YouTube Video Link: https://www.youtube.com/watch?v=aKeSmi_Di2s
Below are the links to Price breakout Pattern Scanner
https://www.mql5.com/en/market/product/4859
https://www.mql5.com/en/market/product/4858
https://algotrading-investment.com/portfolio-item/price-breakout-pattern-scanner/
Related Products


