Renko Brick Size in Renko Chart
In this article, we will explain the Brick Size in Renko Chart, commonly used for technical analysis among the price action trader. The charting principle of the Renko Chart is quite different from the rest. For example, Renko chart is constructed by drawing bricks of fixed height in the price series. If the price moved up by 5 points from the top of brick, then we will draw one white up brick. Likewise, if the price moved down by 5 points from the bottom of the brick, then we will draw one black down brick. The brick will be drawn either on the top or on the bottom of the other brick always. There are some drawbacks in Renko chart too. Because Renko chart lose all time information from our candlestick chart, you are no longer able to compare your normal candlestick chart to your Renko chart. In addition, unlike the candlestick chart, you have to select the sensible height of brick. Since there are many benefits using Renko chart, some traders are never worried about these disadvantages. Overall, Renko chart provide quite a lot of features which other chart does not provide. Let’s discuss a fact by fact in details about the Renko Chart.
Renko charts are a type of chart used in technical analysis to display price movements in a simplified manner. Unlike traditional candlestick or bar charts, Renko charts are based solely on price movements and not on time. Renko charts are constructed using “bricks” or “blocks” instead of bars or candlesticks. Each brick represents a certain price movement.
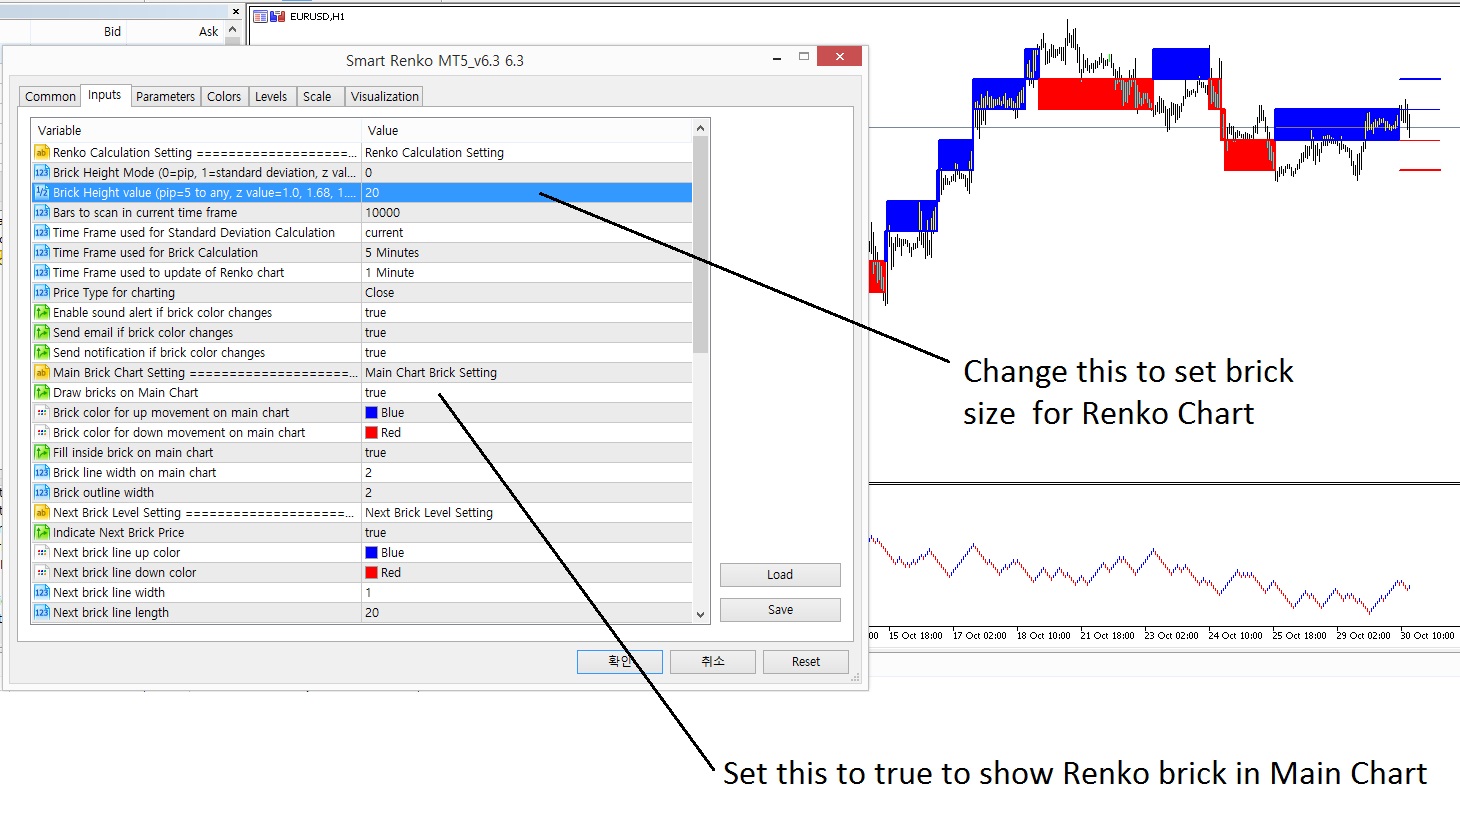
The size of the Renko bricks, known as the “Renko brick size,” determines the sensitivity and granularity of the chart. The Renko brick size is fixed and predetermined by the user based on their trading strategy, preferences, and the volatility of the asset being analyzed.
Here’s how Renko charts work:
- Brick Creation: A new brick is drawn on the chart only when the price movement exceeds the predetermined brick size. For example, if the brick size is set at 10 points and the price moves up by at least 10 points, a new brick is drawn in the upward direction. If the price moves down by at least 10 points, a new brick is drawn in the downward direction.
- No Time Factor: Renko charts do not have a time axis. Time is not considered when drawing Renko bricks. This means that a new brick is only drawn when the price movement meets the predetermined criteria, regardless of how much time has passed.
- Trend Identification: Renko charts are often used to identify trends more clearly by filtering out minor price movements or “noise.” Since Renko charts only show significant price movements, they can help traders focus on the overall trend direction without being distracted by minor fluctuations.
- Customization: Traders can customize the brick size according to their trading style and the volatility of the market. A smaller brick size will result in more bricks being drawn, capturing smaller price movements, while a larger brick size will result in fewer bricks being drawn, capturing larger price movements.
- Trading Signals: Trading signals on Renko charts are typically generated when the price breaks above or below the previous brick. For example, a bullish signal is generated when a new brick is drawn above the previous brick, indicating an upward trend, while a bearish signal is generated when a new brick is drawn below the previous brick, indicating a downward trend.
Overall, the Renko brick size plays a crucial role in determining the effectiveness of Renko charts in analyzing price movements and identifying trading opportunities. Traders often experiment with different brick sizes to find the optimal setting for their specific trading strategies and preferences.
Renko bricks are much more concise than candlestick chart. For example, 100 candlesticks can be transformed into only 52 Renko bricks or less in some cases. However, during this transformation, we are losing time information of our candlestick chart. Another important point you can observe here is that the Renko chart provide much smoother and readable visualization representation of trend. This is because the equal height of Renko brick reduces a lot of noise present in candlestick chart. With Renko Brick chart, it is much easier to identify trend and reversal patterns.
In Renko Chart, Renko brick size is the most important control variable in your trading. You have a choice of brick size. However, it is typically recommended to use multiple of 10 or 5 as the choice. For example, you can use following brick size depending on the size of price range in your chart.
Recommended brick size: 20 pips, 25 pips, 50 pips, 100 pips, 200 pips, 2000 pips, 20000 pips, etc.
If you have a math background and if you do understand standard deviation, it is good to guess these numbers around 1 standard deviation. This is just some idea for your trading.
For some futures, commodities, Stock price, you need to have 1 or 2 more zeros in your brick size in comparison to Forex market. Just do some experiment to find the suitable and sensible brick size for your trading.
This Renko tools are available in both Smart Renko and Price Breakout Pattern Scanner. Hence this article applies to Smart Renko and Price Breakout Pattern Scanner.
For MetaTrader 4 users, to calculate bricks, you have to download historical data before using our Smart Renko chart.
* Below is link to Smart Renko
https://www.mql5.com/en/market/product/9911
https://www.mql5.com/en/market/product/9944
https://algotrading-investment.com/portfolio-item/smart-renko/
* Below is link to Price Breakout Pattern Scanner
https://www.mql5.com/en/market/product/4859
https://www.mql5.com/en/market/product/4858
https://algotrading-investment.com/portfolio-item/price-breakout-pattern-scanner/
Related Products


