Steps for Winning Day Trading
In this article, we will cover four steps to make a good buy and sell decision in Forex and Stock trading using the technical analysis. We will explain you how to use the chart pattern analysis to profit in four steps.
Patterns are the great way to trade for Forex and Stock market because it provides you the near mechanical signal. At the same time, how the patterns are generated is transparent and scientific. Most importantly, good patterns allow you to reproduce your profits. Many people are scared to use black box system like trading robots or expert advisors because they do not understand what is going on inside their algorithm. In this aspect, you can trade with patterns with full confident because you trade with what you see. On top of that, these price patterns are the fastest indicator for turning point detection. No other indicator can provide us the hint of turning point like these patterns. Other trend indicator and oscillators are not designed to pick turning point. Hence, they provide signal always behind these patterns past the turning point. Hence, it is good to use these price patterns as primary tool and to use other technical indicator for secondary tool. That way you can connect the turning point with momentum, which is the next phase of trend after birth of new trend.
Another advantage is that patterns are easy to be combined together with other type of analysis whether they are fundamental or technical. Trading performance will be improved when you add secondary confirmation in your trading decision. In your choice of secondary confirmation, you can use both technical and fundamental techniques. Both technical and fundamental analyses have their own pros and cons. Here we provide a brief overview on technical indicators and fundamental analysis as secondary confirmation.
Technical indicators are the simplest form of secondary confirmation. Nowadays, most of trading or analytical platform will provide over hundreds of technical indicators. Hence, you have many choices. However, most of time, we will be using few of these only because some of them are similar and redundant. We provide some basic secondary confirmation techniques here to get going with your trading. These are mostly the basic options for your choice. The listed secondary confirmation techniques here never meant to be exhausted list. You can always use more advanced technical indicator in a ways that is more creative.
Oscillator Indicators that technically identify overbought and oversold area can be useful secondary confirmation. For example, Relative Strength Index (RSI) and Commodity Channel Index (CCI) are the popular tools of many traders. You could apply overbought conditions of these indicators together with bearish pattern.
You can also apply oversold condition with bullish pattern.
In addition to Oscillators, Bollinger Bands can be also used together as the basic secondary confirmation. You can use Bollinger bands to identify the possible overbought and oversold area to predict the turning point with the patterns.
Sometimes the overbought and oversold confirmation of technical indicators including the oscillators and Bollinger bands can lag behind the patterns. For example, you can have the buy signal from the patterns but the technical indicators may not reached the oversold condition yet. This often happens because averaging algorithm inside the technical indicator makes them less responsive on some of the price movement. Therefore, we do recommend using technical indicators with some caution.
Support and Resistance can be another good source of secondary confirmation techniques. You can use both geometric and numerical support and resistance techniques for the purpose. Geometric support and resistance are those created by connecting peaks and troughs in chart. Numerical support and resistance techniques are those levels calculated by numerical calculations like round number levels and pivot levels, etc. Since support and resistance do not use any averaging algorithm, we do not have to concern about the lagging problem. Bearish patterns appears around the important resistance level have good success rate. Likewise, bullish patterns appears around the important support level have good success rate too.
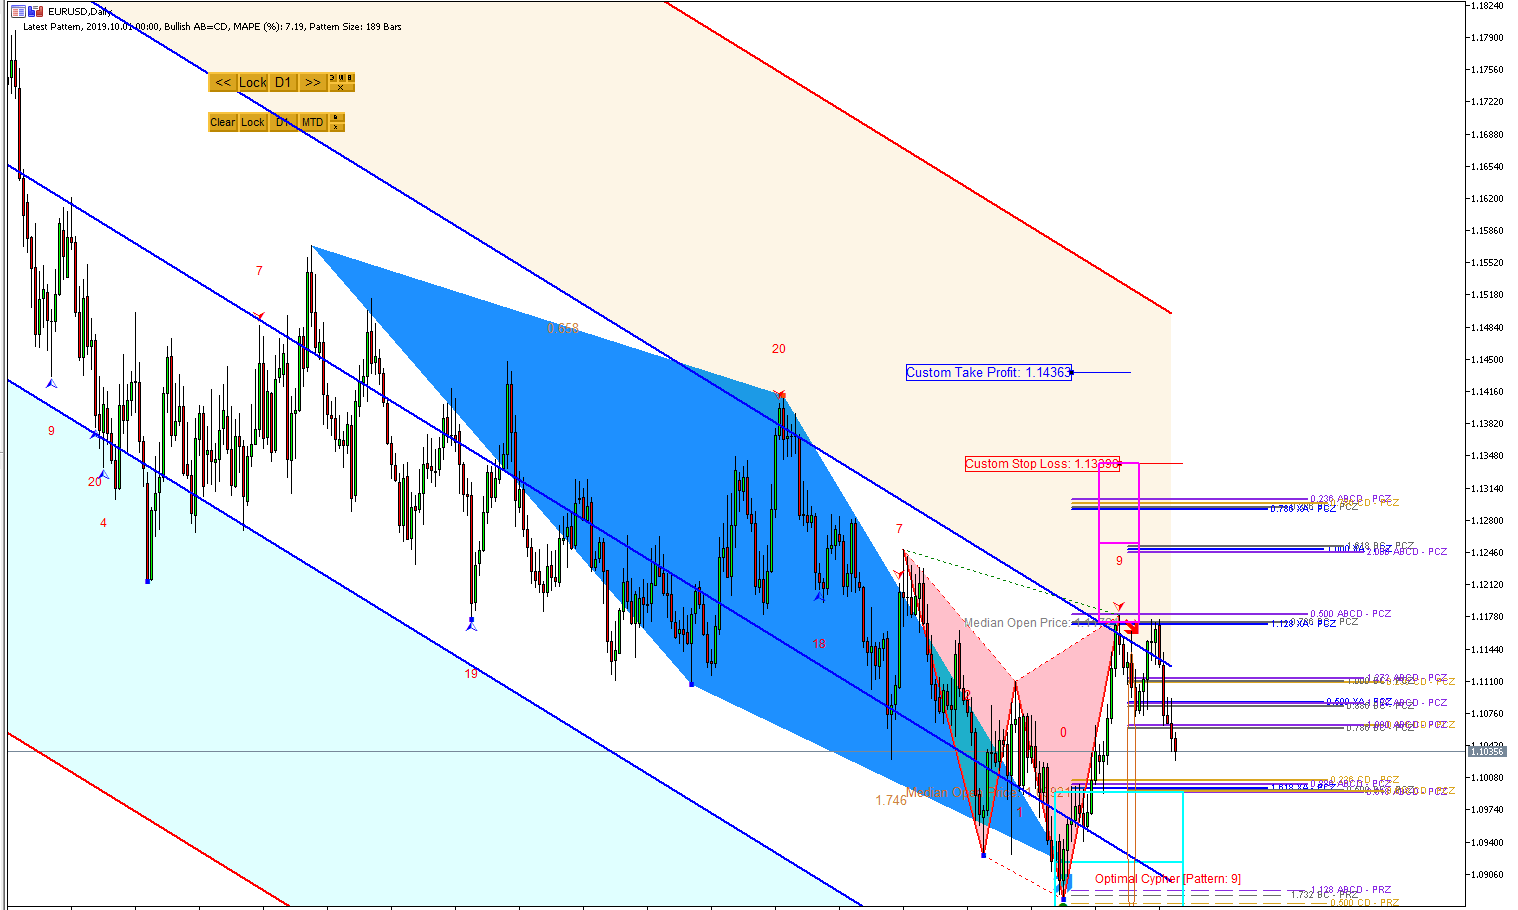
Lately, we have developed the new technique called Double Standard Deviation Channel. Double Standard Deviation Channel expands the standard deviation channel with two custom standard deviation values. Double Standard Deviation Channel works well to support the trading decision for Harmonic patterns and X3 patterns. Firstly, Double Standard Deviation Channel helps to measure some extreme price movement before harmonic pattern and X3 pattern formation. Secondly, Double Standard Deviation Channel separates price diagonally with good space. This helps us to generate good breakout level to be used together with the signal of Harmonic patterns and X3 patterns.
In addition to the technical indicators, other statistical analysis and other price pattern analysis can be used as secondary confirmation. For example, supply and demand zone, triangle and wedge patterns, market volatility analysis, and correlation analysis are also a great secondary confirmation to go with these profitable patterns introduced in this book. However, we will not go deeper with all these techniques in this book. For your information, other two books might be helpful on this topic of secondary confirmation.
• Guide to Precision Harmonic Pattern Trading
• Scientific Guide to Price Action and Pattern Trading
Now we will continue to describe some fundamental analysis as part of our secondary confirmation tool. There are both quantifiable fundamentals and non-quantifiable fundamentals. In this book, we will focus on quantifiable fundamentals mostly.
In previous chapter, we have explained that price tends to close the gap between the price and fundamentals when price is deviated too much from fundamentals. In fact, this is the underlying force behind the zigzag movement of price path as well as high impact news in the financial market. This is the underlying mechanism behind the formation of the profitable patterns introduced in this book. In technical terms, this states that price is constantly fluctuating around the fair value derived from the fundamentals. Graham (2009, The Intelligent Investor) describes the concept of “margin of safety”. In his definition, margin of safety is the gap between price and value. This suggests that the wider the gap between price and value, you have the greater the safety level in your buy and sell decision. When you have wider the gap, it can absorb any mistakes in our buy and sell decision. Hence, when you are combining fundamental analysis with profitable patterns, it is advised that you will be looking for wider gap between price and fair value. Here is the list of fundamentals that can drive stock price. Of course, this list is meant to be the basic guideline for your trading and not the exhausted list. We present this list because they are freely available from many of financial information source freely.
P/E ratio is the relative value of a company’s share based on its earning potential. Its mathematical formula is like below:
Price-to-Earnings Ratio (P/E) = Current Stock Price /Earning Per Share
P/E ratio can be used for two purpose. Firstly, P/E ratio can be used to compare the value of each stock in an apple-to-apple comparison. Secondly, P/E ratio can be used to compare a company against its own historical performance over time. When you applying P/E ratio, it is important that you want relative comparison with other companies or its own performance comparison over the time. When you use P/E ratio across different company’s stock price, higher P/E ratio anticipate higher growth in the future. Companies that have negative earning do not have P/E ratio. When you use P/E ratio to compare its own historical performance, P/E ratio can fluctuate over time. Price will fluctuate to close the gap between P/E ratio and price.
Price Earning to Growth ratio (PEG) ratio is more enhanced version of P/E ratio. The formula to calculate PEG ratio is like below:
PEG Ratio = Price-to-Earnings Ratio/Earning Per Share Growth (Estimated)
To calculate PEG ratio, you need to calculate P/E ratio first. Then you need to find the expected growth. Expected growth is estimated value and you can obtain them from some financial website. Since PEG ratio account for the potential growth rate, it covers the weakness of P/E ratio. For example, a low P/E ratio might make a stock look like a good buy. However, the company’s growth rate may tell a different story. In fact, a stock with a low P/E ratio can have a lower growth rate too (i.e. higher PEG ratio). Hence, you might pay less on P/E ratio but you might pay more on PEG ratio.
Price-to-Book (P/B) Ratio is another important fundamental used by investors. The formula for P/B ratio looks like below:
Price-to-Book Value Ratio = Current Stock Price / Book value per share, where the book value per share is a firm’s assets minus its liabilities, divided by the total number of shares.
Book value is an accounting metrics. It is calculated as total asset minus intangible assets and liabilities. Hence, you can see P/B ratio as the snap shot of market valuation of a company. As with P/E ratio, P/B ratio can be used to compare the value of each stock in an apple-to-apple comparison and to compare a company against its own historical performance over time.
Debt to Equity (D/E) ratio is rather different metric from previous metrics. D/E ratio is calculated by dividing a company’s total liabilities by its shareholder equity as shown below:
Debt-to-Equity Ratio = Total Liabilities / Total Equity
D/E ratio is used to evaluate a company’s debt. Since each industry has the different capital need and looking for different financial leverage, D/E ratio is more suitable to compare its value across the similar industry only. For example, using D/E ratio, you can not compare car manufacturing company to an internet marketing company. While car-manufacturing company requires huge factory to start with, internet-marketing company may not need huge capital like that. Hence, it is better to use D/E ratio within industry. You can use D/E ratio to analyse its own historical average. Typically, when D/E ratio is too high over historical average, the relative merit of stock can be reduced. However, before jumping into conclusion, we need to find out the reason why they need an additional debt first. Because some debts come from good investment, sometimes, stock price can go up with higher D/E ratio.
Return on equity (ROE) is a measure of how much profit a company generated with the money shareholder invested. The formula to calculate ROE is like below:
Return On Equity = Net Income/ Average Shareholder’s Equity, where Net income = the amount of income, net of expense, and taxes
This is the typical business metric helping us to check how good company is doing. If ROE is negative, the company is not making profit. If ROE is between 5 to 10%, the company is considered doing ok. If ROE is between 10 to 20%, the company is considered doing better. If a company achieves high ROE with low leverage, this is the indication of good business. If a company achieves high ROE with high leverage, this is the indication of aggressive business. Buying stock of this sort of company can provide you high return but high risk. If a company have low ROE with low leverage, this indicates that a company is running slowly. If a company have low ROE with high leverage, this indicates that a company is not doing well.
In Forex market (i.e. currency market), fundamentals affecting currency move is mostly macro-economic variables. Macro-economic variables are the long-term mover of forex and stock market. Typically, it is better to have your trading direction aligned with these macro-economic variables when you are a swing trader holding your position for few hours to some days.
Several important macro variables are actively used by currency trader to gauge the health of economic state of country. Here is the list of fundamentals that can drive currency price. These macro-economic variables can affect the stock market performance too. Please note that these are only meant to be the basic guideline for your fundamental analysis.
Interest rate is the most important driver of a domestic currency value. A government will use interest rates to control growth and inflation of national economy. If there is low growth, then they will cut down interest rates to stimulate spending and economic activity. When there is high growth, a government can increase the interest rate to reduce the inflationary pressure. Typically, higher interest rate will increase the currency value because higher interest rate attracts foreign investors increasing demand for currency. Likewise, lower interest rate will decrease the currency value because lower interest rate is unattractive for foreign investment decreasing demand for currency.
Unemployment rate is an important of economic variable for currency trader. The unemployment rate measures unemployed individuals looking for work as a percentage of the total work force. Rising unemployment is typically a leading indicator of a bad economy. If unemployment rate increases, then then typically stock market price will go down and the value of domestic currency will go down too. Likewise, if unemployment rate decrease, then typically stock market price will go up and the value of domestic currency will go up too.
Gross Domestic Product (GDP) is another economic variable that is concerned by currency and stock market trader. Gross domestic product is simply the total market value of all goods and services produced in a country. The Gross National Product (GNP) is similar to GDP but includes a country’s net earnings from abroad. Higher GDP serves as evidence of growth in national economy whereas lower GDP serves as evidence of contraction. The problem of using GDP and GNP in our trading is that they can be easily predicted by market due to the components that make up the figures. Hence, trader tends to play on GDP/GNP when there is large variation from the expected values. For example, if GDP/GNP was released unexpectedly high, then this tends to increase currency value. Likewise, if GDP/GNP was released unexpectedly low, then this tends to decrease currency value.
Besides checking out the secondary confirmation, whether they are technical or fundamental, we still need to understand the surrounding market condition for the instrument we want to trade. For example, Brexit, the withdrawal of the United Kingdom (UK) from the European Union (EU), is the great example for surrounding market condition. When a country or a company is facing the reformation of its structure, this would naturally create some turbulence in and out of the market. Typically, surrounding market conditions are created by people or organization. For example, new market condition could be set by national bank or government for the case of currency market. Likewise, new market condition for a company’s share price could be set by CEO or senior manager, senior engineer, or some other staffs. Sometimes, people could make new market condition on their own will. For example, Brexit was opted after voting in referendum. This has affected the exchange rate of British pounds against other currencies in the market. Hence, it was people, who created entirely new market condition for British pounds. In addition, good and bad scandal can affect the market condition too. Some scandal might be small and less influencing. You might ignore them. However, some scandal could shake up the market like earthquake. For example, the emission scandal from Volkswagen blown up nearly a quarter of its market value after they admitted to cheating on U.S. air pollution tests for years. Not only Volkswagen lost their value in the stock price but they also lost trust from people.
In summary, we have briefly discussed the secondary confirmation tools to go with the price patterns introduced in this book. For secondary confirmation, both technical and fundamental analysis can be used. On top of secondary confirmation, we still need to watch out many human factors around the market because they can create entire new market condition for the financial instrument we want to trade. Based on our discussion, applying the price patterns for your trading can be summarized into this four steps.
1. Detect Price Pattern for potential turning point prediction
2. Check with Secondary Confirmations
3. Understand surrounding market condition
4. Make the entry with risk management
With these four steps together, the next thing you need is a good tool to trade with.
Link to Harmonic Pattern Plus
https://www.mql5.com/en/market/product/4488
https://www.mql5.com/en/market/product/4475
https://algotrading-investment.com/portfolio-item/harmonic-pattern-plus/
Link to X3 Chart Pattern Scanner
https://www.mql5.com/en/market/product/41993
https://www.mql5.com/en/market/product/41992
https://algotrading-investment.com/portfolio-item/profitable-pattern-scanner/
Related Products


