Profitable Chart Patterns Explained
Profitable chart patterns refer to recognizable patterns that appear on price charts, indicating potential trading opportunities for profit in the financial market. These patterns are derived from the analysis of historical price movements and are based on the premise that price action tends to repeat itself due to human psychology and market dynamics. Here are some of the most common profitable chart patterns in forex trading:
- Gartley Pattern: The Gartley pattern is named after H.M. Gartley and is one of the earliest harmonic patterns identified. It consists of four price swings, forming specific Fibonacci ratios. The pattern typically resembles an “M” or “W” shape and indicates potential trend reversals. The key Fibonacci ratios involved are 0.618 and its inverses.
- Butterfly Pattern: The butterfly pattern is similar to the Gartley pattern but has more stringent Fibonacci ratios. It is characterized by a sharp reversal point that marks the completion of the pattern. The pattern resembles the wings of a butterfly and consists of three legs. The critical Fibonacci ratios involved are 0.786 and 1.272.
- Bat Pattern: The bat pattern is another variation of the Gartley pattern with tighter Fibonacci ratios. It typically forms after a significant price move and indicates potential reversal points. The pattern consists of four legs and resembles the shape of a bat’s wings. The key Fibonacci ratios involved are 0.886 and 0.886 of XA leg.
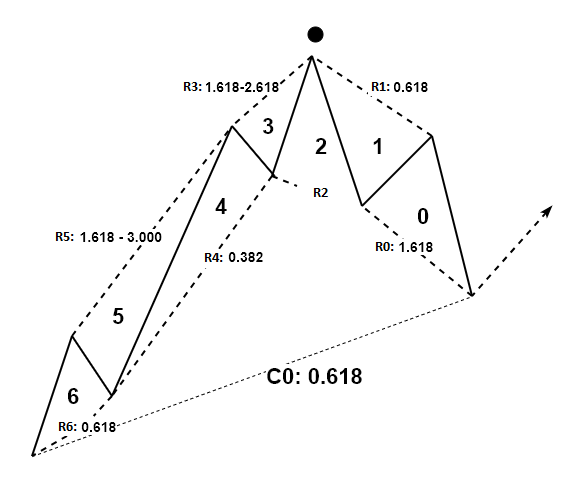
- Crab Pattern: The crab pattern is one of the most precise harmonic patterns and has the most stringent Fibonacci ratios. It is characterized by deep retracements and sharp reversals. The pattern consists of five legs and is often seen as a reversal signal at extreme market points. The key Fibonacci ratios involved are 0.382, 0.618, 1.618, and 2.618.
- Shark Pattern: The shark pattern is relatively rare but is known for its accuracy when it does occur. It is characterized by deep retracements against the prevailing trend and indicates potential trend continuation rather than reversal. The pattern consists of five legs and is defined by specific Fibonacci ratios. The key Fibonacci ratios involved are 0.886, 1.13, 1.618, and 2.24.
- Head and Shoulders: This is a reversal pattern that typically indicates the end of an uptrend. It consists of three peaks – a higher peak (the head) flanked by two lower peaks (the shoulders). The neckline connects the lows of the two shoulders. When the price breaks below the neckline after the formation of the right shoulder, it signals a potential downtrend.
- Double Top and Double Bottom: These are reversal patterns that form after a prolonged trend. A double top consists of two peaks at approximately the same price level, separated by a trough. Conversely, a double bottom consists of two troughs at approximately the same price level, separated by a peak. A breakout below the neckline in a double top or above the neckline in a double bottom confirms the reversal.
- Flags and Pennants: These are continuation patterns that occur after a strong price movement. Flags are rectangular-shaped patterns that slope against the prevailing trend, while pennants are small symmetrical triangles. Both patterns signal a brief consolidation before the prevailing trend resumes. Traders often enter positions in the direction of the breakout from these patterns.
- Triangles: Triangles are consolidation patterns characterized by decreasing volatility and converging trendlines. There are three main types of triangles – ascending, descending, and symmetrical. Ascending triangles have a flat top and a rising bottom trendline, while descending triangles have a flat bottom and a descending top trendline. Symmetrical triangles have converging trendlines with similar angles. Breakouts from these patterns can signal continuation or reversal depending on the prevailing trend.
- Cup and Handle: This is a bullish continuation pattern that resembles the shape of a tea cup. It consists of a rounded bottom (the cup) followed by a smaller consolidation (the handle). The breakout from the handle confirms the continuation of the uptrend.
- Wedges: Wedges are consolidation patterns characterized by converging trendlines that slant either upward (rising wedge) or downward (falling wedge). Rising wedges typically signal a bearish reversal, while falling wedges often indicate a bullish reversal. Breakouts from the boundaries of the wedge pattern confirm the direction of the subsequent price movement.
These chart patterns are not foolproof and should be used in conjunction with other technical analysis tools and risk management strategies. Additionally, it’s essential to consider the broader market context and fundamental factors when trading forex.
Profitable Chart Pattern is the pattern that are used to predict the movement of the financial market, which in turn used for buy and sell decision making. In this article, we will talk about two important things about Profitable Chart Patterns like:
- How they are connected with price in Financial market
- How they can help you to get profit in Forex and Stock market
Price is the data recorded by financial exchange. The financial exchange distributes this real time price to trader electronically during market hours. Then trader will make buy or sell decision depending on their perception of the latest price and the market condition. If they feel the price is low, then they will buy the currency or stock. If they feel price is too high, then they will sell the currency or stock. One thing we need to know is that diversified reactions exists about good buying and selling price. We can have millions of different opinions about 200 dollar stock price for Facebook today. Some people will think that 200 dollar is good price to buy and some people will think the opposite. Some people might be neutral. Next price of Facebook will be determined by trading volume of buy and sell orders. If buy-trading volume is dominating over the sell-trading volume, then price will go up. If sell-trading volume is dominating over the buy-trading volume, then price will go down. You can think that each price recorded is in fact the record of the crowd reaction.
For our analysis, financial exchange also records the series of price in regular time interval like hourly, daily, or weekly, etc. Sometimes they record tick-by-tick data. They electronically store these historical data and distribute them to trader. Then trader uses these historical data to draw chart for further analysis of the price. In modern electronic trading environment, it is very rare to make buy and sell decision without looking at chart even for fundamental trader. Price series contain complex information. If we want to find out any useful information from price series, then we need to work backwards from price series into whatever information we need to seek. Extracting useful information from price series typically requires some mathematical tools.
Depending on what is our question, we need to apply different tools to exam price series. For example, if you want to know the common statistics for Facebook stock price, then you can calculate the mean, median, and standard deviation of the price series. If you want to find out good cycles to trade, then you need to apply Fourier transformation or some sort, to extract the cycles of Facebook price series. If you want to find out overbought and oversold area, then you can apply some technical indicators like Relative strength index, Commodity Channel index, etc. Likewise, if we want to find out profitable patterns, then we need to apply Peak Trough transformation or some sort to the price series. When we apply Peak Trough Transformation, we turn price series into the infinitely repeating triangles, which are called Fractal wave. Typically, Zig Zag indicator and Renko chart are used to turn price series into fractal wave.
Fractal or Fractal wave is commonly observable in nature like in snowflake, in tree leaves, in heartbeat rate, and in coastal line. Hence, many traders believe that identifying profitable patterns in price series are the same as spotting natural order or regularity. By definition, Fractal wave is infinitely repeating self-similar patterns in time domain. The main regularity in Fractal wave is the shape of the pattern. Typically, this shape of pattern is referenced for some geometric shapes like triangle, circle, square, etc. In Fractal wave, we can have both strict self-similar and loose self-similar patterns. If the repeating patterns have the same geometric shape and all individual patterns have matching parameters in that shape (i.e. ratio of width to height in rectangle or angles of triangle), we call this as strict self-similarity. If repeating patterns have the same geometric shape but majority of individual patterns have non-matching parameters in that shape, then we call this as loose self-similarity. Fractal wave in Forex and Stock market price series have triangle as the geometric shape. However, individual triangle can be wider, narrower, longer, and shorter than other triangles. Hence, Fractal Wave in Forex and Stock market data possess the loose self–similarity. Loose self-similarity does not mean that all the triangles are non-identical in shape. Even in loose self-similarity, we can have some triangles in identical shape or at least within allowed range in precision.
First important characteristic of fractal wave is the infinite scales. In theory, repeating triangles in forex and stock market can have infinite variation of scales from very small to extremely large triangles. For example, one day we can observe one triangle formed in thirty seconds but another triangle in same shape can be formed in thirty days. In our pattern study, scale is an independent factor. As long as triangles are identical in shape, or within allowed range in precision, triangle formed in thirty seconds is treated as identical to the triangle formed in thirty days, regardless of their size. For some practical example, Fibonacci price pattern with 61.8% retracement formed in twenty-candle bar in hourly timeframe is an identical pattern to the other 61.8% retracement pattern formed in thirty six candle bar in daily timeframe. Hence, we use Fibonacci price pattern with 61.8% retracement to make buy and sell decision across all timeframe.
Second important characteristic about Fractal wave pattern is that many small pattern are jagged together to make a bigger pattern. For example, in triangular fractal wave as in financial market, one bigger triangle can be formed from many small triangles. In our pattern study, we often seek this sort of jagged patterns for our trading opportunity. Especially, in Harmonic pattern, Elliott Wave patterns, and X3 patterns, this sort of jagged pattern are commonly utilized to find the profitable patterns with good success rate.
Each Profitable Chart Pattern has its own pattern structure recognizable by trader. Typically, the pattern detection process involves to identify certain swing high and swing lows as well as retracement and expansion in your chart. Here is one article providing you the through pattern detection logic behind the Profitable Chart Pattern. Article can be found in webpage and pdf version from link below.
- X3 Pattern Framework for the Day Trader in the Financial Market
- WebPage: https://algotrading-investment.com/2019/11/20/x3-pattern-framework-for-the-day-trader-in-the-financial-market-2/
- PDF: https://algotrading-investment.com/2019/11/17/x3-pattern-framework-for-the-day-trader-in-the-financial-market/
We do have some automated tools in detecting these profitable patterns for Forex trading and Stock trading too. Below are the links to the two of these automated pattern detection indicator for your trading designed in Metatrader 4 and MetaTrader 5 platform.
Harmonic Pattern Scenario planner
https://www.mql5.com/en/market/product/6240
https://www.mql5.com/en/market/product/6101
https://algotrading-investment.com/portfolio-item/harmonic-pattern-scenario-planner/
X3 Chart Pattern Scanner
https://www.mql5.com/en/market/product/41993
https://www.mql5.com/en/market/product/41992
https://algotrading-investment.com/portfolio-item/profitable-pattern-scanner/
In addition, you can find the book explaining some basics of these chart patterns. Below are the links to the book: Profitable Chart Patterns in Forex and Stock Market: Fibonacci Analysis, Harmonic Pattern, Elliott Wave, and X3 Chart Pattern. It is available from major book distributors.
Link to Book 1: https://play.google.com/store/books/details?id=7KrQDwAAQBAJ
Link to Book 2: https://books2read.com/u/m0rgOW
Related Products


