X3 Pattern Framework for the Day Trader in the Forex and Stock Market
Fast Track Learning for all Chart Patterns
Author: Young Ho Seo
Financial Trader, Engineer, and Quantitative Developer
www.algotrading-investment.com
Please note that this is the bonus chapter of the Book: Scientific Guide to Price Action and Pattern Trading (Subtitle: Wisdom of Trend, Cycle, and Fractal Wave) by Young Ho Seo. For the complete learning, we do recommend to read the original book.
1. Overview on Price Patterns in the Financial Market
Many traders are using patterns to trade on Forex, Stocks, and Futures market every day. Patterns are the scientific evidence and record of underlying dynamics of the financial market. The value of the price patterns to the Scientific Trading Community is more than just profitability. With the increased interest in price patterns for every day trading, there is a need for comprehensive and scientific pattern framework. At the same time, the pattern framework must be easy enough for average trader or average people to understand. The purpose of this article is to provide the convenient and intuitive pattern framework to overcome the limitation of existing pattern framework. We will show you short but comprehensive pattern framework, which can be used to create a detailed analysis in forex and stock market trading.
2. Why Do We Need New Pattern Framework for day trading?
Firstly, price patterns in the financial market are not bounded by 4, 5 or 6 points only. The price patterns can have 10 or 15 points also or even more. They can come in various shape and in various complexity. For the time being, the community do not have intuitive and flexible pattern notation to adapt these new and more complex patterns for the future use. Most of them assume the fixed points for their patterns. For example, Elliott Wave theory uses the 12345 or ABC notation. For example, Wave .12345 and Wave .ABC patterns respectively consists of six points and four points. Likewise, Carny (1998) and Pesavento and Shapiro (1997) used XABCD notation for harmonic patterns. Many harmonic patterns consist of 4 to 6 points using XABCD notation. Either the XABCD notation or the 12345 notation is limited to describe patterns that are more complex.
Secondly, price patterns are not bounded by Fibonacci ratios only. The price patterns can come from the domain of non-Fibonacci ratios as we have shown using EFW Index Distribution. We can definitely tell the Fibonacci ratio are good starting point but we have seen that price patterns can be tuned outside the Fibonacci ratio for better profitability. For example, a profitable pattern can possess 1 or 2 Fibonacci ratios but rest of ratios can be filled with non-Fibonacci ratios. We never know about this possibility.
Thirdly, as we have shown, the basic building block of the Fractal geometry is triangle in the financial market. The building block of the 12345, ABC and XABCD notation is the line instead of the triangle. I personally believe that pattern framework, using triangle building block, will provide the shortcut to many scientific discovery and to improved trading strategies.
Based on these three reasons, we introduce new flexible pattern framework with good expandability for the scientific purpose and trading use. Since our pattern framework uses the triangle as the building block, we call our new pattern framework as X3. Of course, the entire purpose of creating this new X3 pattern framework is to have the “Quantum Leap” in our scientific knowledge on the financial market and the crowd behaviour. As a result, this will help us to predict the financial market better.
3. How the X3 Pattern Framework is different from other Approaches
Before, many pattern frameworks including Elliott Wave theory or Harmonic Pattern and others used the points and lines to describe the patterns. In our new framework, we use a triangle to describe the patterns to provide the shortcut to understand them. We found that using triangle gives an unlimited flexibility to describe any simple and complex patterns with the shortest possible description. Meaning of X3 is the triangle, which is made up from 3 points. Another important point is that the X3 notation makes the extensive use of retracement ratio and expansion ratio. The retracement and expansion ratios are commonly used by Fibonacci trader and swing trader. Hence, X3 pattern framework is really the natural evolution of trading language based on what traders have built in the past. As you read this article, you would pick up all the essential elements of price pattern structure without too much hassle if you have at least studied any swing trading or Fibonacci trading methods.
4. Defining Profitable Patterns with Retracement and Expansion Ratio
X3 pattern framework is heavily relying on our previous research on Equilibrium Fractal Wave. Equilibrium Fractal Wave (EFW) is simply a triangle shaped wave repeating while price is moving towards the equilibrium price. This is an opposing concept to the Stationary Fractal Wave, which is always trying to revert to its mean. To someone less familiar with EFW, simply consider one EFW as one triangle made up from 3 points. However, we only consider the four types of triangles as shown in Figure 4-2. You have to understand that we do not concern all different types of triangle here. In theory, there is some difference between triangle and Equilibrium Fractal Wave. However, just to get you the intuition, we will often call one EFW as one triangle interchangeably in this book.
EFW is the building block of trend and fractal wave patterns in the financial market. Technically, we can use the peak trough transformation to transform the price series into EFWs. Some common peak transformation algorithms are found inside ZigZag indicator and Renko charts. These tools can be accessed by most of people free of charge nowadays.
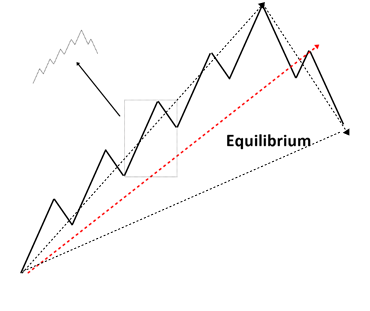
Figure 4-1: Equilibrium Fractal Wave propagation in the financial market.
While price is moving towards the equilibrium price, EFW can have four shapes in general. Most of patterns in the financial markets can be achieved by combining any of these four shapes.
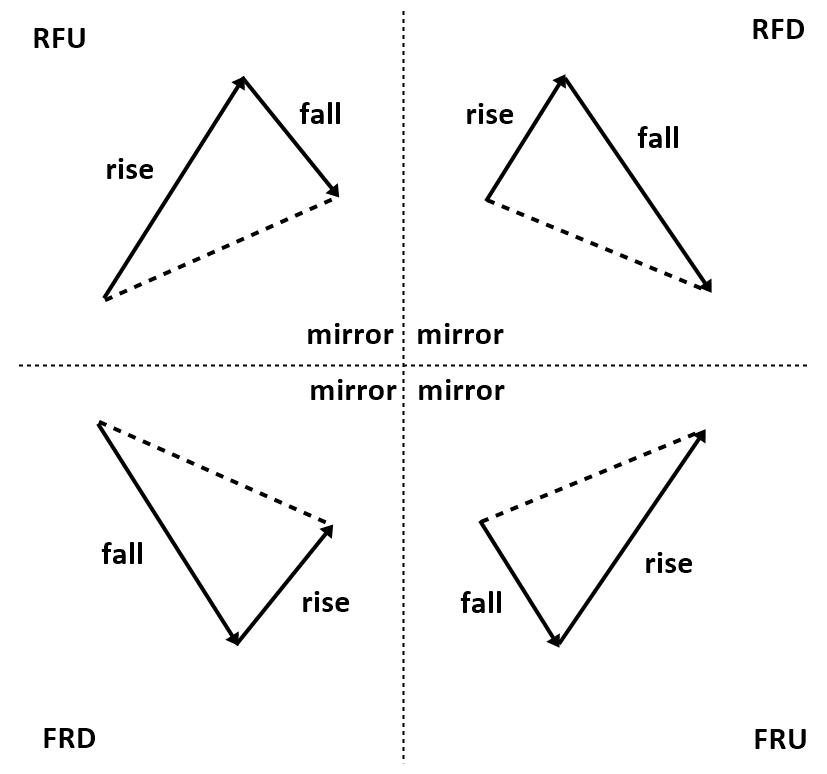
Figure 4-2: Four shapes of EFW in the financial market.
There are two important quantities to describe one single EFW (or Triangle). One is retracement ratio and the other one is expansion ratio. Retracement ratio concerns only one triangle. The formula to calculate Retracement ratio is as below:
Retracement Ratio = right swing of first triangle (Y0)/ left swing of first triangle (Y1).
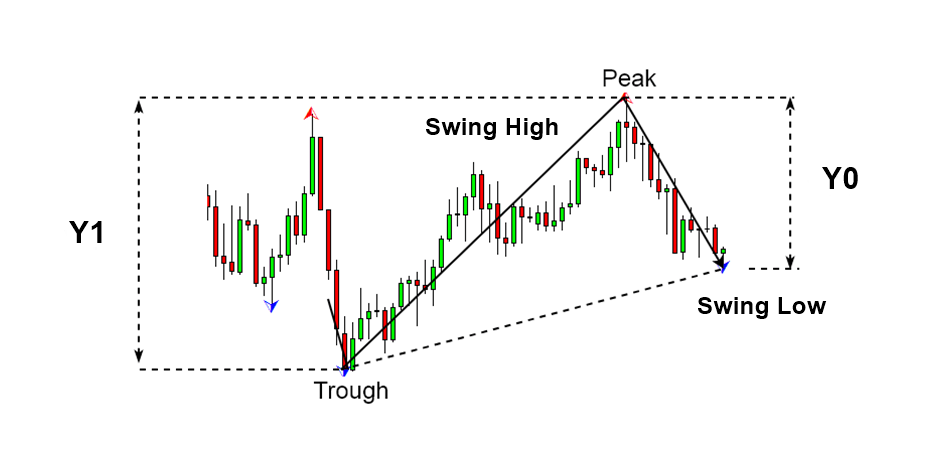
Figure 4-3: Swing high (Y1) and swing low (Y0)
Expansion ratio is calculated over two successive triangles. The formula to calculate Expansion ratio is as below:
Expansion ratio = right swing of first triangle (Y0)/ left swing of second triangle (Y2)
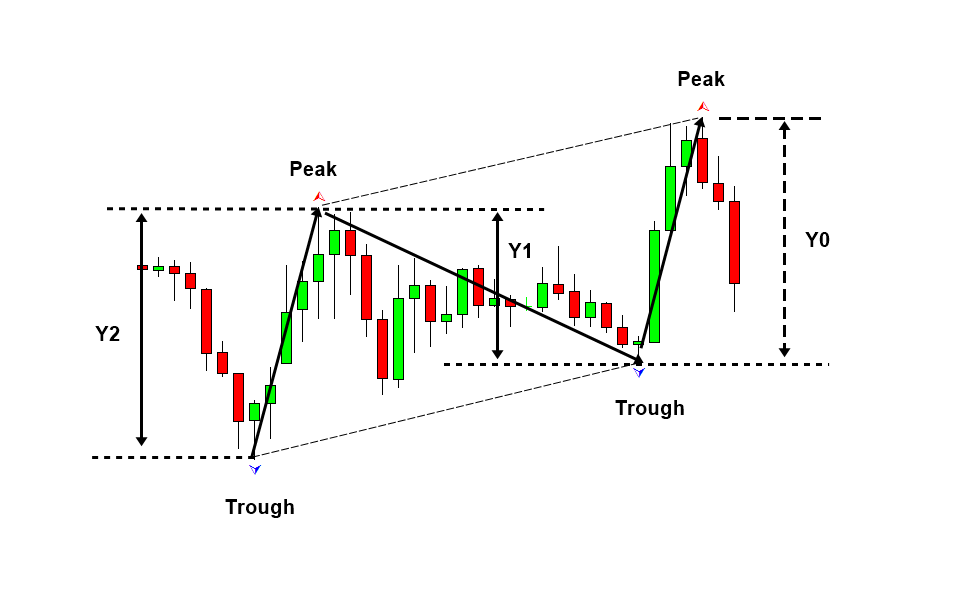
Figure 4-4: Swing high (Y2), swing low (Y1) and swing high (Y0)
5. Scientific Lag Notation for Retracement Ratio and Expansion Ratio
Any simple or complex price patterns based on the peak trough analysis can be described using the lag operator of retracement ratio and shape ratio. Lag operator is simply used to refer the previous quantity of retracement ratio and expansion ratio. For example, retracement ratio lag 0 is the latest retracement ratio and retracement ratio lag 1 is the previous retracement ratio. Likewise, expansion ratio lag 0 is the latest expansion ratio and expansion ratio 1 is the previous expansion ratio. Here are the short notations for each ratios.
R0 = Retracement ratio Lag 0
R1 = Retracement ratio Lag 1
R2 = Retracement ratio Lag 2
R3 = Retracement ratio Lag 3
…
Rn = Retracement ratio Lag n
E0 = Expansion ratio Lag 0
E1 = Expansion ratio Lag 1
E2 = Expansion ratio Lag 2
E3 = Expansion ratio Lag 3
…
En = Expansion ratio Lag n
Likewise, we can describe each Triangle (or EFW) with lag operator too.
T0 = EFW0 = Triangle (or EFW) at Lag 0
T1 = EFW1 = Triangle (or EFW) at Lag 1
T2 = EFW2 = Triangle (or EFW) at Lag 2
T3 = EFW3 = Triangle (or EFW) at Lag 3
Tn = EFWn = Triangle (or EFW) at Lag n
When we write T0: 3, T0: 3 indicates 3 triangles from Triangle 0. Therefore, this will include Triangle 0, Triangle 1 and Triangle 2. Also if we write T4: 6, T4: 6 indicates 6 triangles from Triangle 4. Therefore, this will include Triangle 4, Triangle 5, Triangle 6, Triangle 7, Triangle 8, and Triangle 9.
For an example, R0: 0.618 (or R0 = 0.618) describe the latest retracement ratio of 0.618. R1: 1.272 (or R1 = 1.272) describes the previous retracement ratio of 1.272. Likewise, E0: 0.500 (or E0 = 0.500) describes the latest expansion ratio of 0.500. E1: 1.618 (E1=1.618) describes the previous expansion ratio of 1.618.
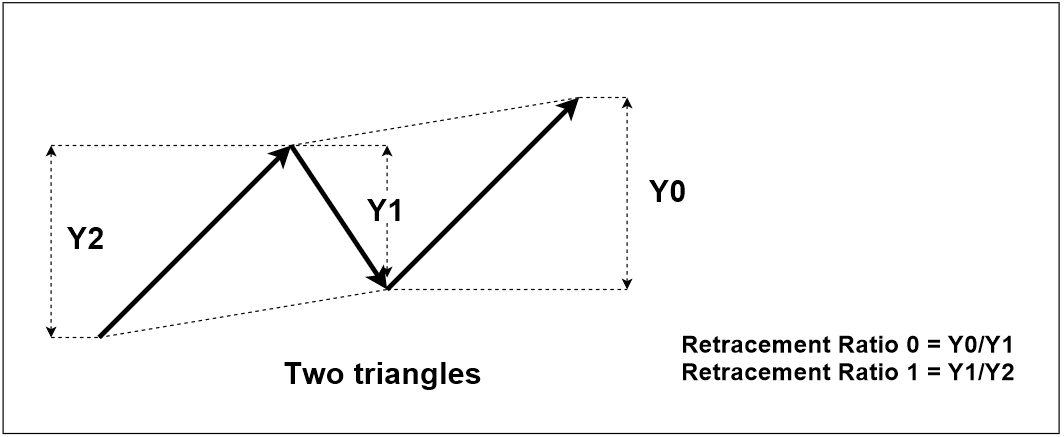
Figure 5-1: Pattern example with two retracement ratios
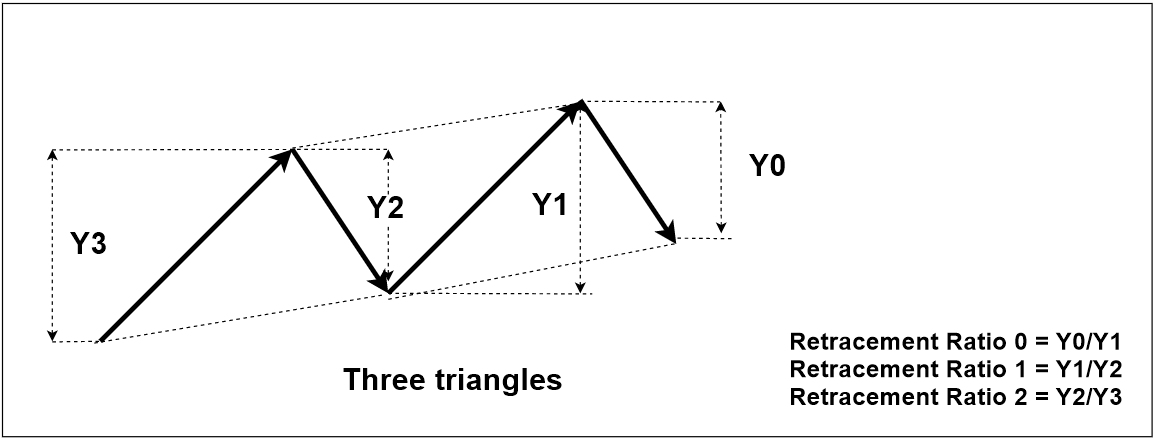
Figure 5-2: Pattern example with three retracement ratios
6. Closing Retracement Ratio to Describe the Structure of Pattern
Several EFWs (i.e. triangles) can make up one bigger EFW (triangle). In this case, closing retracement ratio exists over the small triangles. Closing retracement ratio is the retracement ratio of the bigger triangle, which is made up from several smaller triangles. Like the retracement ratio and expansion ratio, closing retracement ratio can be expressed using lag operator.
C0 = Closing retracement ratio at Lag 0
C1 = Closing retracement ratio at Lag 1
C2 = Closing retracement ratio at Lag 2
C3 = Closing retracement ratio at Lag 3
Cn = Close retracement ratio at Lag n
The common closing retracement ratio can be found when 3 EFWs are combined or 5 EFWs are combined. For an example, when 3 EFWs are combined to make up one bigger EFW with retracement ratio 0.618, we can simply express 3 EFWs like below:
C0: 0.618 to T0: 3
This notation indicates that 0.618 ratio is assigned to the triangle (i.e. EFW) made up from 3 smaller triangles (i.e. EFWs) from Triangle 0. In another word, the retracement ratio of the bigger triangle consisting of Triangle 0, Triangle 1 and Triangle 2 is 0.618.
When 5 EFWs are combined to make up one bigger EFW with retracement ratio 1.272, we can simply express 5 EFWs like below:
C0: 1.272 to T0: 5
This notation indicates that 1.272 ratio is assigned to the triangle made up from 5 triangles. In another words, the retracement ratio of the bigger triangle consisting of Triangle 0, Triangle 1, Triangle 2, Triangle 3 and Triangle 4 is 1.272.
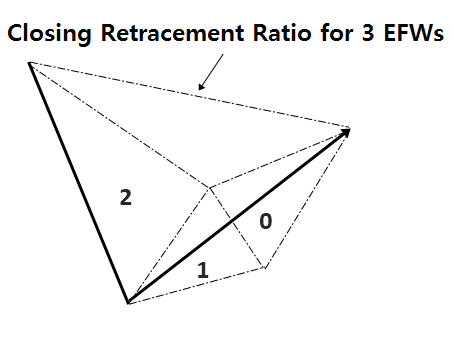
Figure 6-1: Closing retracement ratio illustration for 3 EFWs.
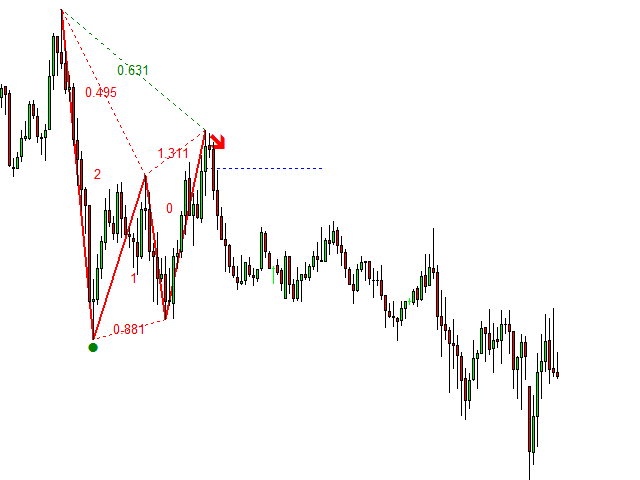
Figure 6-2: Closing retracement ratio real world example for 3 triangle pattern.
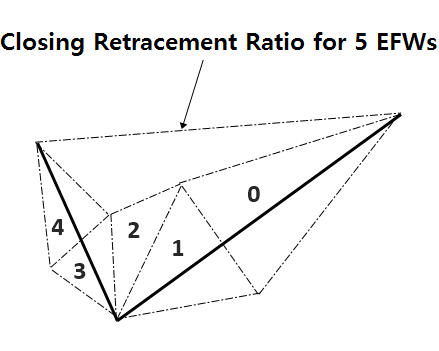
Figure 6-3: Closing retracement ratio illustration for 5 EFWs.
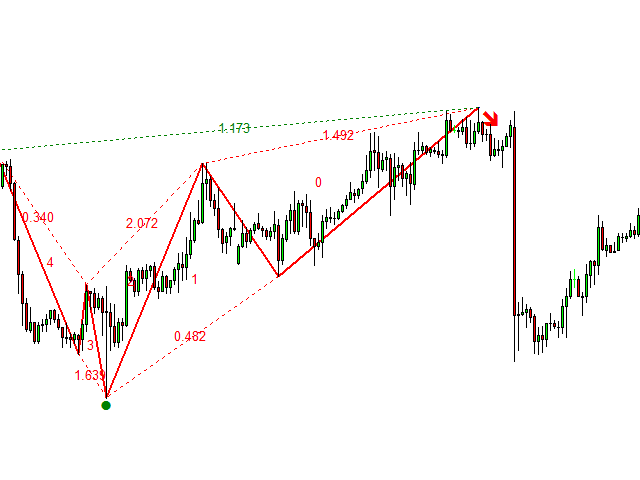
Figure 6-4: Closing retracement ratio real world example for 5 triangles.
When 3 EFWs are combined to make up one bigger EFW with retracement ratio 0.500 and then we can have another 3 EFWs to make up another bigger EFW with retracement ratio 0.618. These 6 EFWs can be expressed it like below:
C0: 0.500 to T0: 3, C1: 0.618 to T3: 3
7. Factored Expansion Ratio to Describe Structure of Pattern
Sometimes we need to relate expansion ratio for different EFW rather than the adjacent EFW. For example, this sort of relationship is found frequently, when we describe the impulse wave in Elliott Wave Theory.
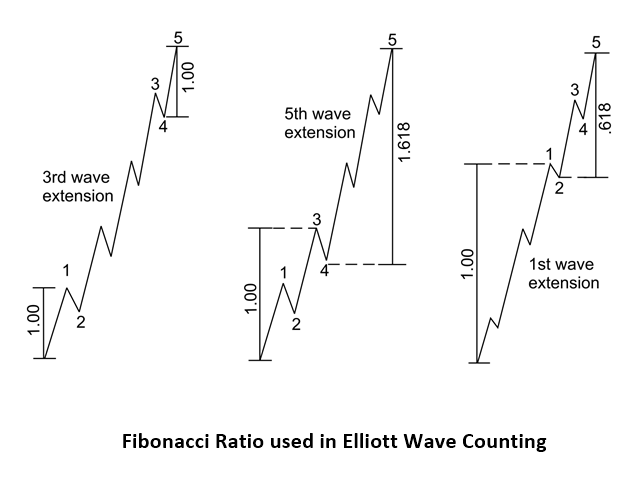
Figure 7-1: Elliott wave 12345 pattern structure.
Like the retracement ratio and expansion ratio, factored expansion ratio can be expressed using lag operator.
F0 = Factored expansion ratio at Lag 0
F1 = Factored expansion ratio at Lag 1
F2 = Factored expansion ratio at Lag 2
F3 = Factored expansion ratio at Lag 3
Fn = Factored expansion ratio at Lag n
To describe the Elliott Wave with 3rd Wave Extension, we can describe it simply using Factored Expansion Ratio.
F0: 1.000 to T0: 1 by T7: 1
This notation assigns:
Expansion Ratio 1.000 = (Right Swing of triangle 0)/(Left Swing of triangle 7).
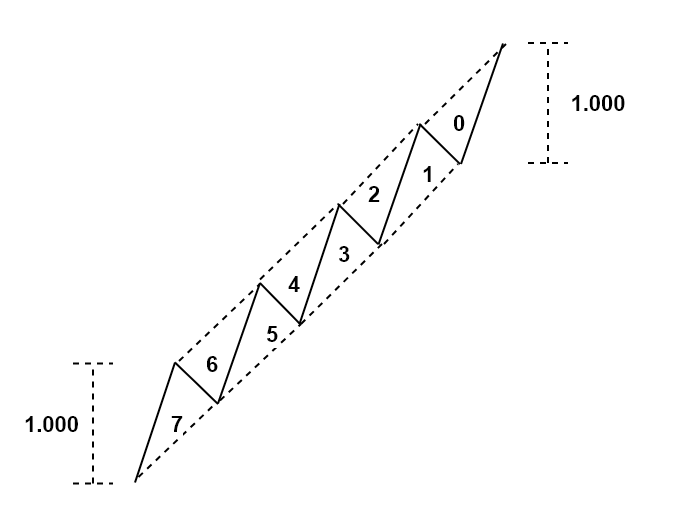
Figure 7-2: Diagram for F0: 1.000 to T0: 1 by T7: 1.
To describe the Elliott Wave with 5th Wave Extension, we can describe it simply using Factored Expansion Ratio.
F0: 1.618 to T0: 4 by T6: 2
This notation assigns:
Expansion Ratio 1.618 = (Right Swing between triangle 0 and triangle 3)/(Left Swing between triangle 6 and triangle 7).
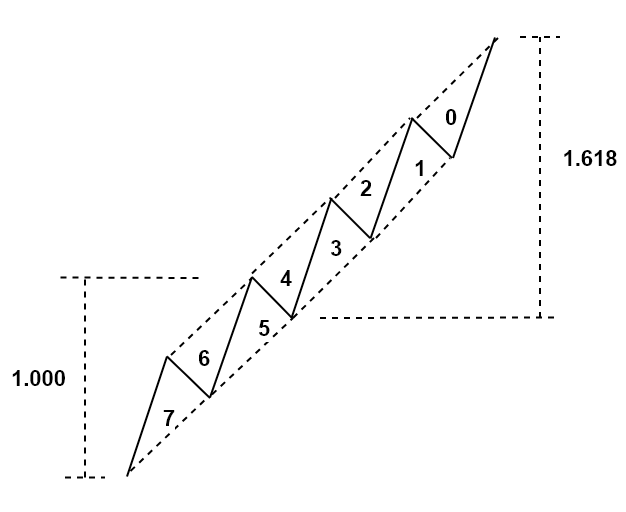
Figure 7-3: Diagram for F0: 1.618 to T0: 4 by T6: 2
In summary, we can describe any profitable patterns using Retracement ratio (R), Expansion ratio (E), Closing Retracement ratio (C), and Factored expansion ratio (F). All the four quantities share the same formula:
R, E, C, and F = Price Height of Right Swing / Price Height of Left Swing
To understand these quantities, you do not need to understand a rocket science. As long as you understand that each triangle consists of right and left swing, rest of the calculation will be just followed. You just need to think about which triangle’s left and right swing you need to input for the calculation. Most of time profitable patterns including simple and complex one can be defined using these four quantities including Fibonacci patterns, Harmonic Patterns, and Elliott Wave patterns.
8. Converting Number of Points to Number of EFWs
When the pattern has n points, the pattern has the n-2 Triangles (or EFWs). For example, 5 points harmonic patterns have 3 triangles always. 4 points AB=CD patterns have 2 triangles. The 6 points Elliott Wave .12345 patterns have 4 triangles. Whenever you need to convert points into triangles, use the following equation:
Number of Triangles = Number of Points in the pattern – 2.
9. X3 Pattern Notation with Name, Structure and Ideal Ratios
When we describe the patterns in the financial market, there are three parts to be included. The three parts including name, structure, and ideal ratios must be included to disclose their structure in details. Of course, name of the pattern will be given by the pattern discoverer. Structure of the pattern must be intuitive and easy to understand. In structure, the number of triangles must be stated using N to avoid any confusion.
For example,
- N1 = 1 EFW pattern = 1 triangle pattern and
- N5 = 5 EFW pattern = 5 triangle pattern.
Then any closing retracement ratio should be stated in the structure too if there is any. Of course, ideal ratio of each triangle should be reported by the pattern discoverer too. If the structure and ideal ratios are different from original pattern, then you should give the different name for the pattern or at least you should put “variation” to differentiate it from the original pattern. This is important because the variation can perform better or worse than original pattern in profitability. I personally think that the variation should be considered as a different pattern because they often return different trading performance in both backtesting and live forward testing.
9.1 Pattern with 1 Triangle (3 points) Examples
Name: 0.618 Fibonacci Retracement Pattern
Structure: N1
Ideal Ratios: R0: 0.618
Description: R0 = A/B = 0.618
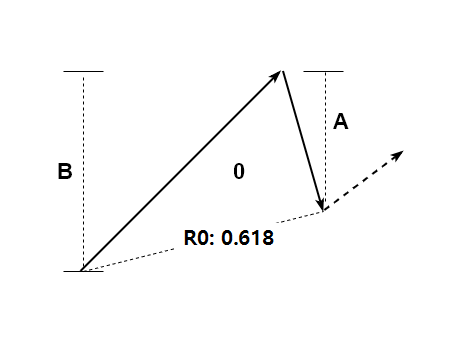
Figure 9-1: A Triangle with 0.618 Retracement ratio.
Name: 0.500 Fibonacci Retracement Pattern
Structure: N1
Ideal Ratios: R0: 0.500
Description: R0 = A/B = 0.500
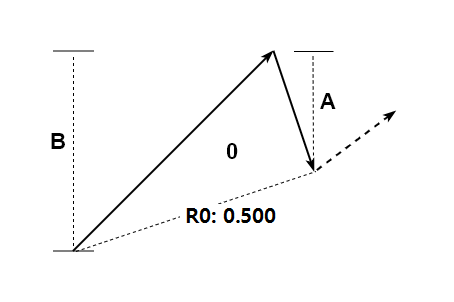
Figure 9-2: A Triangle with 0.500 Retracement ratio.
9.2 Pattern with 2 Triangles (4 points) Examples
Name: 0.782 Fibonacci Expansion Pattern
Structure: N2
Ideal Ratios: E0: 0.782
Description: E0 = A/B = 0.782
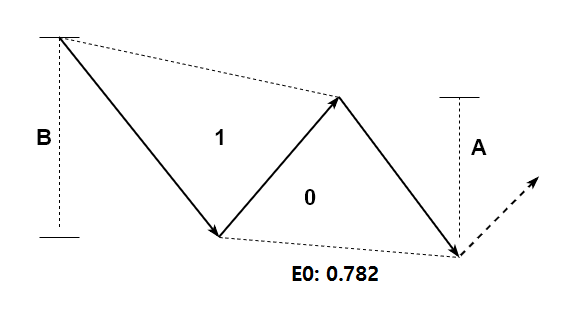
Figure 9-3: Two Triangles with 0.782 expansion ratio.
Name: 1.000 Fibonacci Expansion Pattern
Structure: N2
Ideal Ratios: E0: 1.000
Description: E0 = A/B = 1.000
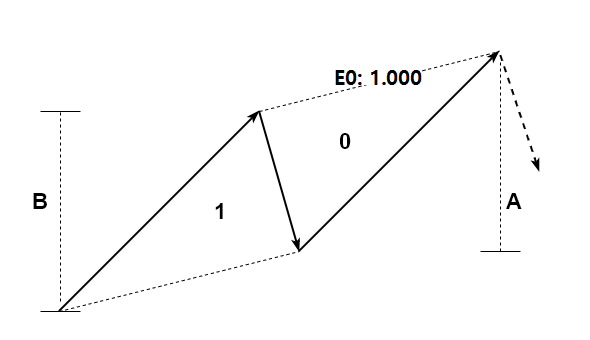
Figure 9-4: Two Triangles with 1.000 expansion ratio.
Name: Two Triangles with different shape
Structure: N2
Ideal Ratios: R0: 0.7, R1: 0.5
Description: two Triangles with random shape ratio
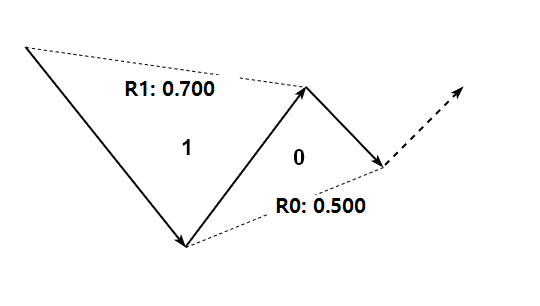
Figure 9-5: Two Triangles with different shape.
Name: AB=CD Simple
Structure: N2, T0 = T1
Ideal Ratios: R0: 1.618, R1: 0.618
Description: simple AB=CD pattern
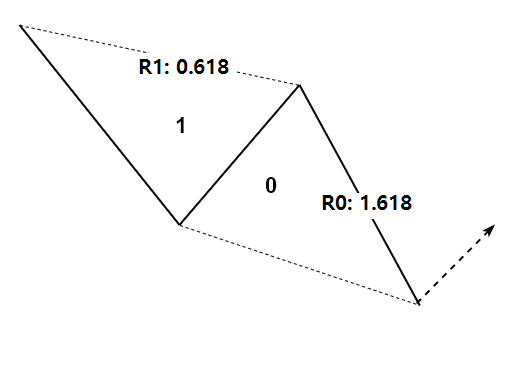
Figure 9-6: Two Triangles with AB=CD Simple.
Name: AB=CD with Range
Structure: N2
Ideal Ratios: R0: 1.272-1.618, R1: 0.618
Description: AB=CD pattern with range notation
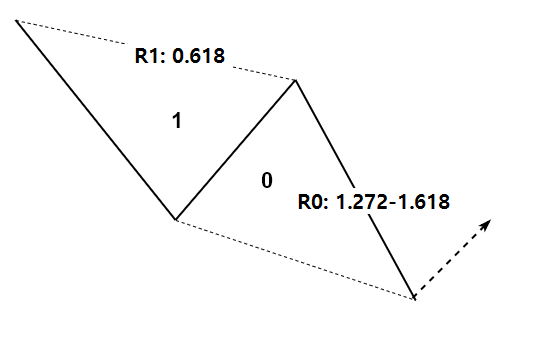
Figure 9-7: Two Triangles with AB=CD with Range.
9.3 Pattern with 3 Triangles (5 points) Examples
Name: Gartley Variation 1
Structure: N3, C0: 0.618 to T0: 3
Ideal Ratios: R0: 1.618, R1: 0.382 – 0.886, R2
Description: Gartley pattern with first and second retracement defined only
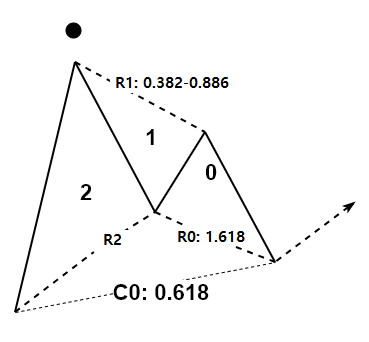
Figure 9-8: Gartley Pattern Variation 1.
Name: Gartley Variation 2
Structure: N3
Ideal Ratios: R0: 1.618, R1: 0.382 – 0.886, R2: 0.618
Description: Gartley pattern with three retracement ratios defined without closing retracement ratio
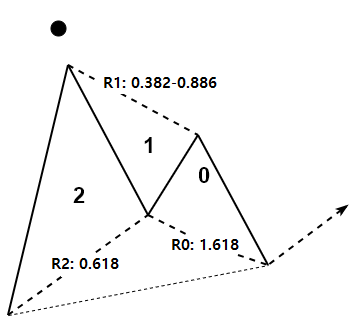
Figure 9-9: Gartley Pattern Variation 2.
Name: Gartley Variation 3
Structure: N3, C0: 0.618 to T0: 3
Ideal Ratios: R0: 1.618, R1: 0.382 -0.886, R2: 0.618
Description: Gartley pattern with closing retracement ratio defined
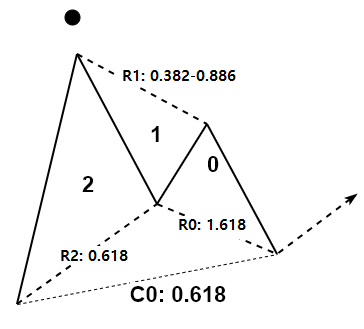
Figure 9-10: Gartley Pattern Variation 3.
9.4 Pattern with 4 Triangles (6 points) Examples
Name: Elliott Wave .12345 Pattern
Structure: N4, F0: 1.000 to T0: 1 by T3: 1
Ideal Ratios: R0: 1.618-2.618, R1: 0.382, R2: 1.618-3.000, R3: 0.618
Description: Elliott Wave .12345 pattern with extended Wave 3
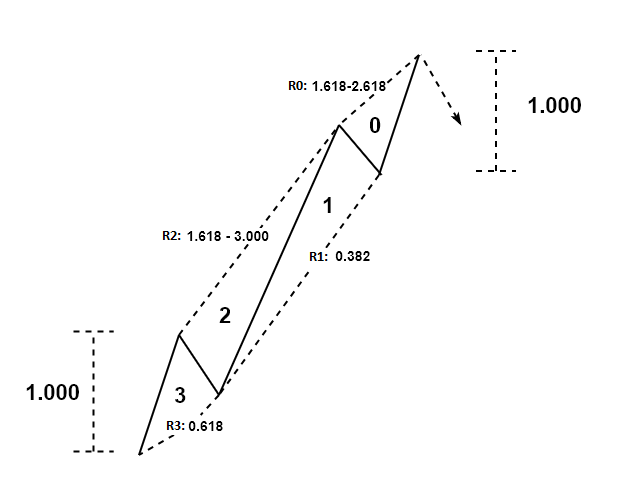
Figure 9-11: Elliott Wave .12345 Pattern with 3rd Wave Extension
9.5 Pattern with 7 Triangles (9 points) Examples
Name: Elliott Wave .12345ABC Pattern
Structure: N7, C0: 0.618 to T0: 7
Ideal Ratios: R0: 1.618, R1: 0.618, R2, R3: 1.618-2.618, R4: 0.382, R5: 1.618-3.000, R6: 0.618
Description: Elliott Wave .12345ABC pattern with extended Wave 3
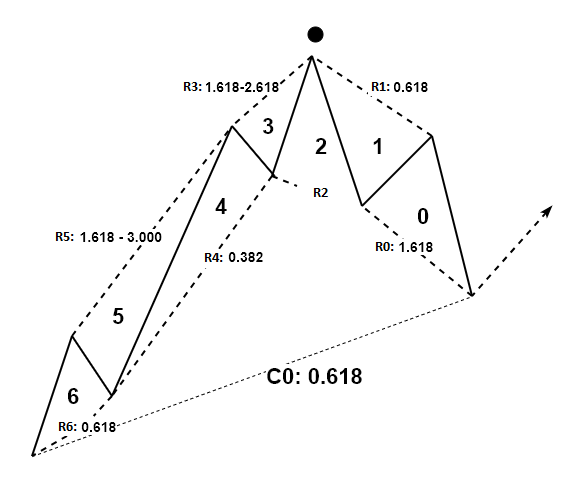
Figure 9-12: Elliott Wave .12345ABC Pattern
As you can see from the above examples, you can describe any price patterns in the financial market using X3 Pattern Notation just using short three lines. For example, when I first started with Elliott Wave theory, I had hard time of understanding Elliott Wave .12345ABC pattern from other textbooks. At the end of day, this complex pattern can be expressed in just three lines as above. Now, the communication is so much easier and it is even more accurate. We leave less grey area in our pattern detection too.
For the scientific advancement in understanding the financial market, we probably need to study existing and new patterns outside our knowledge. X3 pattern framework allows us to study those patterns in systematic approach beyond what we found in last 100 years. Especially X3 pattern framework can always be used to test your idea with the particular price patterns. For example, Elliott Wave theory provides the generalization of how wave is propagating in the financial market. Many trader do not like the idea of generalization because one can create too many variations of the patterns under the same name. This sort of subjectivity is particular to Elliott Wave Theory and some other methods. However, there is nothing to worry. If you really want to use the Elliott Wave pattern in your live trading, then you just need to create the fixed pattern structure using the generalized guide. After created the pattern structure, test them in both backtesting and forward testing. You probably need to create several variations of the fixed pattern structure in your testing. Let X3 pattern framework handles all these variations in your testing. At the end of your research, pick the best performing one for your live trading.
Remember that to trade and to profit, you do need to use the pattern with fixed structure. You cannot trade with a pattern whose pattern structure is keep changing every time in your analysis. As soon as you are trying to trade with a pattern with changing structure, you will start to add a lot of subjectivity. This is the worst situation to avoid for your trading. For your winning pattern, always write down these three lines as below. Trade only if the patterns meet the structure you have defined. Otherwise, do not qualify the pattern to trade.
- Name: My Best Elliott Wave Pattern
- Structure: N4
- Ideal Ratios: R0: X.XXX, R1: X.XXX, R2: X.XXX, R3: X.XXX
Anyway, this is what professional trader is doing every day to find the right entry with less subjectivity. X3 Pattern framework is the fast track learning method for all existing price patterns. At the same time, it is friendly to most of trader because its concept uses the retracement and expansion ratio from the popular Fibonacci Analysis and Swing Trading. We hope every trader getting the unlimited benefits of this powerful pattern framework.
About this Article
This article is the part taken from the draft version of the Book: Scientific Guide To Price Action and Pattern Trading (Wisdom of Trend, Cycle, and Fractal Wave). This article is only draft and it will be not updated to the completed version on the release of the book. However, this article will serve you to gather the important knowledge in financial trading. This article is also recommended to read before using Price Breakout Pattern Scanner, Advanced Price Pattern Scanner, Elliott Wave Trend, EFW Analytics and Harmonic Pattern Plus, which is available for MetaTrader 4 and MetaTrader 5 platform.
Below is the landing page for Price Breakout Pattern Scanner, Advanced Price Pattern Scanner, Elliott Wave Trend, EFW Analytics and Harmonic Pattern Plus. All these products are also available from www.mql5.com too.
https://algotrading-investment.com/portfolio-item/price-breakout-pattern-scanner/
https://algotrading-investment.com/portfolio-item/advanced-price-pattern-scanner/
https://algotrading-investment.com/portfolio-item/elliott-wave-trend/
https://algotrading-investment.com/portfolio-item/equilibrium-fractal-wave-analytics/
https://algotrading-investment.com/portfolio-item/harmonic-pattern-plus/
Related Products


