Video For Elliott Wave Indicator
Video For Elliott Wave Indicator is a tutorial or demonstration video that explains how to use an Elliott Wave indicator in trading or technical analysis. Elliott Wave Theory is a method used in technical analysis to predict future price movements in financial markets by identifying repeating patterns in market data.
An Elliott Wave indicator is a tool or software that helps traders identify these patterns automatically. It might provide visual cues, signals, or other information based on the principles of Elliott Wave Theory to assist traders in making decisions about buying or selling assets.
The video could cover various aspects such as:
- Explanation of Elliott Wave Theory: It might provide an overview of the theory itself, including the basic principles and rules for identifying waves within market price movements.
- Introduction to the Indicator: The video may introduce the specific indicator being discussed, explaining its features, how it works, and how to interpret its signals.
- Practical Examples: It might demonstrate how to apply the indicator to real market data, showing examples of how it can be used to identify potential trading opportunities or signals.
- Tips and Strategies: The video may also offer tips, best practices, and trading strategies for using the Elliott Wave indicator effectively.
Overall, the Video For Elliott Wave Indicator likely serves as a learning resource for traders interested in incorporating Elliott Wave analysis into their trading approach, using the indicator to streamline the process and potentially improve decision-making.
In this article, we will explain Elliott Wave Indicator used in Forex and Stock market. Before going into the details about the Elliott Wave Indicator, let us cover some basics of Elliott Wave Theory as they are the backbone of the Elliott Wave Indicator. Elliott Wave theory can be beneficial to predict the market movement if they are used correctly. Junior traders are often fear to use Elliott Wave because their complexity. From my experience, Elliott wave is not a rocket science, anyone can probably learn how to use the technique with some commitment. However, not all the book and educational materials will teach them in the scientific way. If we are just looking at the three rules from the original Wave principle only, there are definitely some rooms where subjective judgement can play in our wave counting. This makes the starters to give up the Elliott Wave Theory quickly. Fortunately, there are some additional tools to overcome the subjectivity in our wave counting. First tool but the most important tool is definitely the three wave rules from the original Wave Principle. They can be used as the most important guideline for the wave counting. Below we describe the three rules:
• Rule 1: Wave 2 can never retrace more than 100 percent of wave 1.
• Rule 2: Wave 4 may never end in the price territory of wave 1.
• Rule 3: Out of the three impulse waves (i.e. wave 1, 3 and 5), wave 3 can never the shortest.
Second tool is the Fibonacci ratio. As in the Harmonic pattern detection, Fibonacci ratio can play an important role in our wave counting because they describe the wavelength of each wave in regards to their neighbouring wave. For example, the following relationship is often found among the five wave of the impulse wave. Depending on which wave is extended among wave one, three and five, the Fibonacci ratios are different. Most of time, the extension of wave 3 is most frequently observed in the real world trading.
Unless wave 1 is extended, wave 4 often divides five impulse waves into the Golden Section. If the wave 5 is not extended, the price range from the starting point of wave 1 to the ending point of wave 4 make up 61.8% of the overall height of the impulse wave. If wave 5 is extended, then the price range from the starting point of wave 1 to the ending point of wave 4 make up 38.2% of the overall height of the impulse wave. These two rules are rough guideline. Sometime, trader can observe some cases where these two rules are not hold true. However, the priority between these two rules might depend on the preference of traders.
The corrective wave is often retrace 61.8% or 32.8% against the size of previous impulse wave. In general, Elliott suggested that corrective wave 2 and wave 4 have the alternating relationship. If wave 2 is simple, then wave 4 is complex. Likewise, if wave 2 is complex, then wave 4 is simple. A “Simple” correction means only one wave structure whereas a “Complex” correction means three corrective wave structures. Furthermore, if wave 2 is sharp correction, then wave 4 can be sideways correction. Likewise, if wave 2 is sideways correction, then wave 4 can be sharp correction.
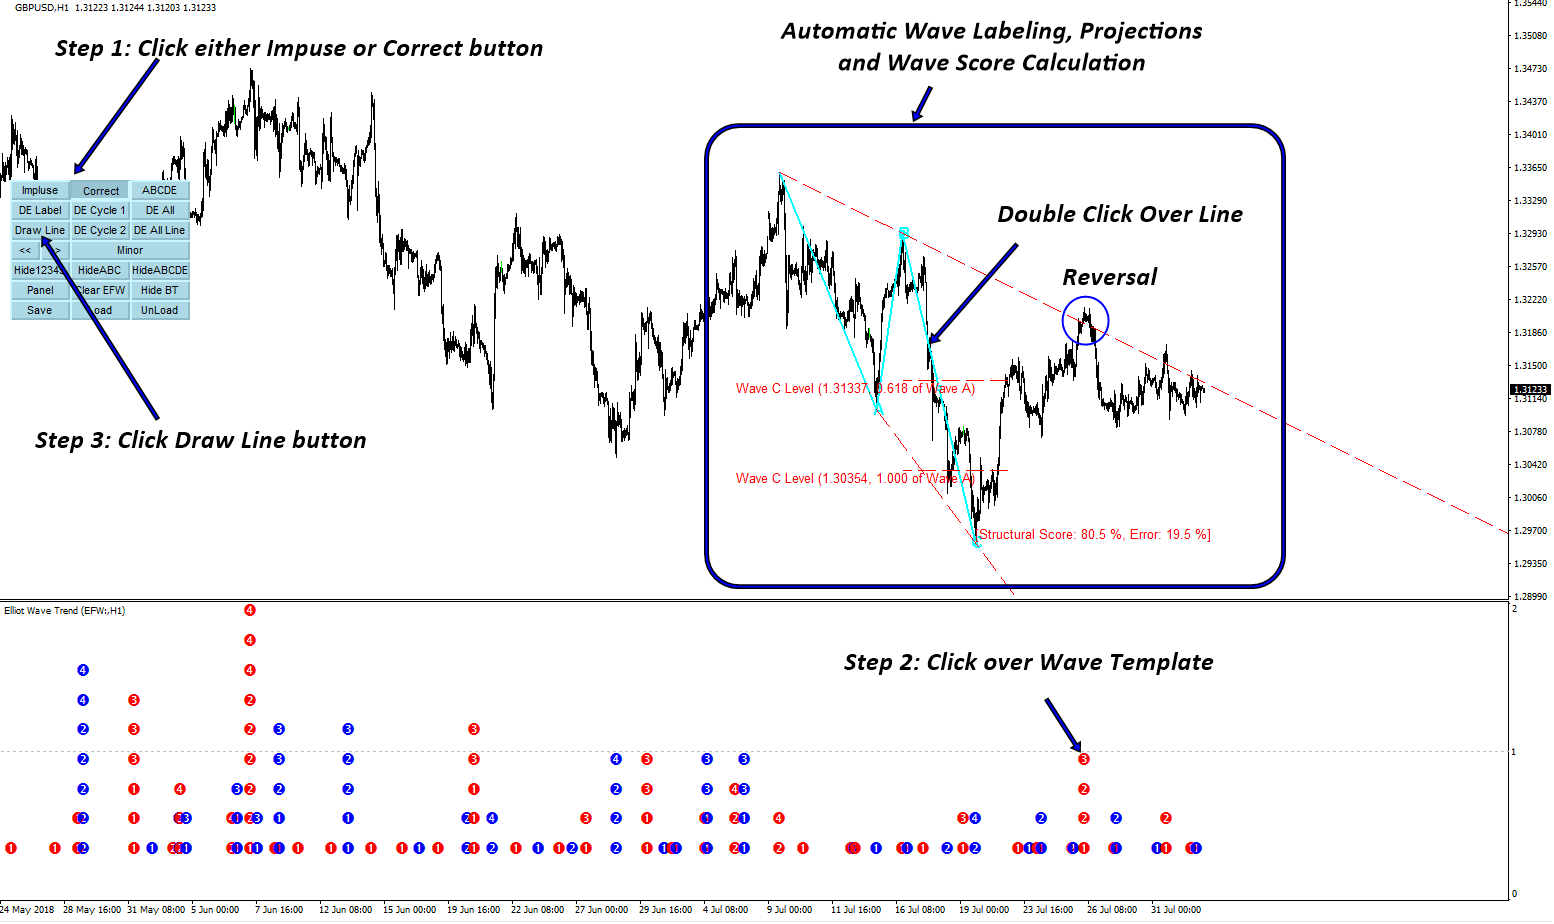
Elliott Wave Trend is the most powerful Elliott Wave Trading system, which helps you to trade with various Elliott Wave patterns like Elliott Wave .12345 pattern and Elliott Wave .ABC and Elliott Wave .ABCDE, etc.
Not limited but to give you some feel about the Elliott Wave Trend, you can visit this YouTube Video link:
Here is link for YouTube Video: https://www.youtube.com/watch?v=Oftml-JKyKM
Elliott Wave Trend provide many additional features on top of Elliott Wave Trading. Elliott Wave Trend produces its own support and resistance automatically for your trading. These are not ordinary support and resistance but projecting the location of superimposed wave patterns. You can use this together with your Elliott Wave projection. This will improve your trading performance too.
There are many other features not described here. But you can find out while you are using Elliott Wave Trend.
Link to Elliott Wave Trend.
https://algotrading-investment.com/portfolio-item/elliott-wave-trend/
https://www.mql5.com/en/market/product/16472
https://www.mql5.com/en/market/product/16479
Related Products


