Never Trade with Subjective Price Pattern
Using subjective price patterns in forex trading can provide you the negative impact on your trading performance. We list the disadvantages when you are using the subjective price patterns in your technical analysis.
Disadvantages:
- Lack of Objectivity: Subjective price patterns rely heavily on the interpretation of individual traders, which can introduce bias and inconsistency into trading decisions. Without clear rules or criteria, traders may find it challenging to maintain objectivity, leading to suboptimal outcomes.
- Risk of Overfitting: Subjective patterns may suffer from overfitting, where traders perceive patterns that are not statistically significant or reliable over the long term. This can lead to excessive trading based on false signals, resulting in losses and reduced profitability.
- Difficulty in Backtesting: Unlike objective, rule-based trading strategies, subjective patterns are often difficult to backtest rigorously. Without historical data to validate the effectiveness of these patterns, traders may have limited confidence in their predictive power.
In summary, while subjective price patterns offer flexibility and adaptability in forex trading, they also pose challenges related to objectivity, overfitting, and backtesting. Traders should carefully weigh the pros and cons and consider incorporating objective criteria into their trading strategies to mitigate risks and enhance performance. In the next section, we will explain the disadvantages listed here in detail. We will try to answer to what and why questions on these disadvantages.
When you trade in Forex and Stock market, the subjectivity is the biggest enemy of the trading performance and profitability. When you trade with price patterns, this is not an exception. Trading with a loosely defined price pattern can get you many troubles as we have seen in many Elliott Wave patterns with some loosely defined structure. Identifying accurate entry and exist is exceptionally hard when the price pattern is not well defined. In addition, with a loosely defined price pattern, you can not measure your trading performance correctly. Hence, it is hard to make any progress in the application and in the knowledge. Always keep the structure of winning price patterns. Next time, you will apply the same right pattern to decide either buy and sell direction. This will lead to more consistent success over long run. Now let us try to understand what exactly the price patterns we are talking about.
When the same or similar geometric shape is repeating infinitely in different scales, we call it “Fractal”. The self-similarity is the typical property of fractal. Fractal can be observed everywhere in the universe. In the space, tree, human anatomy, mountain, and, coast, we can observe fractal. For example, in the Romanesco Broccoli, the smaller piece, if they are broken off from the bigger piece, do look like the big piece. Like this, in Fractal, the same or similar patterns are occupying the entire structure of an object. Another example of fractal in nature is a coastline. The coastline shows the similar details on different scales. The waves provide a steady force to shape the coastline over time. When the coastline is straighter, the waves will keep pounding until they become more fractal. This mechanism cut the straighter line of coastline more wobbly in the zigzag pattern. Then, the straighter line inside the zigzag line will be cut into the smaller zigzag pattern. As a result, the coastline will look similar whether you zoom in or zoom out in the map.
As long as the price continuously rises and falls, we can utilize the fractal wave in our price analysis. After extensive price rise, the price must fall to realize the overvaluation of the price. Likewise, after extensive price fall, the price must rise to realize the undervaluation of the price. This price mechanism builds the complex zigzag path of the price movement in the financial market. Most of price data in the Forex and Stock market tend to follow this. Therefore, price pattern analysis are often heavily used to predict the price movement. Prior to apply these price patterns in the scientific way, the peak trough transformation is required. Peak trough transformation is the mathematical techniques to identify the peak and trough in turn to visualize the fractal wave in the price series. Some mathematical and technical analysis can be used as the peak trough transformation. This was explained in detail in the book: Scientific Guide to Price Action and Pattern Trading (Young Ho Seo, 2017). For example, the ZigZag indicator and the Renko chart is the popular peak trough transforming tools used by the trading community. In addition, Benoit Mandelbrot used the mathematical interpolation to explain the fractal wave in the price series. Since the mathematical interpolation is not popular among the trading community, we will focus on the ZigZag indicator and the Renko chart.
The ZigZag indicator and the Renko chart can be used to “peak trough transform” the price series. However, there are some important difference. For example, in the Renko chart, time is compressed as price gets transformed. The degree of time compression depends on the brick height chosen in the chart. This is not the case for the ZigZag indicator. In the ZigZag indicator, the price is only transformed while there is no change in time. Therefore, some traders prefer to use the ZigZag indicator while some others prefer to use the Renko chart. In this book, we recommend using the ZigZag indicator as we have seen that both price and time play an important role in the market prediction. Hence, we will stick with the ZigZag indicator. You will also find using the ZigZag indicator is straightforward and easy. For further understanding on the peak trough transformation, we can compare the Fourier transform and the Peak Trough transform in analogy. Fourier transform is heavily used in the cycle analysis. It extracts the cyclic features like wavelength and amplitude from price series. The techniques are useful for the data type in the second, third and fourth column in the price pattern table. On the other hands, the peak trough transform is heavily used in the geometric pattern analysis. This technique is useful for the data type in the fifth column in the price pattern table. You can tell both Fourier transform and Peak Trough transform as the sort of exploratory analysis performed before the main analysis. When we apply the peak trough transformation to the price series, we will be ready to perform the fractal wave analysis in our chart. The fractal wave analysis for our trading include the following methods.
• Horizontal support and resistance
• Diagonal support and resistance (i.e. trend lines)
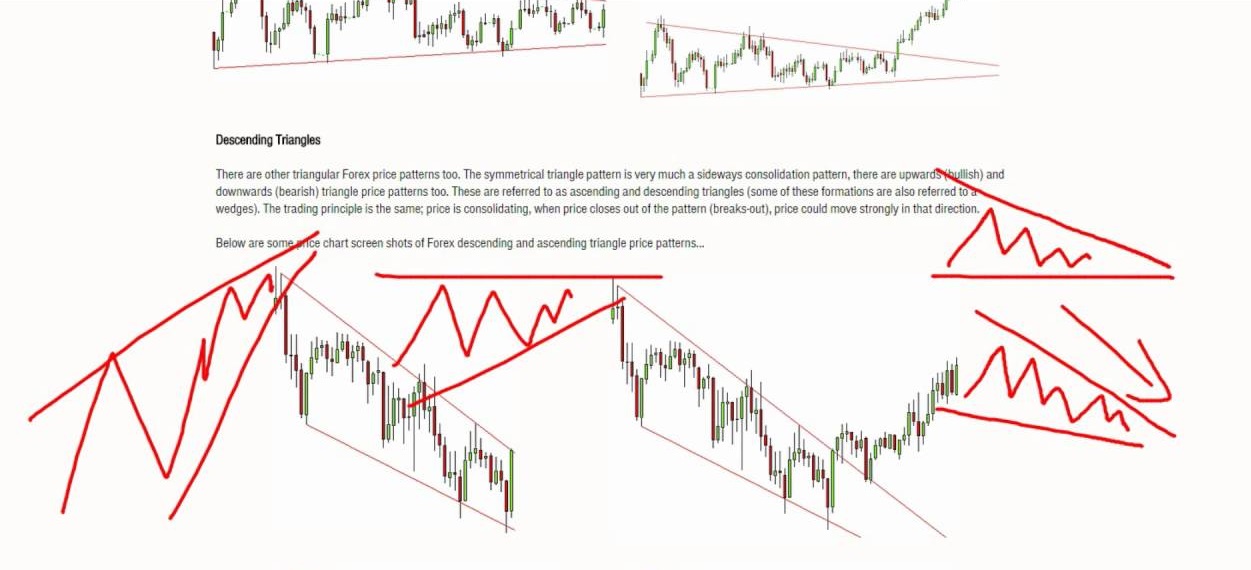
• Triangle pattern
• Rising wedge and falling wedge patterns
• Supply demand zone analysis
• Fibonacci analysis
• Harmonic Pattern
• Elliott Wave Theory
• Gann’s methods
• Point and Figure Chart
• X3 Chart Pattern
Below article about X3 Pattern framework shows the best way of keeping your winning price patterns in your pocket.
To help you further with the structure of price pattern, we also provide the Chart Patterns Tutorial here with the access of free Educational Software. You can use this tutorial to define many price patterns like Fibonacci price pattern, Harmonic Pattern, Elliott Wave pattern, X3 price pattern and so on in just few button clicks. Please check it out for your own good.
https://algotrading-investment.com/2020/10/08/tutorial-for-chart-patterns/
In addition, these tools below are the automatic price pattern scanner.
Harmonic Pattern Scenario planner
It is an advanced Harmonic Pattern indicator. On top of the features of Harmonic Pattern Plus, you can also predict future harmonic patterns through simulation. This is the tactical harmonic pattern tool designed for Professional harmonic pattern trader. Because of affordable price, this harmonic pattern detection indicator is loved by many traders although this is a repainting indicator.
https://www.mql5.com/en/market/product/6240
https://www.mql5.com/en/market/product/6101
https://algotrading-investment.com/portfolio-item/harmonic-pattern-scenario-planner/
X3 Chart Pattern Scanner
This is our next generation Harmonic Pattern and Elliott Wave Pattern Scanner. This is non-repainting and non-lagging Harmonic Pattern Indicator. On top of that, this tool can detect Elliott Wave Pattern and X3 Price Patterns. It can detect over 20 chart patterns. The bonus is that you can also detect around 52 Japanese candlestick patterns + advanced channel are added.
https://www.mql5.com/en/market/product/41993
https://www.mql5.com/en/market/product/41992
https://algotrading-investment.com/portfolio-item/profitable-pattern-scanner/
Related Products


