MetaTrader 4 Indicator List (Update)
MetaTrader 4 (MT4) is a popular trading platform widely used by Forex traders due to its user-friendly interface, extensive charting capabilities, and support for automated trading through Expert Advisors (EAs). MT4 offers a wide range of built-in indicators that traders can utilize to analyze price action and make informed trading decisions.
Here’s a list of some commonly used indicators available in MT4:
- Moving Averages (MA): Includes various types such as Simple Moving Average (SMA), Exponential Moving Average (EMA), and Weighted Moving Average (WMA). MAs smooth out price data to identify trends and potential reversal points.
- Relative Strength Index (RSI): Measures the speed and change of price movements to determine overbought or oversold conditions.
MACD (Moving Average Convergence Divergence): Consists of two moving averages that oscillate around a zero line to indicate trend direction and momentum. - Bollinger Bands: Consist of a simple moving average (SMA) surrounded by upper and lower bands that represent volatility levels. Used to identify overbought or oversold conditions and potential price breakouts.
- Stochastic Oscillator: Measures the momentum of price movements to identify overbought or oversold conditions.
- Ichimoku Kinko Hyo: A comprehensive indicator that provides insights into trends, support/resistance levels, and momentum.
- Fibonacci Retracement: Helps identify potential support and resistance levels based on Fibonacci ratios.
- Average True Range (ATR): Measures market volatility by calculating the average range between high and low prices over a specified period.
- Parabolic SAR (Stop and Reverse): Provides trailing stop-loss levels to follow trends and potential reversal points.
- ADX (Average Directional Index): Measures the strength of a trend and can help identify whether a market is trending or ranging.
- Volume Indicator: Displays trading volume over a specified period, which can be used to confirm price trends or identify potential reversals.
- Williams %R: Similar to the Stochastic Oscillator, Williams %R measures overbought or oversold conditions.
- Aroon Indicator: Helps identify trend strength and potential trend reversals.
- Alligator Indicator: Consists of three smoothed moving averages that indicate trend direction and potential reversals.
- Pivot Points: Calculate potential support and resistance levels based on the previous day’s price action.
Indicators for MetaTrader can provide insightful data on market patterns, volatility, and future price reversals in Forex and Stock Trading. Traders can improve their overall trading performance and make more profitable selections by using MetaTrader indicators. The following are some advantages of using MetaTrader indicators:
- Enhanced Market Analysis: The ability to conduct in-depth market analysis is one of the main benefits of employing MetaTrader indicators.
- Increased Accuracy: By employing MetaTrader indicators, traders can increase their general trading performance and make more informed decisions.
- MetaTrader indicators are highly adaptable and configurable, enabling traders to modify them to meet their own needs.
- Automated warnings can be generated by MetaTrader indicators when specific criteria are satisfied.
Chart pattern indicator can be used to detect the patterns in the market trend in the indicator chart. They can also detect market trends that are shown with the help of candlesticks. The most important benefit is that chart pattern indicators can be used in all timeframes and for all currency pairs. They can be used in all market conditions and suit all trading styles. This indicator is best for scalping, day trading (intraday), swing trading and long-term (position) trading.
Harmonic patterns are chart patterns that form part of a trading strategy, scientifically speaking they are based on Fractal Wave. They can help traders to spot pricing trends by predicting future market movements. They create geometric price patterns by using Fibonacci numbers to identify potential price changes or trend reversals. Harmonic patterns construct geometric pattern structures (retracement and projection swings/legs) using Fibonacci sequences. These harmonic structures identified as specified (harmonic) patterns provide unique opportunities for traders, such as potential price movements and key turning or trend reversal points. Harmonic pattern trading has many more attention than other trading methods.
Support and resistance levels help traders plan better trades. You need to understand support and resistance levels because they can provide entries and exits as well as price targets and stop-loss triggers. You may plan entries for long trades at support levels and exits at resistance levels. Technical analysts use support and resistance levels to identify price points on a chart where the probabilities favor a pause or reversal of a prevailing trend. Support occurs where a declining price trend is met by a concentration of buyers. Resistance occurs where a rising price trend is met by a concentration of sellers.
Here is the great collection of MetaTrader Indicator List. Each indicator is designed to give you higher accuracy and performance improvement for your trading in your MetaTrader terminal. The indicators range from popular Harmonic Pattern and Elliott Wave pattern indicator to Hard Core Math based Algorithm. We provide the short description and link to the product page for each MetaTrader indicator. We also include the link to Free MetaTrader indicators on the bottom of this page.
1. Advanced Price Pattern Scanner
Advanced Price Pattern Scanner for MetaTrader
https://www.mql5.com/en/market/product/24679
2. Harmonic Pattern Plus
Harmonic Pattern Indicator for Metatrader
https://www.mql5.com/en/market/product/4488
3. Harmonic Pattern Scenario Planner
Harmonic Pattern Scanner for Metatrader
https://www.mql5.com/en/market/product/6240
4. Profitable Pattern Scanner
Non Repainting Harmonic Pattern and Elliott Wave Pattern Scanner for Metatrader
https://www.mql5.com/en/market/product/41993
5. Mean Reversion Supply Demand
Supply/Demand Zone Metatrader (MT4/MT5) Indicator
https://www.mql5.com/en/market/product/16851
6. Price Breakout Pattern Scanner
Price Pattern Scanner for MetaTrader
https://www.mql5.com/en/market/product/4859
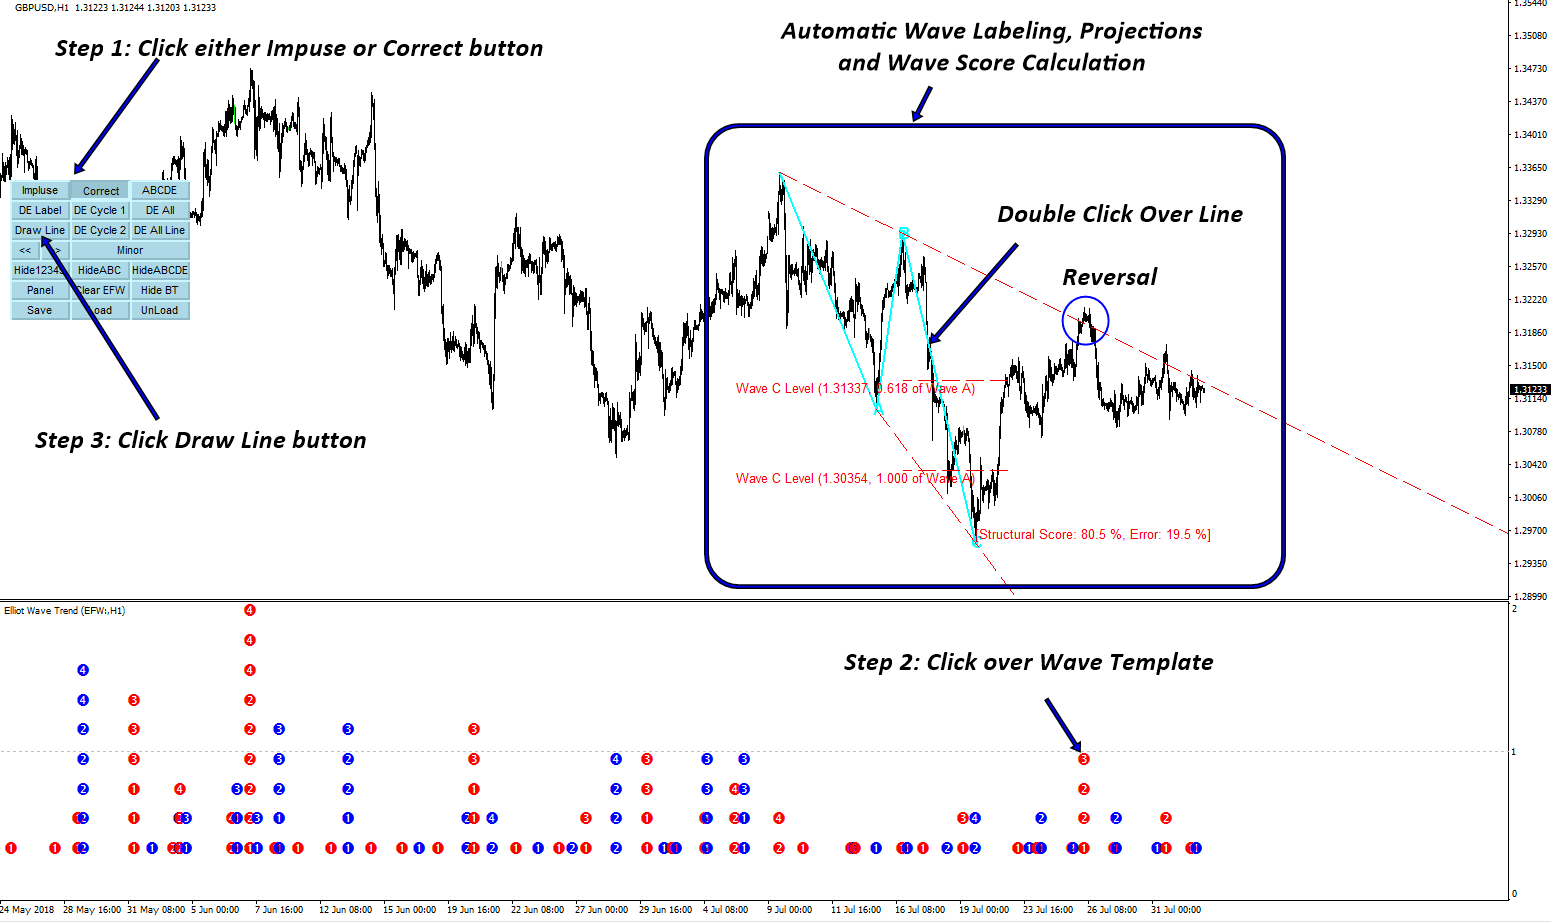
7. Elliott Wave Trend
Elliott Wave Trend is a MetaTrader indicator designed for turning point and trend analysis in elliott wave identification and prediction.
https://www.mql5.com/en/market/product/16479
8. Excessive Momentum Indicator
Excessive Momentum Indicator is advanced momentum trading indicator designed to detect potential trading opportunity attributed by market anomalies.
https://www.mql5.com/en/market/product/30641
9. Other Free MetaTrader Indicators
You can also access the free MetaTrader indicators from below links:
Related Products

