Fibonacci Retracement with Probability in Forex and Stock Market
Fibonacci retracement levels are widely used in technical analysis to identify potential levels of support or resistance in a financial instrument’s price movement. When discussing Fibonacci retracements in terms of probability, we’re essentially assessing the likelihood that these levels will influence price action.
Here’s how Fibonacci retracement levels can be approached from a probabilistic standpoint:
- Historical Significance: Fibonacci retracement levels, such as 38.2%, 50%, and 61.8%, are derived from the Fibonacci sequence and have shown historical significance in financial markets. Traders often believe that these levels represent potential areas where price may reverse or consolidate.
- Self-Fulfilling Prophecy: One reason Fibonacci retracement levels can be effective is due to their self-fulfilling prophecy nature. Many traders and algorithms are programmed to react to these levels, leading to increased buying or selling pressure around them. This can reinforce their significance in price action.
- Probability of Bounce or Break: When price approaches a Fibonacci retracement level, traders assess the probability of either a bounce (reversal) or a break (continuation). This assessment is based on factors such as the strength of the trend, market sentiment, volume analysis, and confluence with other technical indicators.
- Confirmation with Other Indicators: Probability analysis of Fibonacci retracement levels is often strengthened by confirming signals from other technical indicators. For example, if a 61.8% retracement level aligns with a key support/resistance zone or a trendline, it increases the probability of price reacting at that level.
- Risk Management: Probability analysis should inform risk management decisions when trading based on Fibonacci retracement levels. Traders should consider the probability of a successful trade relative to the potential risk involved, adjusting position sizes and stop-loss levels accordingly.
- Adaptation to Market Conditions: While Fibonacci retracement levels can be powerful tools, they are not foolproof. Market conditions can change, and traders should be prepared to adapt their strategies based on evolving price action and new information.
In summary, Fibonacci retracement levels offer a probabilistic framework for analyzing potential areas of support or resistance in financial markets. By combining these levels with other technical indicators and risk management techniques, traders can make more informed decisions and improve the likelihood of successful trades.
In this article, we will provide some guide for Fibonacci Retracement and we will explain how to improve Fibonacci Retracement with Probability in Forex and Stock trading. A Fibonacci analysis is a popular tool among technical traders. It is based on the Fibonacci sequence numbers identified by Leonardo Fibonacci, the Italian mathematician, in the 13th century. The Fibonacci sequence numbers are:
0, 1, 1, 2, 3, 5, 8, 13, 21, 34, 55, 89,144, 233, 377, 610, 987, 1597, 2584, 4181, 6765, …………………
As the Fibonacci number become large, the constant relationship is established between neighbouring numbers. For example, every time, when we divide the former number by latter: Fn-1/Fn, we will get nearly 0.618 ratio. Likewise, when we divide the latter number by former: Fn/Fn-1, we will get nearly 1.618. These two Fibonacci ratio 0.618 and 1.618 are considered as the Golden Ratio. We can use these Golden ratios to start our Fibonacci analysis. However, many technical traders use additional Fibonacci ratios derived from the Golden ratio.
There is no doubt that Fibonacci Retracement is one of the favourite tools in our Forex and Stock trading. With Fibonacci Expansion Together, Fibonacci Retracement is also the underlying technique behind many advanced pattern strategy. For example, Harmonic Pattern, Elliott Wave Patterns, and X3 Patterns are almost the direct application of Fibonacci Retracement and Fibonacci Expansion. These methods are the favourite strategy of many advanced Forex and Stock market users. Indeed, they are powerful at picking up turning point faster than most of existing technical indicators. There are no other technical indicators providing similar attribute when it comes to picking up turning point.
Especially, in X3 patterns, you will find that many profitable patterns are just the successive combination of different ratios made up from retracement and expansion. Some are jagged up together to create some special patterns. The further details of applying Retracement and Expansion ratio to create patterns can be found from below articles for your information.
In spite of the fact that Fibonacci Retracement is popular and powerful trading tools, there are some weakness of Fibonacci Retracement and Fibonacci Expansion. Can you guess what their weakness is? To understand their weakness, it is important to go through how they are calculated first. For example, retracement ratio is calculated using the following formula.
Retracement Ratio = right swing of first triangle (Y0)/ left swing of first triangle (Y1).
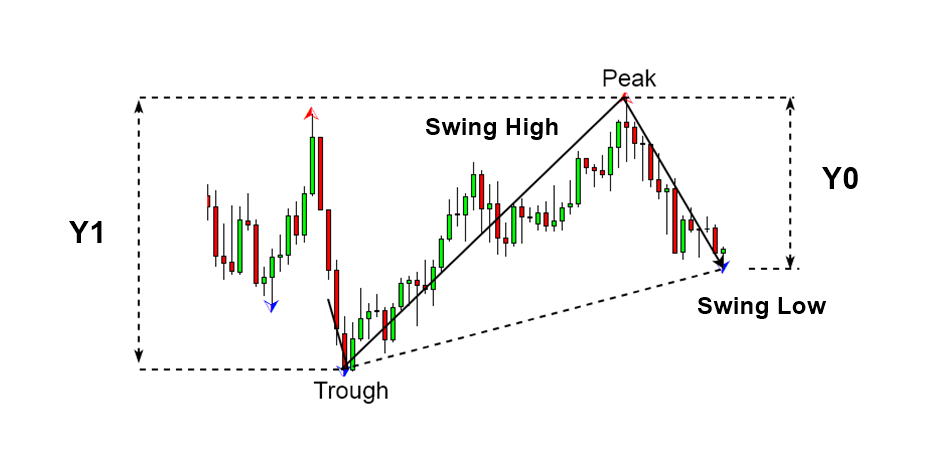
Figure 1: Swing high (Y1) and swing low (Y0)
Likewise, the expansion ratio of price series is calculated like below formula. You can tell both formula is straight forward and not the rocket science. Any trader can get the benefit of these formulas in their trading.
Expansion ratio = right swing of first triangle (Y0)/ left swing of second triangle (Y2)
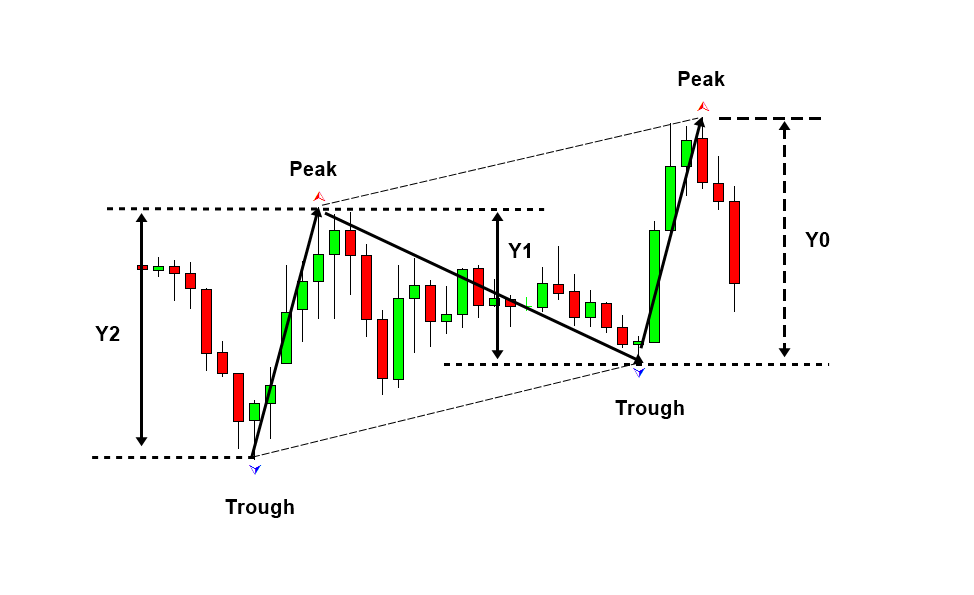
Figure 2: Swing high (Y2), swing low (Y1) and swing high (Y0)
Now, you read and understand the formula. Let me ask you one question. What does these formulas of Retracement and Expansion ratio means? In the formula, you would notice that the ratios are calculated in relative to previous swing height. Yes, the ratio study allows you to establish the relationship between two swings points. However, these are the relative term only. The ratio stood only against previous swing point. For example, say we have Fibonacci retracement 61.8% and we found the potential turning point at the support (Figure 3). However, what is the absoluteness of this swing point except that there was 61.8% pull back from previous swing point? Yes, we do not know anything else. We do not know how big or small, how risky, or how mature these swing point is in terms of entire price series or entire swing points. Only thing we know is that this swing point is 61.8% shorter than previous swing point. That is just relative comparison and not absolute comparison. In financial market, we need to know both relative and absolute terms to make prediction that is more accurate. Using one of them, we are just making the prediction with insufficient knowledge.
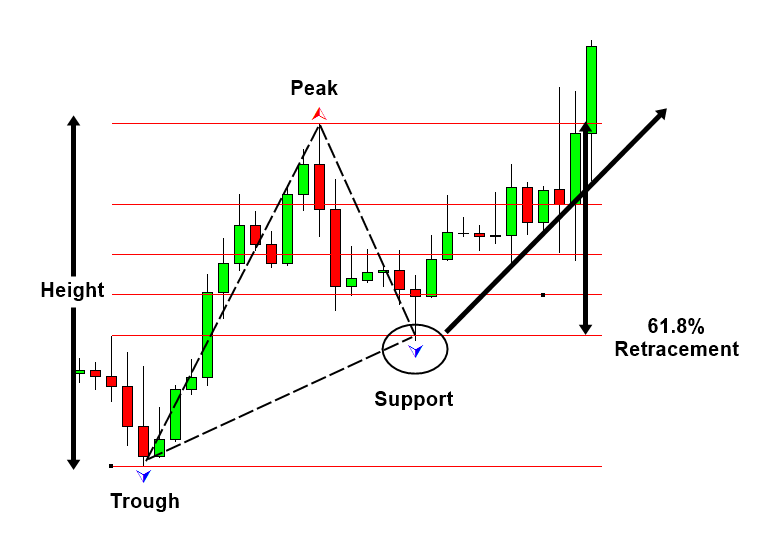
Figure 3: Bullish 61.8% Retracement example in EURUSD
Hence, with Fibonacci Retracement and Expansion alone, we only know half of the story. The same limit applies to the price patterns made up from Fibonacci Retracement and Expansion. Hence, Harmonic Pattern, Elliott Wave pattern and X3 patterns are all sharing the same weakness.
Then, how can we get the absolute term in our trading equation? The best method is using probability. Probability is the excellent tool providing the useful measurement across entire price series. Probability is staying absolutely the same across entire price series. In addition, it helps us to interpret the market in multiple of different angles. For example, with probability, we can check the current market risk and volatility information directly at the swing point. Hence, you can compare how significant current swing point against entire price series. This provides another half of the picture that was missing from Fibonacci Retracement and Expansion.
Another advantage of probability is that its ability to standardize price and time in 1 to 1 relationship. As we know, probability ranges between 0.0 and 1.0. It does not matter if we apply probability to price and time, we can always allocate the corresponding probability to price movement between 0.0 and 1.0.
To make the best of the both world, we have created what we call “Probability Fibonacci Grid” or “Fibonacci Probability Graph”. This is simply the hybrid of probability and Fibonacci Retracement. In the Probability Fibonacci Grid, the left Y-axis indicates the turning point probability of the current swing point, which is absolute term. The right Y-axis indicates the Fibonacci retracement calculated from previous swing, which is relative term. Likewise, Probability Fibonacci Grid provides exactly same information in time too. For example, on the top, it provides the turning point probability in terms of time, which is absolute term. On the bottom, it provides the Fibonacci retracement of time calculated from previous swing time, which is relative.
With Probability Fibonacci Grid, not only you can measure the Fibonacci Retracement in Time and Price but you can also measure the significance, size, risk, and volatility of the swing point. With both absolute and relative term together, you can make the prediction that is more accurate in Forex and Stock market.
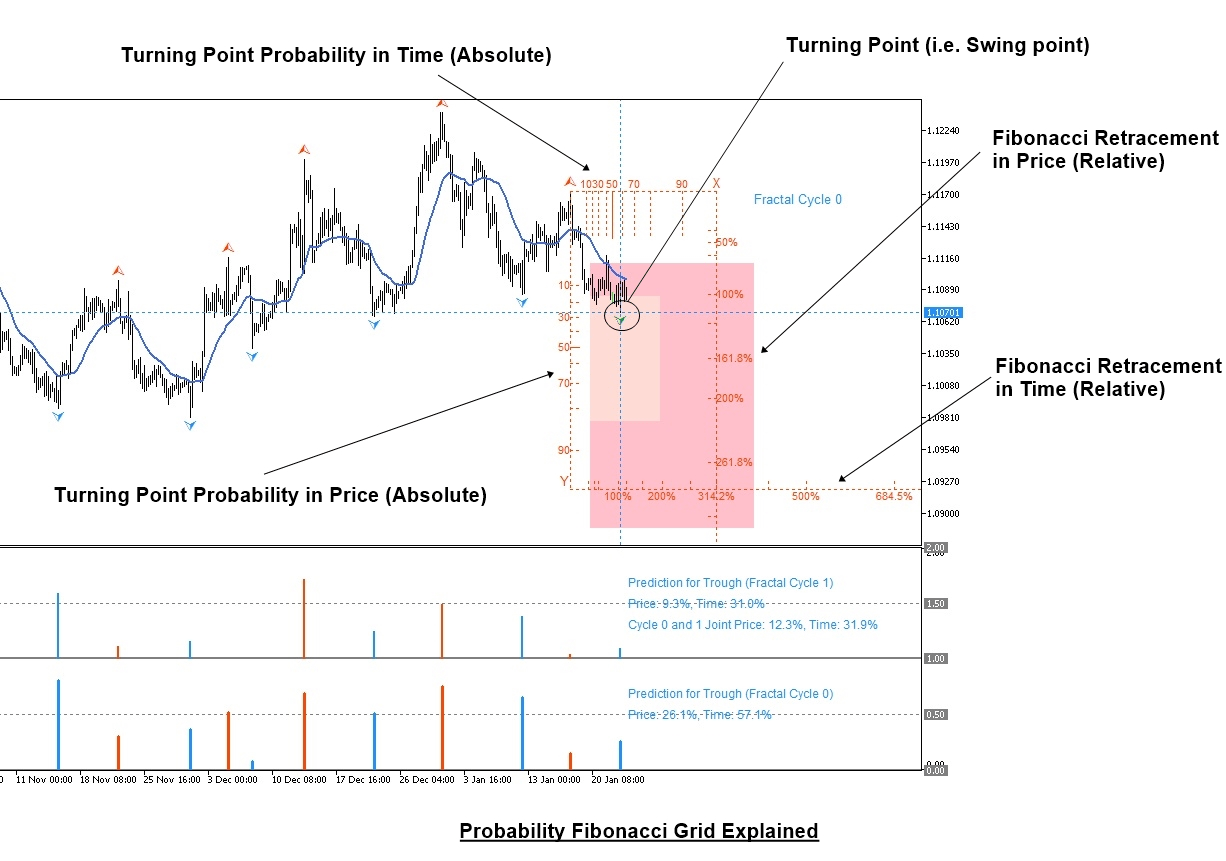
Figure 4: Probability Fibonacci Grid example in EURUSD
Now, the powerful Probability Fibonacci Grid is shipped inside Fractal Pattern Scanner with many other powerful gadget. We hope you to enjoy the latest trading technology for your maximum benefits. Of course, you can combine the Probability Fibonacci Grid together with Harmonic Pattern, Elliott Wave pattern and X3 patterns. Remember that combining both relative and absolute term together you can make the best prediction with the market.
Below is the landing page for Fractal Pattern Scanner.
https://www.mql5.com/en/market/product/49170
https://www.mql5.com/en/market/product/49169
https://algotrading-investment.com/portfolio-item/fractal-pattern-scanner/
Important Note
This article is not about discourage of using Fibonacci Retracement, Harmonic Pattern, Elliott Wave, and X3 pattern. We all know that these methodologies provide the unmatched and fastest entry comparing to other technical indicators. The purpose of this article is to demonstrate how we can improve these great techniques even more powerful by adding probability study.
Related Products


