Adding Peak Trough Analysis Tool in your Chart – MetaTrader
1. Overview on the Tutorial
Peak Trough Analysis is the powerful Wave Indicator available in MetaTrader. It helps you to detect various price patterns in more organized and efficient way. We have demonstrated how to detect Rising wedge, falling wedge and triangles, Elliott Wave patterns with Peak Trough Analysis in our Book: Scientific Guide To Price Action and Pattern Trading. In addition, we have demonstrated how to detect Fibonacci Price Pattern, Elliott Wave pattern, Harmonic Pattern and X3 pattern with Peak Trough Analysis in our Book: Profitable Patterns in Forex and Stock Market.
Since the Peak Trough Analysis is a must have tool for the financial trader, we briefly demonstrate how to load them in your chart. For your information, Peak Trough Analysis is freely downloadable from our website: www.algotrading-investment.com
2. Steps to use Peak Trough Analysis indicator
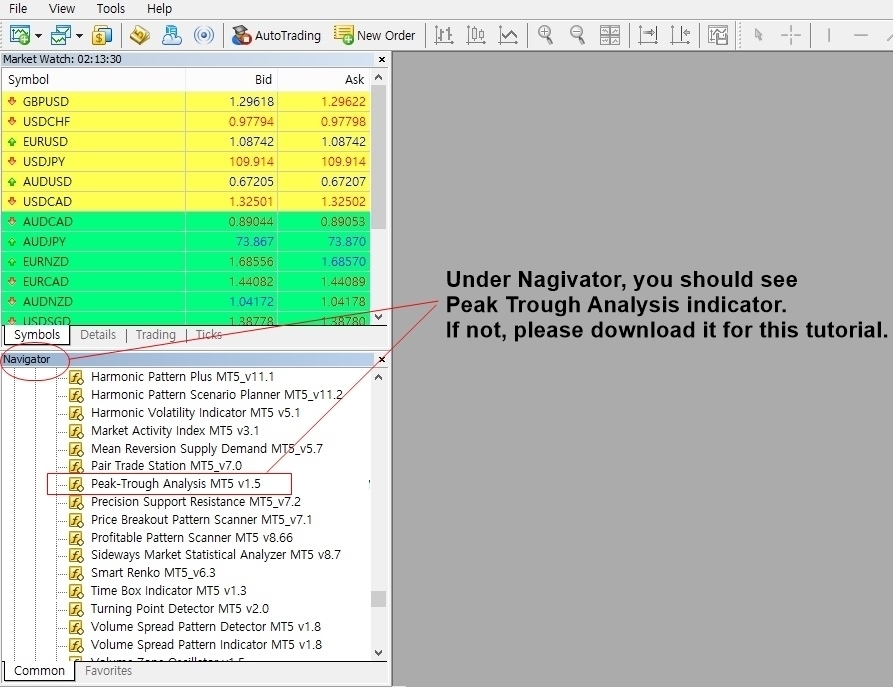
We assume that you have downloaded Peak Trough Analysis tool already in your MetaTrader platform. Once you have downloaded the indicator, you should be able to see it in the navigator.
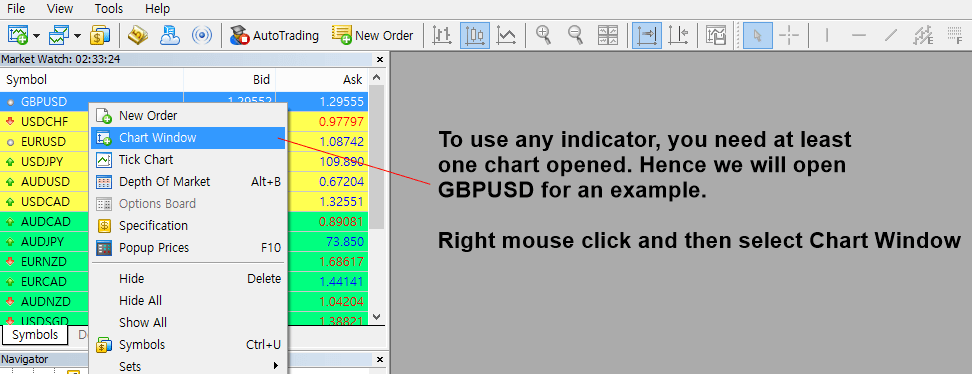
To use any indicator, you need to have at least one chart opened. In this tutorial, we will open GBPUSD hourly chart.
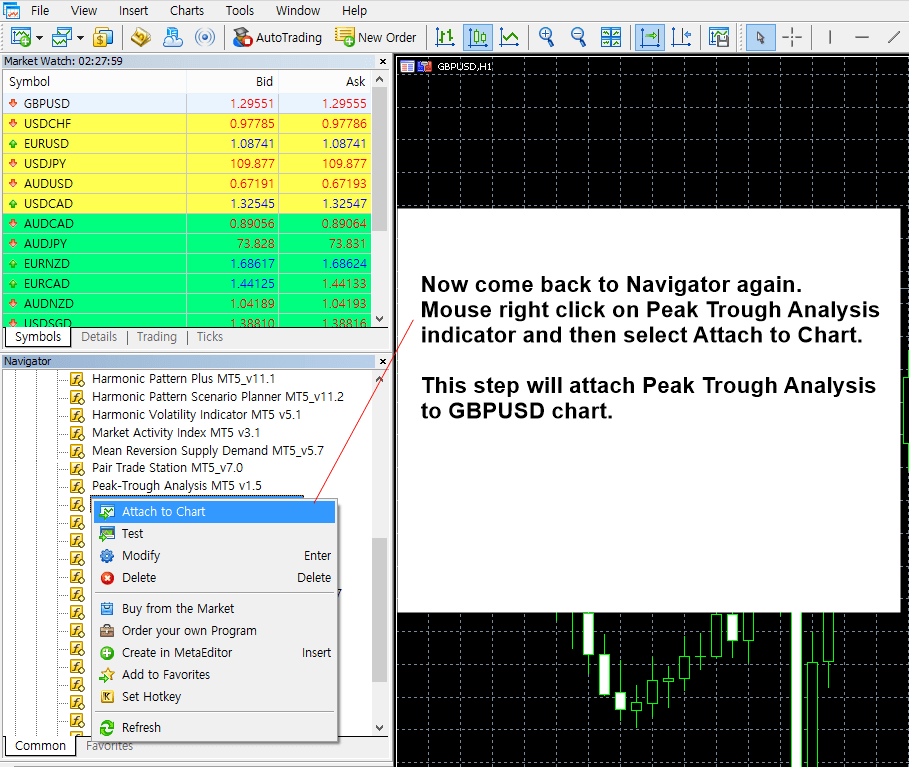
Now go back to the Navigator. Select Peak Trough Analysis indicator with mouse right click. Then click on Attach to chart. This step will attach this indicator to GBPUSD hourly chart, which was opened in our previous step.
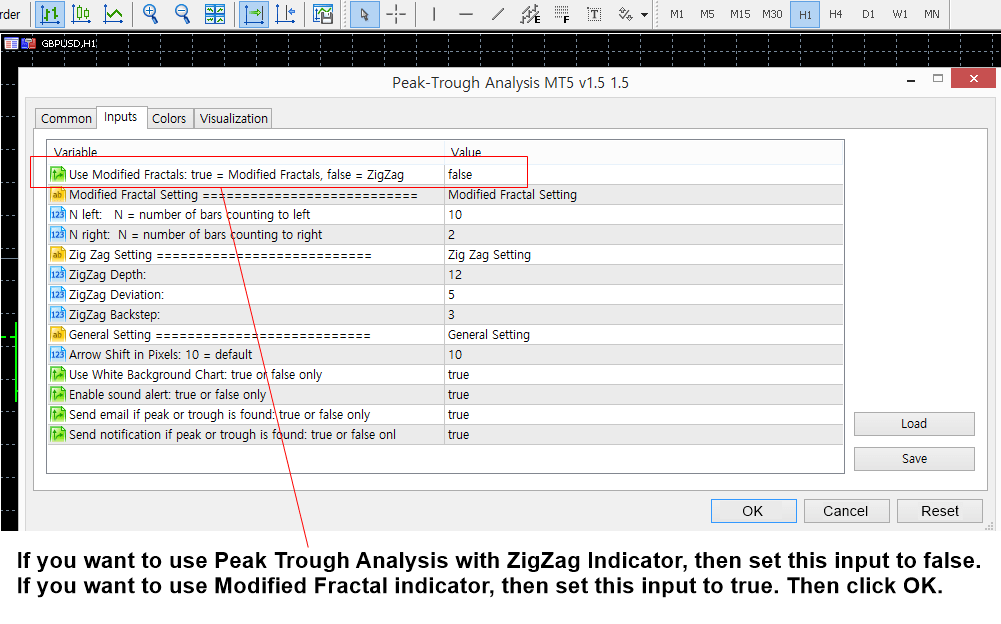
Clicking on Attach to Chart will pop up Property Window for the indicator. In this property window, you can select various setup according to your preference. Especially, Peak Trough Analysis can be run under three different mode.
1. ZigZag indicator mode
2. Modified Fractal Indicator mode
3. Original Fractal Indicator mode
To run it as ZigZag indicator mode, set the first input to false. If you want to run it as modified fractal indicator mode, then set the first input to true. If you want to run it as original fractal indicator mode, then set the first input to true and set N left = 2 and N right = 2. We have explained all these modes in detailed in the book: Scientific Guide to Price Action and Pattern Trading. If you need the details of each mode, then please refer to the book.
Click OK button, then we are done. Now you should be able to see Peaks and Troughs detected in chart window. As we have explained in the book, these peaks and troughs are the important basis for various price detection and the trading strategies associated with those price patterns.

About this Article
This article is the part taken from the draft version of the Book: Profitable Chart Patterns in Forex and Stock Market (Fibonacci Analysis, Harmonic Pattern, Elliott Wave, and X3 Chart Pattern). This article is only draft and it will be not updated to the completed version on the release of the book. However, this article will serve you to gather the important knowledge in financial trading. This article is also recommended to read before using Harmonic Pattern Plus, Harmonic Pattern Scenario Planner and Profitable Pattern Scanner, which is available for MetaTrader or Optimum Chart.
Below is the landing page for Harmonic Pattern Plus, Harmonic Pattern Scenario Planner and X3 Chart Pattern Scanner in MetaTrader. All these products are also available from www.mql5.com too.
https://algotrading-investment.com/portfolio-item/harmonic-pattern-plus/
https://algotrading-investment.com/portfolio-item/harmonic-pattern-scenario-planner/
https://algotrading-investment.com/portfolio-item/profitable-pattern-scanner/
Below is the landing page for Optimum Chart (Standalone Charting and Analytical Platform).
https://algotrading-investment.com/2019/07/23/optimum-chart/
Related Products


