Trading Strategy with Fractal Pattern
In this article, we will explain about what is the Fractal Pattern and How we can use the Fractal Pattern to trade in Forex and Stock market. Simply speaking, a fractal trading strategy is a way of trading based on repeating patterns in price movements. The fractal Trading strategy uses fractal indicators to identify reversal points and enter trades when the price breaks out of the fractal formation. When the same or similar geometric shape is repeating infinitely in different scales, we call it “Fractal”. The self-similarity is the typical property of fractal. Fractal can be observed everywhere in the universe. In the space, tree, human anatomy, mountain, and, coast, we can observe fractal. For example, in the Romanesco Broccoli, the smaller piece, if they are broken off from the bigger piece, do look like the big piece. Like this, in Fractal, the same or similar patterns are occupying the entire structure of an object.
Another example of fractal in nature is a coastline. The coastline shows the similar details on different scales. The waves provide a steady force to shape the coastline over time. When the coastline is straighter, the waves will keep pounding until they become more fractal. This mechanism cut the straighter line of coastline more wobbly in the zigzag pattern. Then, the straighter line inside the zigzag line will be cut into the smaller zigzag pattern. As a result, the coastline will look similar whether you zoom in or zoom out in the map.
If you still found it difficult to understand fractal, then let us introduce more straightforward example. For example, Sierpinski triangle is good example of self-similarity and fractal. Sierpinski triangle is made up from identical shape, the triangle. In Sierpinski triangle, the triangle is continuously expanding to build the bigger triangle. As we magnify any part of Sierpinski triangle, we see the identical triangles. Hence, Sierpinski triangle is one of the good example to explain fractal.
Beside Sierpinski triangle, snowflake, heartbeat rate, structure of brain and, internal organs are another examples of fractal too. Fractals can be classified into few different types depending on the degree of the self-similarity. For example, when the repeating geometry is strictly identical like snowflake and Sierpinski triangle, we call them as the strict self-similarity. When the repeating geometry is similar but not identical like coastline and heartbeat rate, we call them as the loose self-similarity. This loose self-similarity is often referred to as the statistical self-similarity because we can observe the repetition in the degree of complexity within statistical range not the exact pattern.
Price data in the financial market represent fractal with the loose self-similarity. In “The Misbehavior of Markets: A Fractal View of Financial Turbulence”, Benoit Mandelbrot and Richard L. Hudson applied the fractal theory to understand the financial market. They explained that the financial market can impose a greater risk than it can be explained by the modern mathematical assumption. In addition, they believed that the financial market possess a memory. As a result, the similar events in the financial market can repeat in certain rhythm.
With the assumption that price continuously rises and falls, then the price can behave like fractal. Either we connect a peak, trough, and peak or we connect a trough, peak, and trough, it would form a triangle. Like other fractal object, the small triangles will form the bigger triangle. Eventually, the entire historical price would be described as one or two big triangles. The price data in the financial market possess the property of the loose self-similarity than the strict self-similarity. More precisely, since the price is recorded over time, we can call it as “Fractal Wave”.
Fractal-Wave process is the basis for many popular trading strategies like Elliott Wave, Harmonic patterns, triangle and wedge patterns. However, these trading strategies were not well connected to existing science in the past. This was one of the important motivation for myself to step up to write and to connect these trading strategies into existing science. Most of time, day traders were referencing that these strategies will work because market repeats themselves. For me, this explanation would be not enough before I make the full time commitment on them.
Therefore, I had to do a lot of research to find the origin of these trading strategies and to see real value behind them. From my research, most likely, the repeating patterns in these strategies come from Fractal-Wave. I was very happy initially until I found that there is big difference between the underlying concepts of these trading strategies and Fractal-wave itself.
With heart beat signal, you might think that it would look similar to Stock or Forex market data but different in some ways. If you felt this way, you are very correct. Here is the main difference. Heartbeat signal seems to have fixed mean or horizontal patterns as we described in Stationary process in Chapter 5. However, EURUSD price series or S&P 500 series do not show any noticeable horizontal patterns. With human, the heartbeat increases dramatically to get more blood out during intensive activity like sprinting, but they must come back to normal range to maintain our life. Naturally, this makes up the horizontal patterns as we described in Stationary process. On the other hands, the operational range of the financial market does not have to create the horizontal patterns as if heartbeat does. Firstly, financial market is designed to grow or decline with time. Secondly, the underlying fundamental drives the rise and fall of the financial market towards unknown destination.
With human, we know that our heartbeat rate must be kept between 60 and 100 times per minute. While you are a living man, this normal range is the destination of your heartbeat rate most of time. It is very predictable that your heartbeat will come back to 80 times per minute once it hits 130 times per minute. In the financial market, the final destination is not known and open. Even if S&P500 hits 3000 points tomorrow, we are not sure if it would even come back to 1000 points next year or ever. Hence, we are talking about similar but very different type of Fractal-Wave. Fractal wave alone can not explain the difference between these two. In the past, many day traders were having misleading picture between fractal wave and these trading strategies because no one or no literature attempted to give clear or easy explanation on them. This was another motivation for me to write this book too.
The open and unknown destination of the financial market is there because the underlying fundamental drives the market towards the price level, at which majority of people think it is most reasonable. In another words, market will move towards the equilibrium price. We have covered this in Equilibrium process in Chapter 8. Financial market is not only made up from Fractal-Wave but with Equilibrium process too. Hence, this is why financial market is different from heartbeat series although both have fractal wave in them. We have just pinned down the important concept of Equilibrium Fractal Wave process. In next two chapters, we will take you to the details of Equilibrium Wave process and Equilibrium Fractal Wave process to give you the complete and systematic view of the trading strategy and financial market.
Analytical Note
In the Fractal Geometry, two important quantifiable properties are fractal dimension and self-similarity. Fractal dimension is a measure of how much an N dimensional space is occupied by an object. For example, a straight line have dimension of 1 but a wiggly line has a dimension between 1 and 2. More precisely, their Fractal Dimension can be expressed as Log (N)/Log (r) where N = number of self-similar pieces and r = linear scale factor. Now to illustrate the concept, we will present the four cases from dimension 1 to 2. If we reduce size of straight line by linear scale factor r = 2, then then we get two self-similar piece, N = 2. Therefore, the dimension of the straight line is 1.
Likewise, if we remove the middle third of the straight line and replace it with two lines with the same length, then we get the first iteration of the Koch Curve. In this example, for the linear scale factor r = 3, we get the four self-similar pieces. Therefore, the dimension of Koch Curve is 1.26816 = Log (4) / Log (3).
Sierpinski Triangle is another good example of Fractal Geometry. If we connect the mid points of the three side inside an equilateral triangle, then we get 3 equilateral triangles inside the first equilateral triangle. Note that we do not count the resulting upside down triangle as a self-similar piece. In this case, the linear scale factor r is 2 since generated triangle have the half of the width and height. The Fractal dimension D = 1.585 = Log (3)/ Log (2).
Finally consider a square. For the linear scale factor r = 2, we will get four squares inside the first one. Therefore, our fractal dimension for a square is D = 2 = Log (4) / Log (2). Even we make the linear scale factor r = 3, we still get the same Fractal dimension D = 2 = Log (9) / Log (3). As we have illustrated in the four examples, Fractal Dimension generalize the topological integer dimensions to a fraction. Higher the fractal dimension means that the fractal geometry to occupy more space in the dimension. Therefore, a square have the Fractal Dimension 2 as the smaller square fits larger one without leaving any empty space. If our fractal geometry is kept removing space, then we could get the Fractal Dimension less than 1 too.
If the fractal geometry is known like our four examples above, then calculating Fractal dimension for that fractal geometry is straightforward. However, in many practical applications, the self-similar patterns are not strict and difficult to identify. For example, the rocky coastline have the fractal dimension with near self-similarity. In such a case, we can still calculate the Fractal Dimension using some iterative methods. To calculate the length of wiggly line in the rocky coastline, one can measure the length by counting how many times a measuring stick with a known length can be fitted along the coastline: L(s) = N x s. By plotting the length of the coastline versus the length of the measuring stick on a double logarithmic scale, one obtains the following equations to calculate the Fractal Dimension for the coastline: Log (L (s)) = (1-D) Log (s) + constant. Therefore, the measured slope can be used to calculate the Fractal Dimension.
For Great Britain, the Fractal dimension can be calculated as D = 1 – (-0.24) = 1.24. Higher the Fractal Dimensions means greater the jaggedness or non-smoothness of the coastline. Calculating the Fractal Dimension for financial market data is not easy because it is harder to use such a measuring stick to measure the length of the line. Alternatively one might use Hurst Exponent (H) to calculate Fractal Dimension (D = 2–H) for a rough estimation of Fractal Dimension. Table 8-1 shows Hurst Exponents for several international Stock and Currency pairs. Using the relationship between Hurst Exponent and Fractal dimension, we can find that Fractal Dimension for many stock index lies somewhere between 1.2 and 1.5. Of course, this is very rough estimation only with some margin of error. Considering our four example earlier, we can imagine that the complexity of the financial price series might lies between Koch Curve and Sierpinski Triangle.
Fractal Pattern Indicator allow you to analyze the multiple of Fractal Cycles. We provided the Fractal pattern indicator with Fractal Moving Average Indicator together. Fractal Pattern Indicator provides the potential of trading with following approaches.
1. Statistical arbitrage (need to explain more later)
2. Structural break (need to explain more later)
3. Helping to detect more accurate rising wedge, falling wedge and triangle patterns
4. Improving Harmonic Pattern and X3 pattern trading with probability filter
5. Trading with Jagged Fractal Pattern with high turning point chance
6. any other innovative methods
In this article, we will be explaining you the trading strategy 5, Trading with Jagged Fractal Pattern with high turning point chance. It is simply because it is easy to trade and powerful.
Here is simple instruction of finding good trading opportunities using Jagged Fractal Pattern with high turning point chance. You will follow these two steps to look for the trading opportunity.
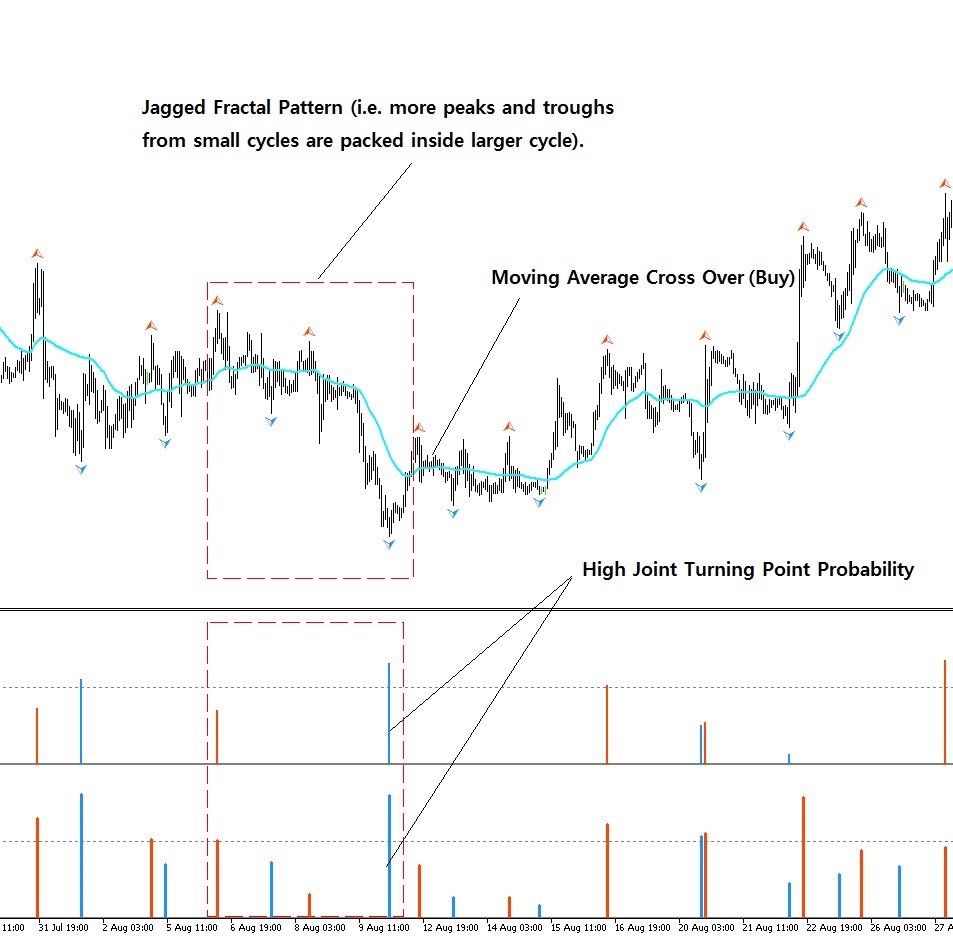
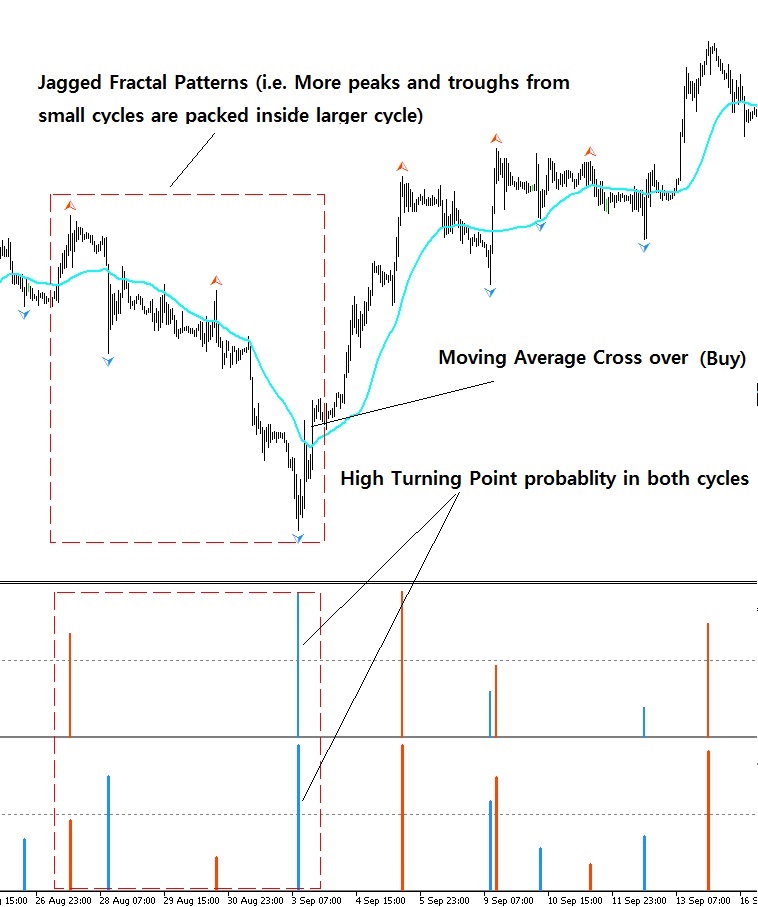
Step 1. Look for high probability in small and large cycles in price and time
Step 2. Look for jagged Fractal patterns that more number of peaks and troughs are packed inside large cycle.
In step 1, you can use Joint Probability matrix provided from Fractal Pattern Indicator. However, if you are not familiar with the concept, then just look for high probability in small and large cycles in price and time. Because they are the similar thing really.
Here I provide the two bullish trading examples. To check the timing, you can use Fractal Moving Average cross over as it was shown in this example. In this example, I have switched off the cross over signal from Fractal Moving Average indicator to keep the clear view on the chart.
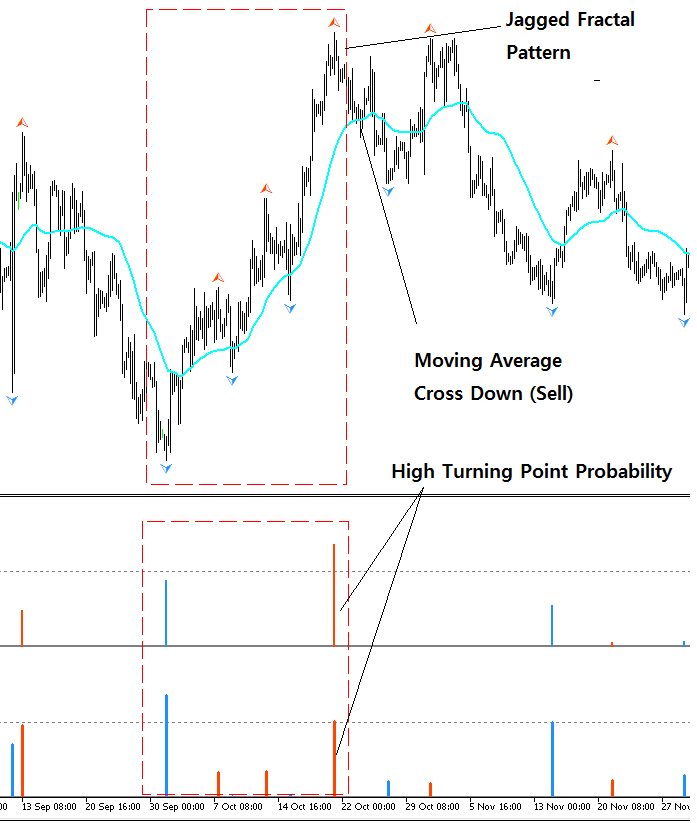
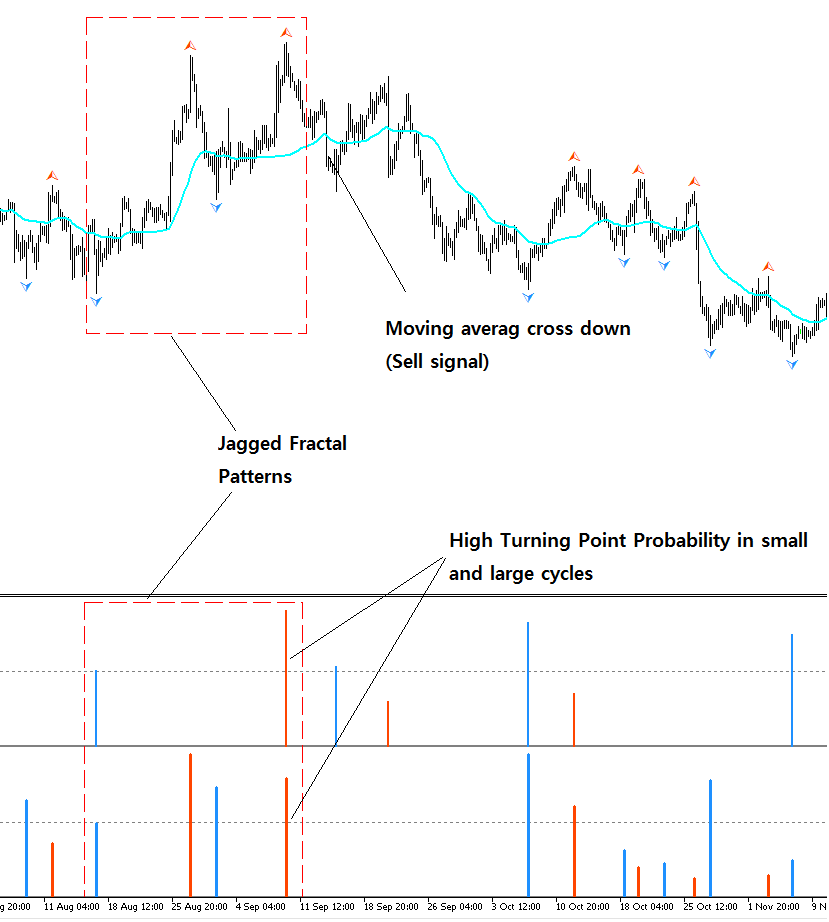
Here I provide the two bearish trading examples. To check the timing, you can use Fractal Moving Average down over as it was shown in this example. In this example, I have switched off the cross over signal from Fractal Moving Average indicator to keep the clear view on the chart.
Further tips of trading with Jagged Fractal patterns.
You might able to play around the turning point before Fractal Moving Average cross over or down happens using Fibonacci retracement or other turning point prediction techniques like Harmonic Pattern and X3 patterns. However, do not forget that your aim is to catch the large trend (i.e. momentum).
In addition, it must be jagged fractal pattern you have to trade with. Ignore the pattern if small and large cycles provides same size of fractal patterns.
Here is the landing page to our Fractal Moving Average Indicator (Free for everyone with some limitation for free users.)
https://www.mql5.com/en/market/product/46277
https://www.mql5.com/en/market/product/46276
https://algotrading-investment.com/portfolio-item/fractal-moving-average-indicator/
Here is the landing page to our Fractal Pattern Indicator (Paid Indicator)
https://www.mql5.com/en/market/product/49170
https://www.mql5.com/en/market/product/49169
https://algotrading-investment.com/portfolio-item/fractal-pattern-scanner/
Related Products


