Fractal Wave, Mother Wave, and Child Wave
Once we have transformed the price series into triangles using Peak Trough Analysis, we are almost ready to study the price patterns using the ratio and size variable. However, before we do that, you need to understand these triangles generated from Peak Trough Analysis are Fractal Pattern. In Fractal Pattern, the same or similar geometric shape is repeating infinitely in different scales. In another words, with Fractal pattern, we are likely to see the same or similar pattern when we magnify the part of pattern. In the Romanesco Broccoli, the smaller piece, if they are broken off from the bigger piece, do look like the big piece. Like this, in Fractal Pattern, the same or similar patterns are occupying the entire structure of an object.
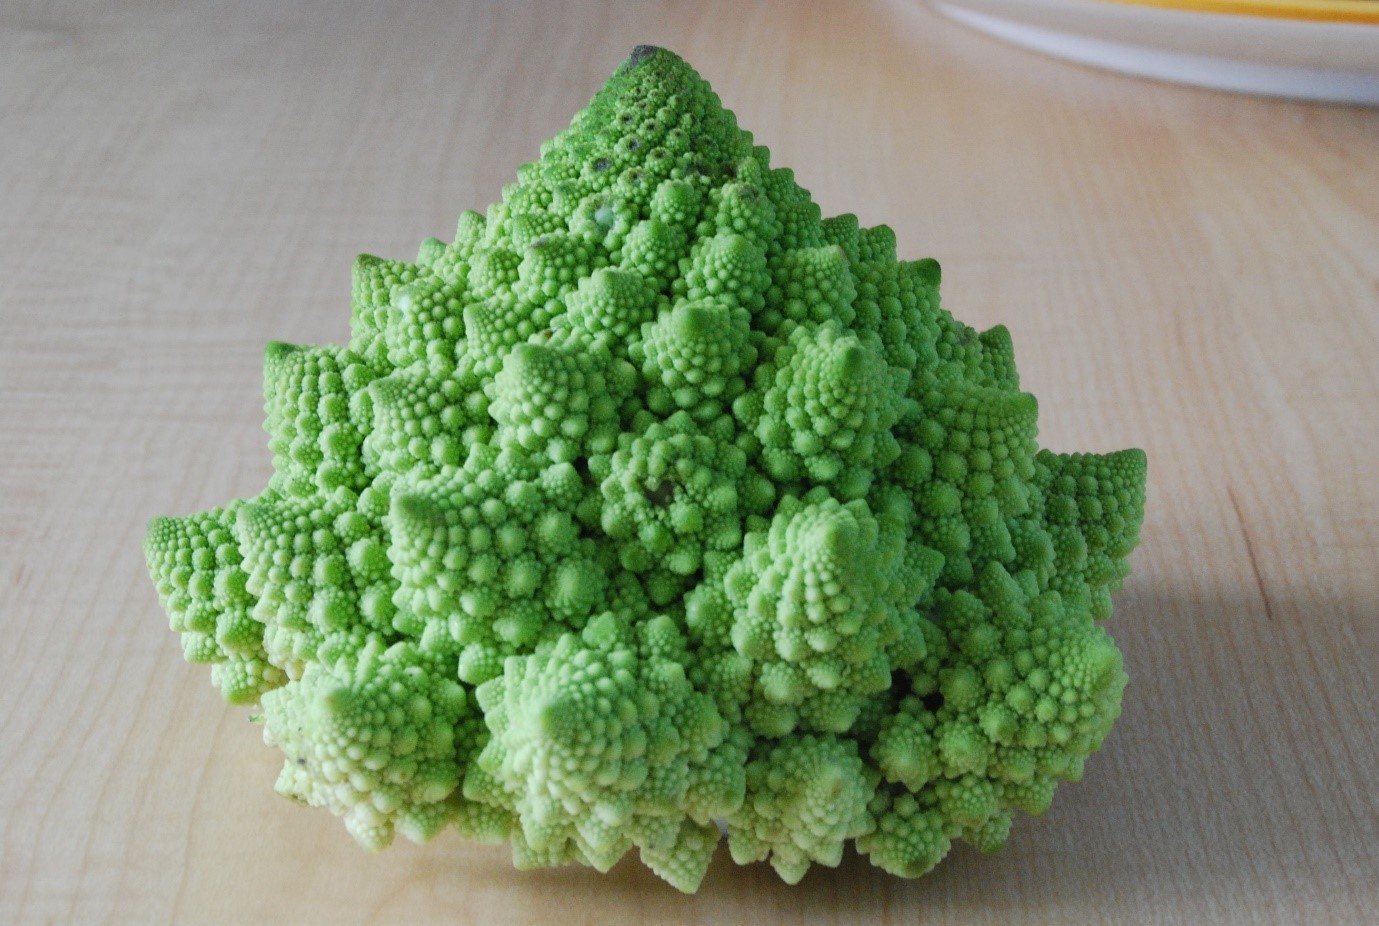
Figure 1.3-1: Picture of Romanesco Broccoli
There are few different types of Fractal Patterns. When the same geometric pattern is repeating, we call this as a strict self-similarity. For example, Sierpinski triangle is good example of strict self-similarity in Fractal pattern. In Sierpinski triangle, the triangle is continuously expanding to build bigger triangle. As we magnify any part of Sierpinski triangle, we see the identical triangles.
Figure 1.3-2: Sierpinski triangle in 2D space
On the other hands, fractal pattern can have a loose self-similarity structure. For example, the simplest form of loose self-similarity can be found in coastline. As we magnify a segment of coastline, we do not expect to see an identical copy of original coastline but rather similar shapes. Instead, we can observe that the same statistical properties are preserved across scales. In nature, loose self-similarity is more common.
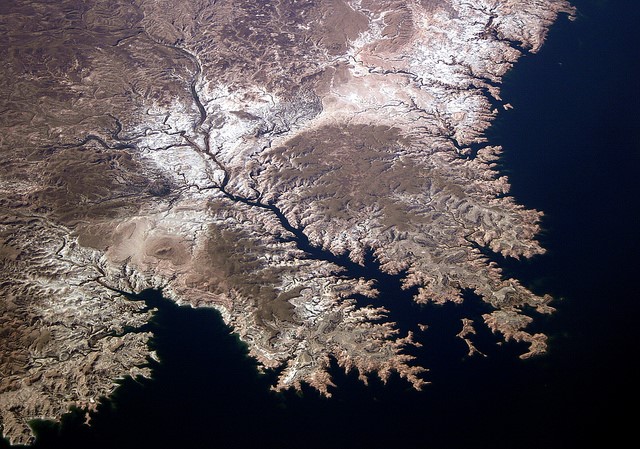
Figure 1.3-3: Picture of Coastline
As you might guess, financial market represents fractal pattern with the loose self-similarity. For example, when we apply the Peak Trough Analysis, the triangles are not identical but they are rather similar. As you can see from Figure 1.3-4, each triangle is not strictly identical but they are triangles with different angles. Typically, fractal patterns in nature expand its geometry in two or three dimension in space. In the financial market, the fractal patterns are expanding in the two dimension of price and time. Hence, fractal pattern in the financial market can be considered as fractal wave. In another words, it is some sort of cycles. This inclusion of time dimension makes the fractal pattern in financial market special. What this means is that to predict financial market, we need to consider size and ratio in time dimension too as well as price dimension.
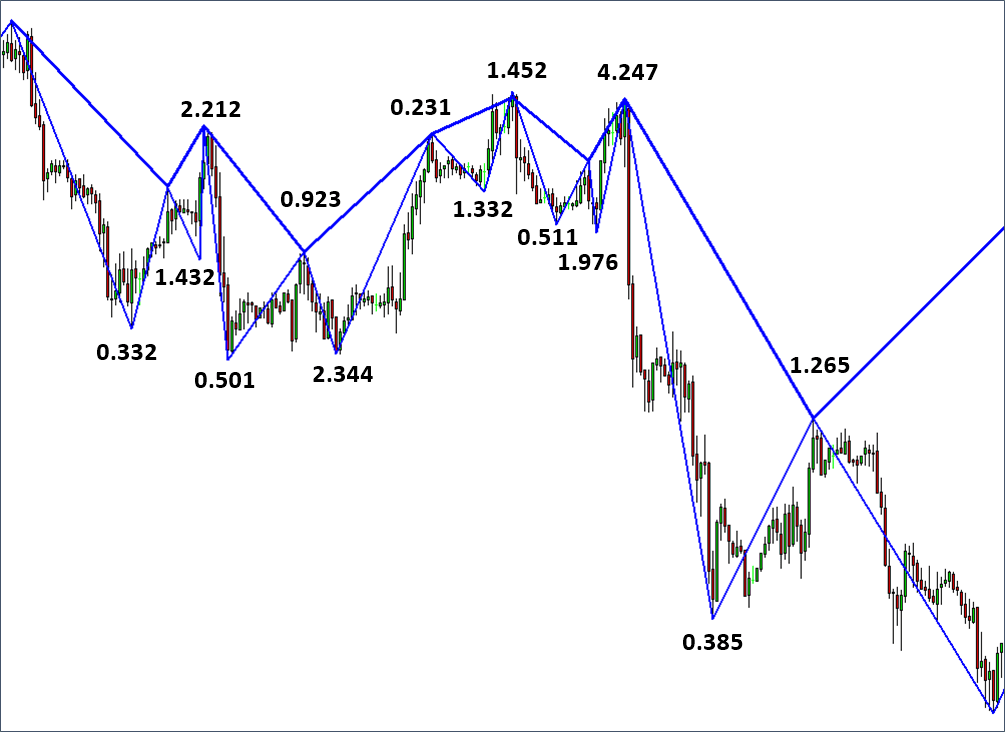
Figure 1.3-4: Fractal triangles made up from peak and trough in EURUSD
To give you better idea of fractal wave in financial market, consider Peak Trough Analysis with grid spacing of 2 (Figure 1.3-5). In this fine grid spacing, we can observe many triangles in the smaller scale. As we increase our grid spacing to 4, we can see less number of bigger triangles in comparing to grid spacing 2. Now, we can tell that scale of triangles is bigger with grid spacing 4. However, are these big triangles new? No, these big triangles are made up from small triangles in the grid spacing of 2. If we keep increasing the grid spacing, then eventually we will see one big triangle spans from the beginning to the end of price series.
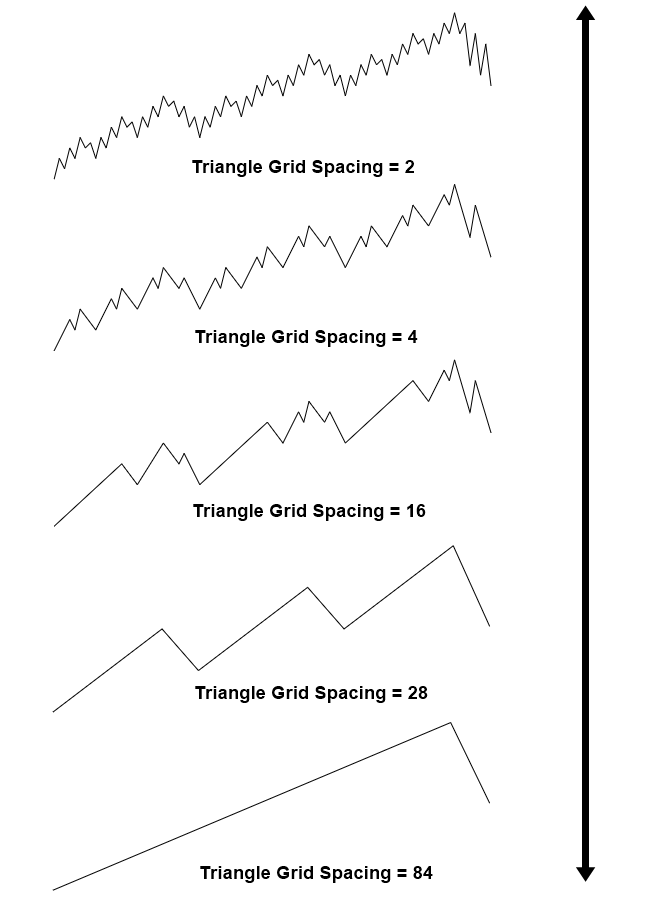
Figure 1.3-5: Demonstration of fractal triangles in multiple scales
Grid spacing example implies that combination of several small fractal wave can form the bigger fractal wave. The grid spacing example shows that there is mother wave and child wave relationship existing between fractal waves in different scales. For example, consider a fractal wave with following swing high and swing low properties:
- Price for swing high = 1000 points
- Price for swing low = 600 points
- Time for swing high = 7 days
- Time for swing low = 4 days
Under this fractal wave, we can have seven smaller fractal waves. In our example, mother wave is bigger wave and child waves are seven smaller fractal waves. Number of child wave is just randomly chosen in this example. Sometimes, we can have five child waves inside one mother wave. Sometimes, we can have only three child waves inside mother wave. In addition, the shape of mother wave in this example is random too. We can have all sort of triangle shapes for mother waves and so does for child waves. The relationship of mother wave and child wave is relative. The mother wave in this example can be the child wave of other bigger fractal wave. Likewise, the seven child waves in this example can be the mother waves of other child waves. Hence, this is the fractal patterns that repeating infinitely in different scales.
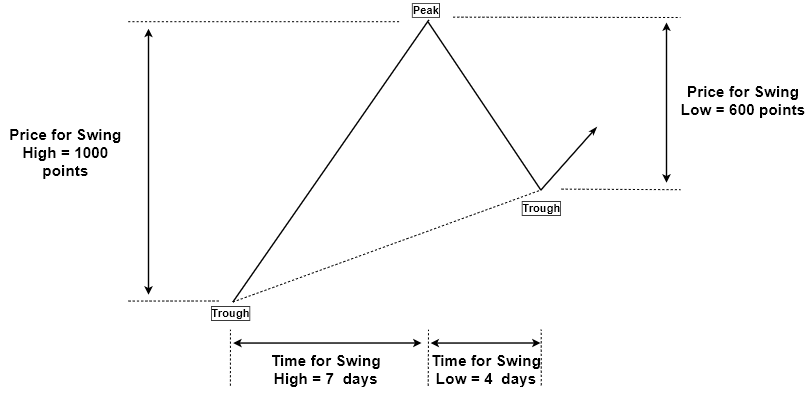
Figure 1.3-6: Mother wave measured in price and time
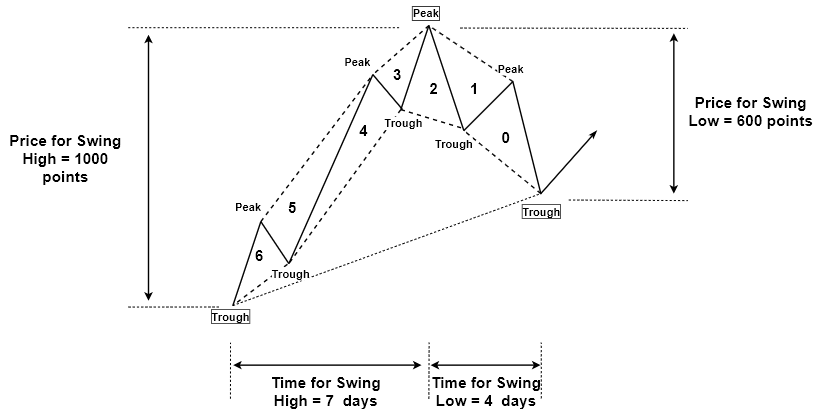
Figure 1.3-7: Seven child waves inside one mother wave
Understanding the fractal wave can be challenging for now. However, you might be thankful to the existence of the fractal wave for your trading because there is only one geometric shape you have to concern throughout different scales. It is not that you have to concern triangle, rectangle, curve, or any other random polygon in our prediction. In the case of financial market, it is the triangle shape, which we have to concern only. In another words, fractal pattern, as well as fractal wave, is efficient in terms of memory. In scientific and engineering world, fractal geometry is often used to compress large size of data into smaller size. For example, as long as you capture the detail of mother pattern that encloses child patterns, you are able to construct entire scales of fractal patterns. This is the useful property in many industrial applications.
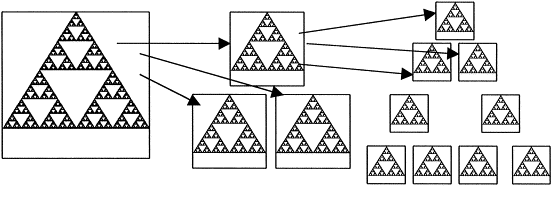
Figure 1.3-8: Decompression example using Sierpinski triangle in image processing
Another important point behind the mother wave and child wave is that in history, many legendary traders often spot the price patterns as in mother wave that are made up from smaller child waves. For example, Elliott Wave, Gartley, and Butterfly Pattern are the good example of mother wave and child wave. Existence of child wave inside mother Wave does not alter our geometric prediction equation defined in the first chapter. However, on top of the size and ratio variable, we need to consider the joint effect between small and large fractal waves. Understanding the joint effect is one important reason why some might be successful in trading whereas some might be unsuccessful in trading. You can not ignore this joint effect because we are dealing with fractal patterns that are infinitely repeating in different scales. Hence, your success in financial market is highly related to your understanding of this joint effect between small and large waves.
Some More Tips about Fractal Wave, Mother Wave, and Child Wave
In Forex trading, the concepts of Fractal Wave, Mother Wave, and Child Wave are derived after Elliott Wave Theory, which proposes that market movements unfold in repetitive patterns or waves. Each wave has specific characteristics and plays a role in identifying trends and potential reversal points. Here’s how these concepts are applied in Forex trading:
Fractal Wave:
- Definition: A Fractal Wave refers to the overall structure of price movements in the market, consisting of multiple smaller waves within a larger trend. It represents the fractal nature of market dynamics, where patterns repeat across different time frames.
- Characteristics: Fractal Waves exhibit self-similarity, meaning that the same patterns occur at different scales or time frames. They consist of alternating waves of impulse (trend-following) and corrective (counter-trend) movements, forming a complete cycle of market behavior.
- Application: Traders analyze Fractal Waves to identify the overall direction of the market trend and anticipate potential turning points. By understanding the structure of Fractal Waves, traders can make informed decisions about when to enter or exit trades based on the prevailing market dynamics.
Mother Wave:
- Definition: The Mother Wave refers to the larger, primary trend in the market. It represents the dominant directional movement that traders aim to identify and capitalize on for profits.
- Characteristics: The Mother Wave typically consists of multiple Elliott Wave impulse waves in the direction of the primary trend. These waves represent the strong, sustained movements that drive the market in the direction of the prevailing trend.
- Application: Traders focus on the Mother Wave to determine the overall trend direction and trade in alignment with it. By identifying the Mother Wave, traders can ride the primary trend and avoid getting caught in counter-trend movements that may occur within the larger trend.
Child Wave:
- Definition: The Child Wave, also known as a corrective wave, is a smaller counter-trend movement within the larger trend represented by the Mother Wave. It is a temporary interruption or correction against the primary trend.
- Characteristics: The Child Wave often appears as a smaller-scale correction within the larger trend, typically taking the form of Elliott Wave corrective patterns such as zigzags, flats, or triangles. It tends to be shorter in duration and magnitude compared to the primary trend represented by the Mother Wave.
- Application: Traders pay attention to the Child Wave to identify potential opportunities for entering trades in the direction of the larger trend. By understanding the characteristics of the Child Wave, traders can look for confirmation signals and timing indicators to enter trades with favorable risk-reward ratios.
By incorporating the concepts of Fractal Wave, Mother Wave, and Child Wave into their analysis, Forex traders aim to identify trends, anticipate potential reversals, and make informed trading decisions based on the underlying market dynamics. These concepts provide a framework for understanding the complex nature of price movements in the Forex market and help traders navigate the challenges of trading with greater confidence and consistency.
About this Article
This article is the part taken from the draft version of the Book: Predicting Forex and Stock Market with Fractal Pattern. This article is only draft and it will be not updated to the completed version on the release of the book. However, this article will serve you to gather the important knowledge in financial trading. This article is also recommended to read before using Fractal Pattern Scanner, which is available for MetaTrader or Optimum Chart.
Below is the landing page for Fractal Pattern Scanner for MetaTrader 4 and MetaTrader 5. The same products are available on www.mql5.com too.
https://www.mql5.com/en/market/product/49170
https://www.mql5.com/en/market/product/49169
https://algotrading-investment.com/portfolio-item/fractal-pattern-scanner/
Below is the landing page for Optimum Chart
https://algotrading-investment.com/2019/07/23/optimum-chart/
Related Products


