Turning Point, Peak, Trough, Swing High, Swing Low, and ZigZag
To recognize the geometric shape in our chart, we need a measurable object. In financial market, the geometric recognition is done in the two dimension of price and time. Price is usually placed in Y axis and time is usually placed in X axis. In financial market, we recognize the geometric shapes in the candlestick chart. Some might use range bar chart. In this book, we will be using candlestick chart most of time because they are easy to read.
When we look at the plain chart, we can recognize almost nothing. It is because we do not know which object we will be studying in the continuous price series. For an object to be measurable, the object requires boundary or outline. Hence, to recognize any geometric shapes in our chart, we need a good logic of dividing the continuous price series into some measurable objects. Typically, it is best to start with Peak Trough Analysis.
![]()
Figure 1.2-1: Empty EURUSD H1 chart
In Peak Trough Analysis, we define peak and trough in an alternating manner. The analysis will start from oldest price data to latest price data. If we start with peak, then we will detect trough, peak, trough, peak, and so on to the right. If we start with trough, then we will detect peak, trough, peak, trough, and so on to the right. Each peak and trough requires having the certain distance in price and time as shown in Figure 1.2-2. Doing this manually could be quite tedious. Fortunately, there is a Zigzag indicator available everywhere to do this task automatically. At the same time, we provide Peak Trough Analysis free for audience of this book. Please refer to the downloading guide for Peak Trough Analysis tool in this book.
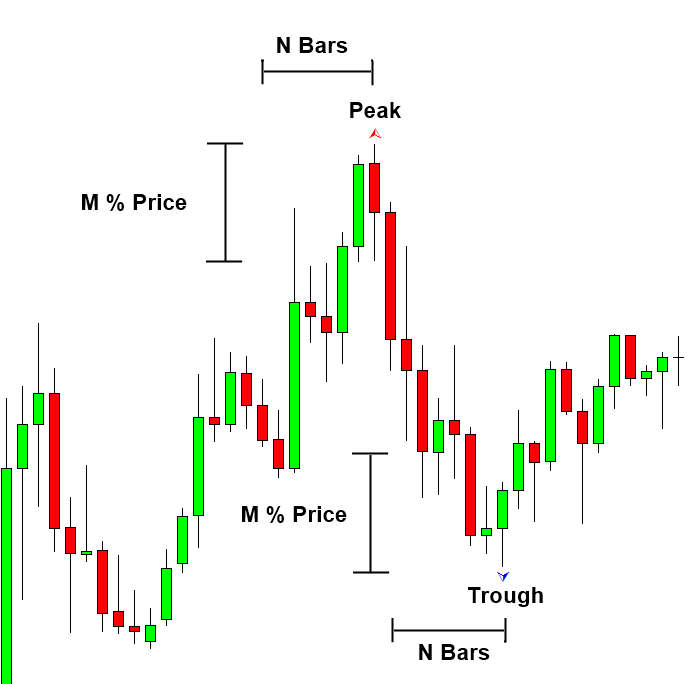
Figure 1.2-2: Definition of peak and trough in candlestick chart
Once the Peak Trough Analysis is done, your chart will look like this. What peak trough analysis is doing here is that turning the continuous price series into many triangles. Three points are equivalent to one triangle. For example, a set of peak, trough, and peak can form one triangle. Likewise, a set of trough, peak, and trough can form one triangle too. When we just label peak and trough, you might notice the presence of these triangles (Figure 1.2-3). However, if we provide the outline to each triangle, then you could see them more clearly (Figure 1.2-4).
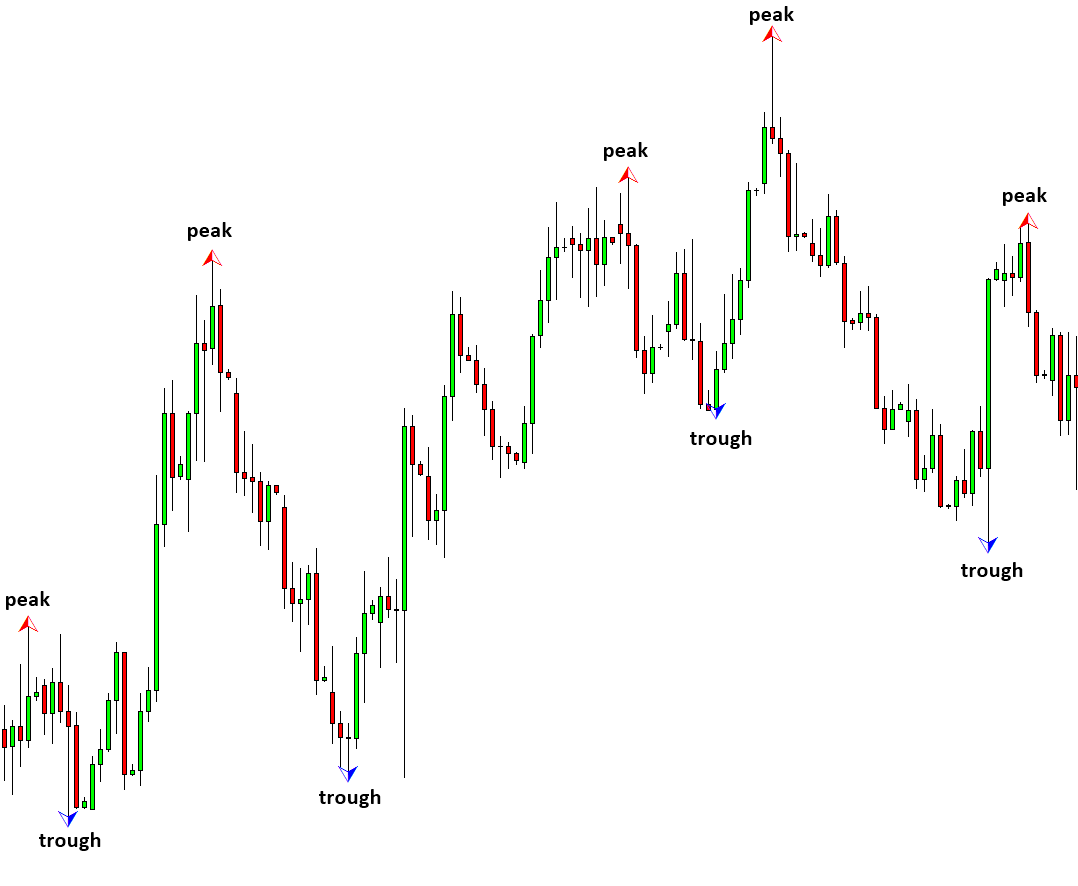
Figure 1.2-3: Peaks and troughs detected in EURUSD Daily chart
The triangles created from Peak Trough Analysis is now measurable because they have triangular boundary (i.e. outline). In financial trading, we use these triangles to make the geometric prediction. Hence, Peak Trough Analysis is the important preliminary analysis to start with.
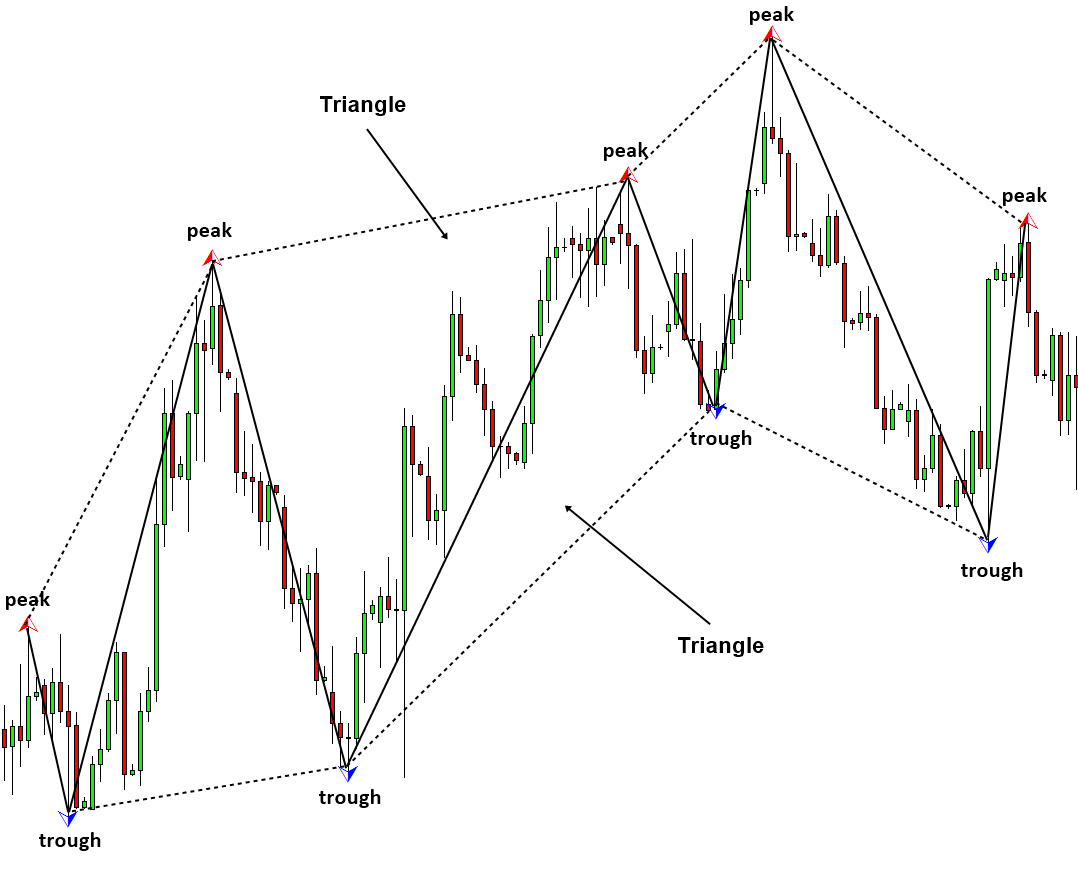
Figure 1.2-4: Triangles made up from peaks and troughs in EURUSD Daily chart
So far, we have covered definition of peak and trough in our chart. In the trading community, trader tends to use swing high and swing low instead of the term “Peak” and “Trough”. Hence, many traders interchangeably use swing high with peak. Likewise, people interchangeably use swing low with trough too.
At the same time, people can use the term “Turing Point”. “Turing Point” is slightly different because “Turning Point” includes both peak and trough. It is like the word limb including both arms and legs. In addition, people might use the term “zigzag” in place of turning point. This is probably inspired from the Zigzag technical indicator. The term “zigzag” also includes both peak and trough. Each terminology can be used in slightly different context elsewhere. For example, Peak and trough are the terms used in many scientific literature whereas swing low and swing high are specific in trading community. However, in this book, we might use these terms interchangeably.
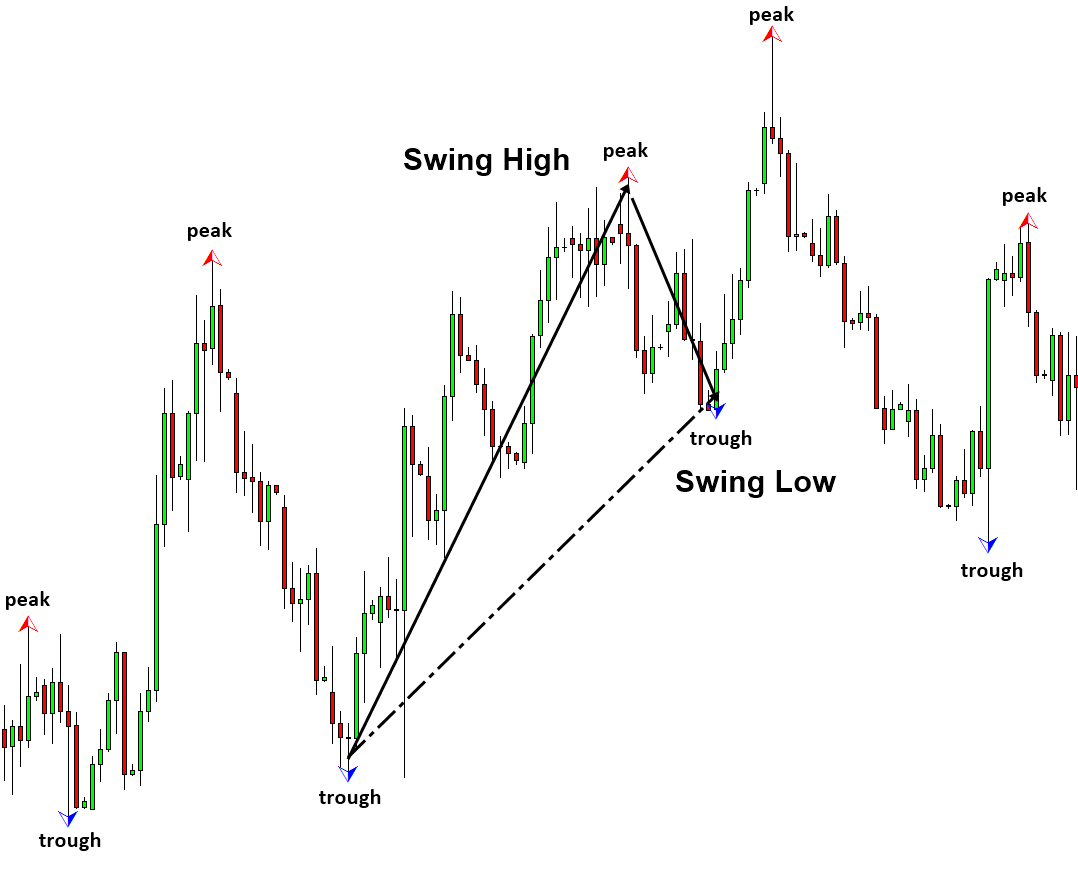
Figure 1.2-5: Swing high and swing low
| Peak | Trough |
| Swing High | Swing Low |
| Turning Point | Turning Point |
| ZigZag point | ZigZag point |
Table 1.2-1: List of words describing peak and trough in the financial market
Some More Tips about Turning Point, Peak, Trough, Swing High, Swing Low, and ZigZag in Forex
In Forex trading, understanding key price levels and patterns is crucial for making informed trading decisions. Here are explanations of some essential concepts about Turning Point, Peak, Trough, Swing High, Swing Low, and ZigZag in Forex Trading.
Turning Point:
- Definition: A Turning Point is a specific price level at which the direction of price movement changes, signaling a potential reversal in the market trend. Turning points can occur at peaks (high points) or troughs (low points) in the price chart.
Peak:
- Definition: A Peak, also known as a Swing High, is the highest point reached by the price during a particular time period. It represents a temporary resistance level where buying pressure becomes exhausted, leading to a potential reversal or consolidation in the price.
Trough:
- Definition: A Trough, also known as a Swing Low, is the lowest point reached by the price during a particular time period. It represents a temporary support level where selling pressure becomes exhausted, leading to a potential reversal or consolidation in the price.
Swing High:
- Definition: A Swing High is a peak or high point in the price chart that is higher than the price points immediately preceding and following it. Swing highs are often used by traders to identify potential resistance levels and to gauge the strength of the prevailing trend.
Swing Low:
- Definition: A Swing Low is a trough or low point in the price chart that is lower than the price points immediately preceding and following it. Swing lows are often used by traders to identify potential support levels and to gauge the strength of the prevailing trend.
ZigZag:
- Definition: ZigZag is a technical indicator that helps traders identify trends and significant price movements in the market. It connects swing highs and swing lows with straight lines, highlighting the peaks and troughs in the price chart. ZigZag can filter out smaller price movements and focus on larger, more significant price swings.
In Forex trading, traders use these concepts to identify potential entry and exit points, set stop-loss and take-profit levels, and gauge the strength of market trends. By analyzing turning points, peaks, troughs, swing highs, swing lows, and ZigZag patterns, traders can develop effective trading strategies and make more informed decisions based on price action and market dynamics.
About this Article
This article is the part taken from the draft version of the Book: Predicting Forex and Stock Market with Fractal Pattern. This article is only draft and it will be not updated to the completed version on the release of the book. However, this article will serve you to gather the important knowledge in financial trading. This article is also recommended to read before using Fractal Pattern Scanner, which is available for MetaTrader or Optimum Chart.
Below is the landing page for Fractal Pattern Scanner for MetaTrader 4 and MetaTrader 5. The same products are available on www.mql5.com too.
https://www.mql5.com/en/market/product/49170
https://www.mql5.com/en/market/product/49169
https://algotrading-investment.com/portfolio-item/fractal-pattern-scanner/
Below is the landing page for Optimum Chart
https://algotrading-investment.com/2019/07/23/optimum-chart/
Related Products


