Fractal Pattern Strategy Guide
Fractal Pattern is the technical analysis with high predictive power when it comes to Forex and Stock trading rather than any other subjects. It explain the evolution of the price movement behind stock and forex market. Once we have transformed the price series into triangles using Peak Trough Analysis, we are almost ready to study the price patterns using the ratio and size variable. However, before we do that, you need to understand these triangles generated from Peak Trough Analysis are Fractal Pattern. In Fractal Pattern, the same or similar geometric shape is repeating infinitely in different scales. In another words, with Fractal pattern, we are likely to see the same or similar pattern when we magnify the part of pattern. In the Romanesco Broccoli, the smaller piece, if they are broken off from the bigger piece, do look like the big piece. Like this, in Fractal Pattern, the same or similar patterns are occupying the entire structure of an object.
There are few different types of Fractal Patterns. When the same geometric pattern is repeating, we call this as a strict self-similarity. For example, Sierpinski triangle is good example of strict self-similarity in Fractal pattern. In Sierpinski triangle, the triangle is continuously expanding to build bigger triangle. As we magnify any part of Sierpinski triangle, we see the identical triangles. On the other hands, fractal pattern can have a loose self-similarity structure. For example, the simplest form of loose self-similarity can be found in coastline. As we magnify a segment of coastline, we do not expect to see an identical copy of original coastline but rather similar shapes. Instead, we can observe that the same statistical properties are preserved across scales. In nature, loose self-similarity is more common.
As you might guess, financial market represents fractal pattern with the loose self-similarity. For example, when we apply the Peak Trough Analysis, the triangles are not identical but they are rather similar. Each triangle is not strictly identical but they are triangles with different angles. Typically, fractal patterns in nature expand its geometry in two or three dimension in space. In the financial market, the fractal patterns are expanding in the two dimension of price and time. Hence, fractal pattern in the financial market can be considered as fractal wave. In another words, it is some sort of cycles. This inclusion of time dimension makes the fractal pattern in financial market special. What this means is that to predict financial market, we need to consider size and ratio in time dimension too as well as price dimension.
To give you better idea of fractal wave in financial market, consider Peak Trough Analysis with grid spacing of 2. In this fine grid spacing, we can observe many triangles in the smaller scale. As we increase our grid spacing to 4, we can see less number of bigger triangles in comparing to grid spacing 2. Now, we can tell that scale of triangles is bigger with grid spacing 4. However, are these big triangles new? No, these big triangles are made up from small triangles in the grid spacing of 2. If we keep increasing the grid spacing, then eventually we will see one big triangle spans from the beginning to the end of price series. Grid spacing example implies that combination of several small fractal wave can form the bigger fractal wave. The grid spacing example shows that there is mother wave and child wave relationship existing between fractal waves in different scales. For example, consider a fractal wave with following swing high and swing low properties:
1) Price for swing high = 1000 points
2) Price for swing low = 600 points
3) Time for swing high = 7 days
4) Time for swing low = 4 days
Under this fractal wave, we can have seven smaller fractal waves. In our example, mother wave is bigger wave and child waves are seven smaller fractal waves. Number of child wave is just randomly chosen in this example. Sometimes, we can have five child waves inside one mother wave. Sometimes, we can have only three child waves inside mother wave. In addition, the shape of mother wave in this example is random too. We can have all sort of triangle shapes for mother waves and so does for child waves. The relationship of mother wave and child wave is relative. The mother wave in this example can be the child wave of other bigger fractal wave. Likewise, the seven child waves in this example can be the mother waves of other child waves. Hence, this is the fractal patterns that repeating infinitely in different scales. Understanding the fractal wave can be challenging for now. However, you might be thankful to the existence of the fractal wave for your trading because there is only one geometric shape you have to concern throughout different scales. It is not that you have to concern triangle, rectangle, curve, or any other random polygon in our prediction. In the case of financial market, it is the triangle shape, which we have to concern only. In another words, fractal pattern, as well as fractal wave, is efficient in terms of memory. In scientific and engineering world, fractal geometry is often used to compress large size of data into smaller size. For example, as long as you capture the detail of mother pattern that encloses child patterns, you are able to construct entire scales of fractal patterns. This is the useful property in many industrial applications.
Another important point behind the mother wave and child wave is that in history, many legendary traders often spot the price patterns as in mother wave that are made up from smaller child waves. For example, Elliott Wave, Gartley, and Butterfly Pattern are the good example of mother wave and child wave. Existence of child wave inside mother Wave does not alter our geometric prediction equation defined in the first chapter. However, on top of the size and ratio variable, we need to consider the joint effect between small and large fractal waves. Understanding the joint effect is one important reason why some might be successful in trading whereas some might be unsuccessful in trading. You can not ignore this joint effect because we are dealing with fractal patterns that are infinitely repeating in different scales. Hence, your success in financial market is highly related to your understanding of this joint effect between small and large waves.
Some More Tips about Fractal Pattern Strategy
Let’s dive into some more tips about Fractal Pattern Strategy Guide that integrates Fractal Waves, Harmonic Patterns, and Elliott Wave Theory.
Fractal Pattern Strategy Guide
1. Fractal Waves
Understanding Fractal Waves:
- Fractal Waves: These are repetitive price patterns that occur at different scales in the market, reflecting the fractal nature of price movements.
- Application: By identifying these repeating patterns, traders can predict potential turning points or continuation points in the market.
2. Harmonic Patterns
Understanding Harmonic Patterns:
- Harmonic Patterns: These are precise price patterns based on Fibonacci retracement and extension levels. Examples include the Gartley, Butterfly, Bat, and Crab patterns.
- Application: Harmonic patterns help identify potential reversal points with high accuracy by focusing on specific Fibonacci ratios.
Identifying Harmonic Patterns:
- Gartley Pattern: Look for a retracement of 61.8% followed by an extension to 127.2%.
- Butterfly Pattern: Identify patterns where the initial leg is followed by a 78.6% retracement and then an extension to 127.2%.
- Bat Pattern: Focus on a 50% retracement followed by a 161.8% extension.
- Crab Pattern: Spot a retracement of 38.2% followed by an extension to 161.8%.
3. Elliott Wave Theory
Understanding Elliott Wave Theory:
- Elliott Wave Theory: This theory posits that market prices move in repetitive wave patterns. It breaks down trends into five-wave structures (three impulse waves and two corrective waves) and corrections into three-wave structures.
- Application: Traders use Elliott Wave patterns to identify the direction and potential reversal points of market trends.
Identifying Elliott Waves:
- Impulse Waves: Five-wave patterns in the direction of the trend (1, 2, 3, 4, 5).
- Corrective Waves: Three-wave patterns against the trend (A, B, C).
- Wave Relationships: Use Fibonacci ratios to project wave targets (e.g., wave 3 is typically 161.8% of wave 1).
Strategy Guide Steps
1. Determine Market Context
- Trend Analysis: Use moving averages (e.g., 50-day SMA), trendlines, or the ADX to establish the overall trend direction.
- Multiple Time Frames: Analyze the market in different time frames to get a comprehensive view of the trend.
2. Identify Fractal Patterns
- Spot Fractal Waves: Look for repetitive patterns that indicate potential turning points or continuation points within the context of the overall trend.
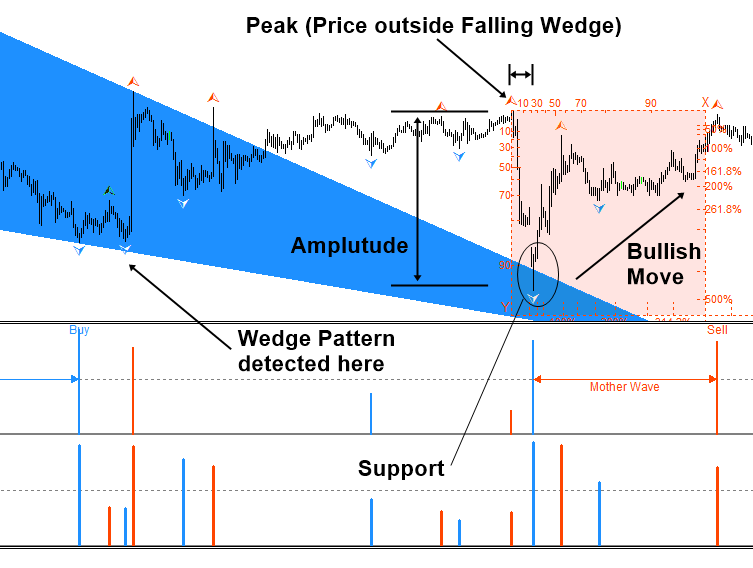
- Confirm Patterns: Use harmonic patterns and Elliott Wave structures to confirm the fractal patterns. For instance, a bullish fractal at the end of an Elliott Wave corrective pattern (ABC) and within a harmonic pattern’s PRZ (Potential Reversal Zone) strengthens the reversal signal.
3. Harmonic Pattern Confirmation
- Combine Patterns: Look for harmonic patterns that align with fractal waves and Elliott Wave counts. For instance, a bullish Gartley pattern at the end of an Elliott Wave corrective wave (C) indicates a potential reversal.
- Use Fibonacci Levels: Apply Fibonacci retracement and extension levels to verify harmonic patterns.
4. Set Entry and Exit Points
- Bullish Fractal: Enter a buy order above the high of the bullish fractal pattern, confirmed by harmonic and Elliott Wave patterns.
- Bearish Fractal: Enter a sell order below the low of the bearish fractal pattern, confirmed by harmonic and Elliott Wave patterns.
- Stop-Loss Placement: Place stop-loss orders below the last swing low (for bullish setups) or above the last swing high (for bearish setups).
5. Manage the Trade
- Profit Targets: Use Fibonacci extensions, previous support/resistance levels, or Elliott Wave projections to set profit targets.
- Trailing Stops: Implement trailing stops to lock in profits as the trade moves in your favor, adjusting based on key technical levels and market volatility.
Example of a Fractal Pattern Strategy
Bullish Trade Example:
- Determine the Market Context: Identify an uptrend using a 50-day SMA and confirm with higher highs and higher lows.
- Identify Fractal Wave: Spot a bullish fractal pattern at the end of a corrective wave (C) in an Elliott Wave structure.
- Harmonic Pattern Confirmation: Verify the presence of a Gartley pattern within the corrective wave, with a PRZ at the fractal low.
- Set Entry and Exit Points:
- Place a buy order above the high of the bullish fractal pattern.
- Set a stop-loss below the low of the fractal pattern.
- Manage the Trade:
- Set a profit target at the 127.2% Fibonacci extension of the initial impulse wave.
- Use a trailing stop to adjust the stop-loss as the price moves in your favor.
Advantages and Limitations
Advantages:
- High Accuracy: Combining fractal waves with harmonic patterns and Elliott Wave Theory provides precise entry and exit points.
- Comprehensive Analysis: Multiple confirmations reduce the likelihood of false signals.
- Flexibility: Applicable across various markets and time frames.
Limitations:
- Complexity: Requires understanding and correctly identifying fractal patterns, harmonic patterns, and Elliott Wave structures.
- Time-Consuming: Analyzing multiple patterns and confirmations can be time-intensive.
- Potential for False Signals: Despite confirmations, there is always the risk of market anomalies leading to false signals.
Conclusion
Integrating fractal patterns with harmonic patterns and Elliott Wave Theory offers a robust strategy for identifying potential market reversals and continuations. This approach provides a comprehensive framework that combines the predictive power of fractal waves with the precision of harmonic patterns and the structure of Elliott Wave Theory. By following this strategy guide and continuously practicing and backtesting, traders can improve their ability to anticipate market movements and manage risk effectively.
Below we provides the complete list of manuals and strategy guide for Fractal Pattern Indicator. Please make sure to read these articles before trading with Fractal Pattern Indicator.
Main Features with Fractal Pattern Scanner
1. Automated Gann’s Angles (Gann’s Fan) – measure trend strength with angled lines
2. Detect Turning Point Probability in price dimension (i.e. amplitude) and time dimension (i.e. wavelength)
3. Fibonacci Probability Graph helping to detect more accurate rising wedge, falling wedge and triangle patterns
4. Improve trading performance with Harmonic Pattern and X3 patterns with probability filter
5. Trading with Mother Wave with high turning point chance
6. any other innovative methods
Fractal Pattern Scanner Manuals
● Understanding Gann’s Angles with Probability – Brand New Technology
● Fibonacci Probability Graph Little Tip
● Trading Signal with Turning Point Probability
● Mother Wave Detection Setting
● Trading Harmonic Pattern, Elliott Wave Pattern and X3 Pattern with Turning Point Probability
Fractal Pattern Scanner Strategy Guides
Introduction to Fractal Pattern in Financial Market
● Geometric Prediction, the Bible for Successful Trading
● Turning Point, Peak, Trough, Swing High, Swing Low, and ZigZag
● Fractal Wave, Mother Wave, and Child Wave
Trading Price Pattern with Turning Point Probability
● Mother Wave and Child Wave with Joint Probability
● Predicting Volatility with Turning Point Probability
● Support and Resistance Trading with Turning Point Probability
● Harmonic Pattern Trading with Turning Point Probability
● Falling Wedge Pattern and Rising Wedge Pattern with Turning Point Probability
Below is the links for Fractal Pattern Scanner for MetaTrader 4 and MetaTrader 5.
- https://www.mql5.com/en/market/product/49170
- https://www.mql5.com/en/market/product/49169
- https://algotrading-investment.com/portfolio-item/fractal-pattern-scanner/
Below is the link for Optimum Chart (Optimum Chart is shipped with Fractal Pattern Indicator)
Related Products


