Algorithm and Prediction for Artificial Intelligence, Time Series Forecasting, and Technical Analysis
Important Chapter Note
Please note that this is the extra chapter for this book and this chapter is about explaining the computer algorithm rather than the financial trading. Hence, reading this chapter is optional only. You can skip this chapter if you have no interest in learning how the computer algorithm works to predict the financial market. In addition, we cannot guarantee that the provided Excel Add-Ins will work in your Excel. Learning curve for installing Excel Add-Ins and VBA use can be steep. If you were using Excel for simple data entry only, then this could be a huge jump in your Excel knowledge. We regret that we do not provide the Excel Add-Ins and VBA course, as we are not the certified course provider for Excel.
<<>>
Some contents omitted
<<>>
Hence, the graphical user interface within the Excel is not dedicated for the specific purpose. Since we provide this article for the educational purpose, we do not mind to use Excel with VBA application. If you want to use this Market Forecasting Algorithm for your trading, you can still use them for many different purposes.
To start this tutorial, firstly, download Market Forecasting Algorithm Excel file from our website. Below is the download link to the zip file.
www.algotrading-investment.com/FreeStuffs/MarketForecastingAlgorithmRelease.zip
Unzip the Excel file and run the Excel file. In the Market Forecasting Algorithm, we provide the algorithms for the time series forecasting and the technical analysis. We do not provide the Artificial intelligence algorithm. There are some reasons for this. Model building practice for artificial intelligence is notoriously subjective. As we have mentioned in the third point, the artificial intelligence model requires the tedious optimization for both the weights and the architecture. The choice of final model tends to be highly subjective per user. We have learnt that high subjectivity is bad for our trading. For the day by day practical trading, its benefit might be limited in comparing to its downside like complexity and slow computation. If you really want to educate yourself with artificial intelligence, then we recommend starting with some free artificial intelligence applications. There are some free ones on the internet. For example, Weka and TensorFlow are the free artificial intelligence application.
Now let us start our tutorial with the downloaded Excel file. In your decompressed folder, run the Market Forecasting Algorithm Excel file.
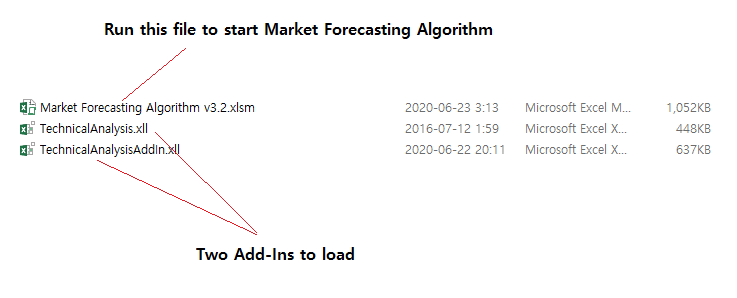
Figure 10-1: Run the Excel file in the decompressed folder
In the Excel file, you can load the graphical user interface of the time series forecasting and technical analysis algorithm by clicking the two buttons in the main worksheet.
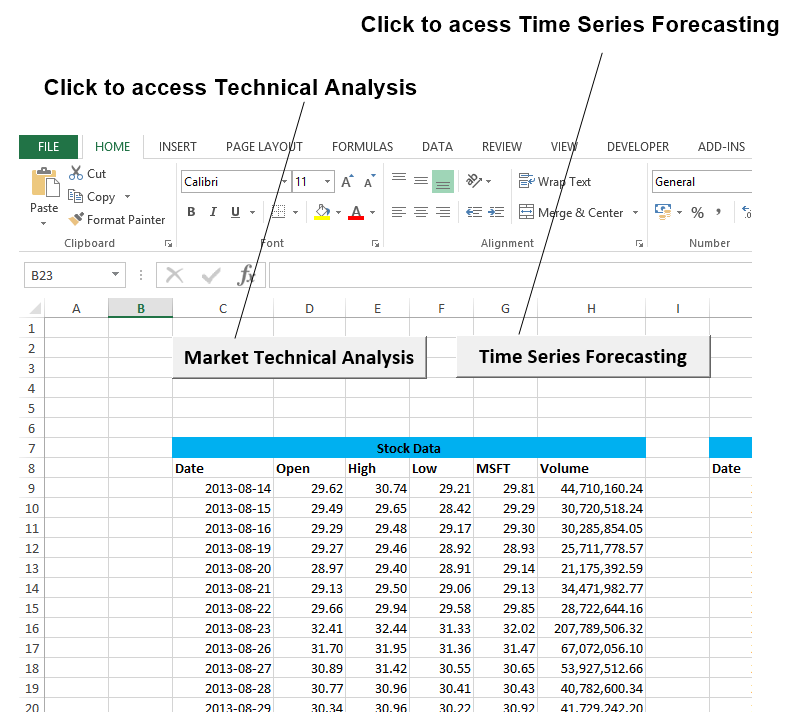
Figure 10-2: How to access the time series forecasting and technical analysis
You can also access the algorithm from the Excel Macro directly. This approach is useful when you want to use the time series forecasting and technical analysis in the worksheet with no buttons.

Figure 10-3: Access the algorithm without buttons
In the Macro list, choose Lunch_AM1 to use the technical analysis. Choose Lunch_AM2 to use the time series forecasting.
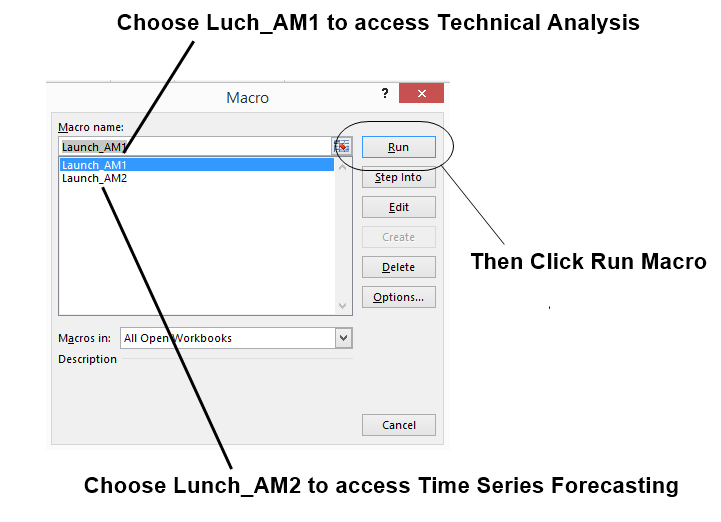
Figure 10-4: Macro List in Excel file
Before you start any computation with these algorithms, you need to add Three Add-Ins including Solver, Technical Analysis and Technical Analysis Add-In in your Add-Ins list. If you do not add them in your Add-Ins list, then you can not use both time series forecasting and technical analysis. To add these Add-Ins, go to File >> Options >> Add-Ins in Excel 2013. Later version of Excel, this configuration might be different. On the bottom of Add-Ins page, find “Manage: Excel Add-Ins”. Click on “Go” button to see the Add-Ins list below.
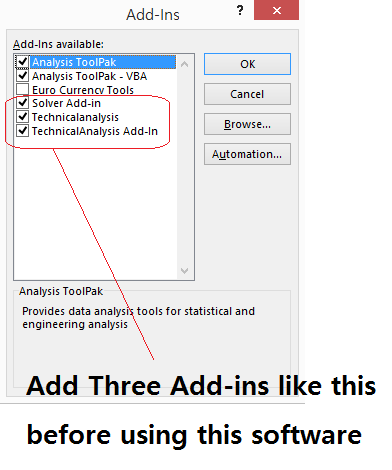
Figure 10-5: Configuration of the three Add-Ins in Excel file
To add TechnicalAnalysis.xll file, click on “Browse” button. Choose TechnicalAnalysis.xll file. Repeat the same step for TechnicalAnalysisAdd-In.xll file too. To access the Technical Analysis algorithm, you need to add both TechnicalAnalysis.xll and TechnicalAnalysisAdd-In.xll. Adding Solver is only required if you need to use Time Series Forecasting methods. This situation might change in the future because technical analysis can utilize the solver in their algorithm. However, at least, this condition stays true for the version 3.2 of Market Forecasting Algorithm.
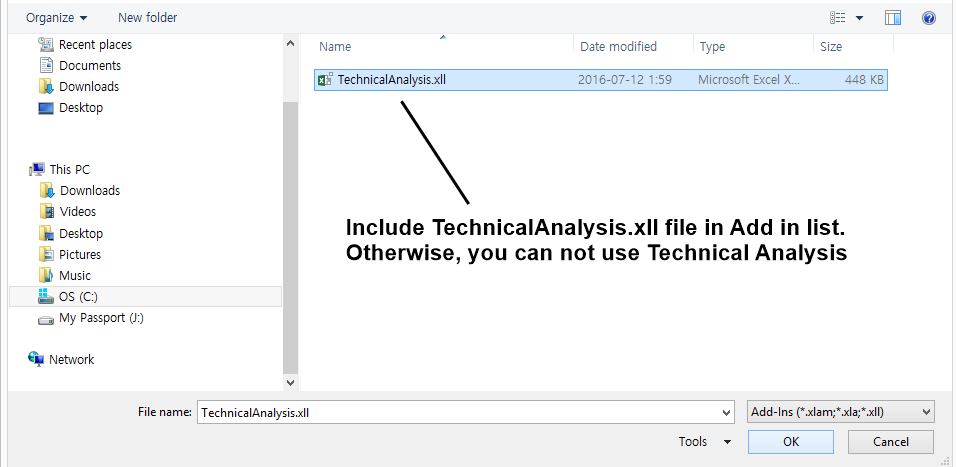
Figure 10-6: Include Technical Analysis Add-In
After the Three Add-Ins are included, you are ready to use both time series forecasting and technical analysis. When you click on the button for the technical analysis, the graphical user interface for technical analysis will be loaded. Then you will follow these five steps to compute the technical indicators for your data.
Step 1: Choose technical indicator from the list
Step 2: Edit indicator settings and click “Add Indicator” button
Step 3: Choose data range in your worksheet
Step 4: Check your data column arrangement in your data
Step 5: Finally, click on “Calculate” button

Figure 10-7: Graphical user interface for the technical analysis
Let us say that you want to apply Bollinger Bands with 50 period and RSI indicator with 20 period in your chart. The indicator setup will look like below.
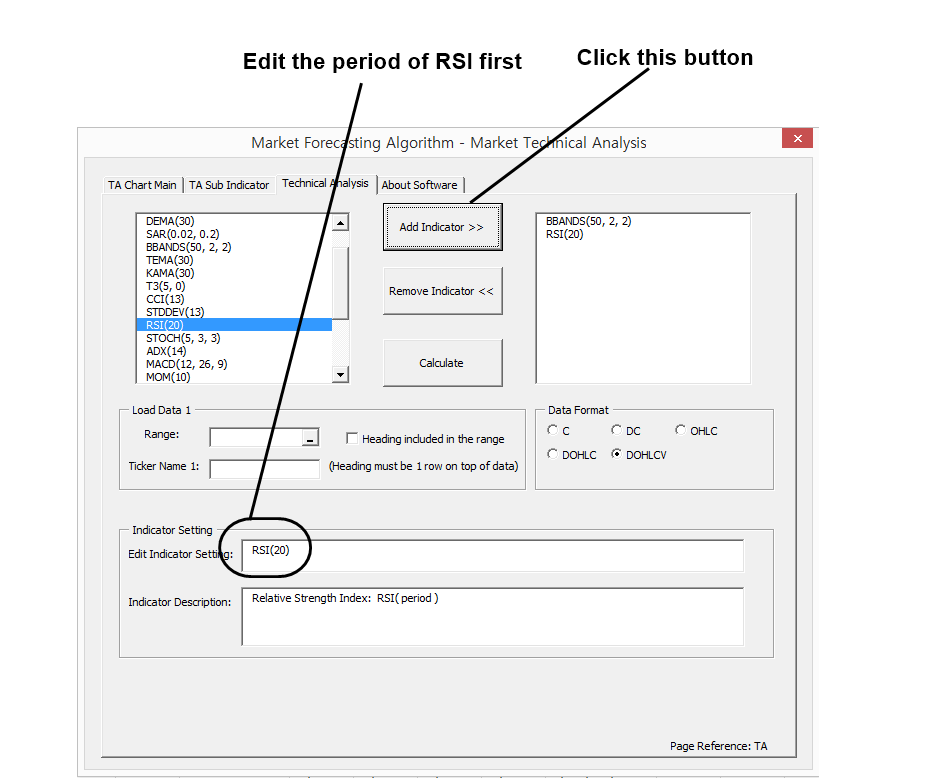
Figure 10-8: Steps to add technical indicators
Then click the range button to select the data range in your worksheet.
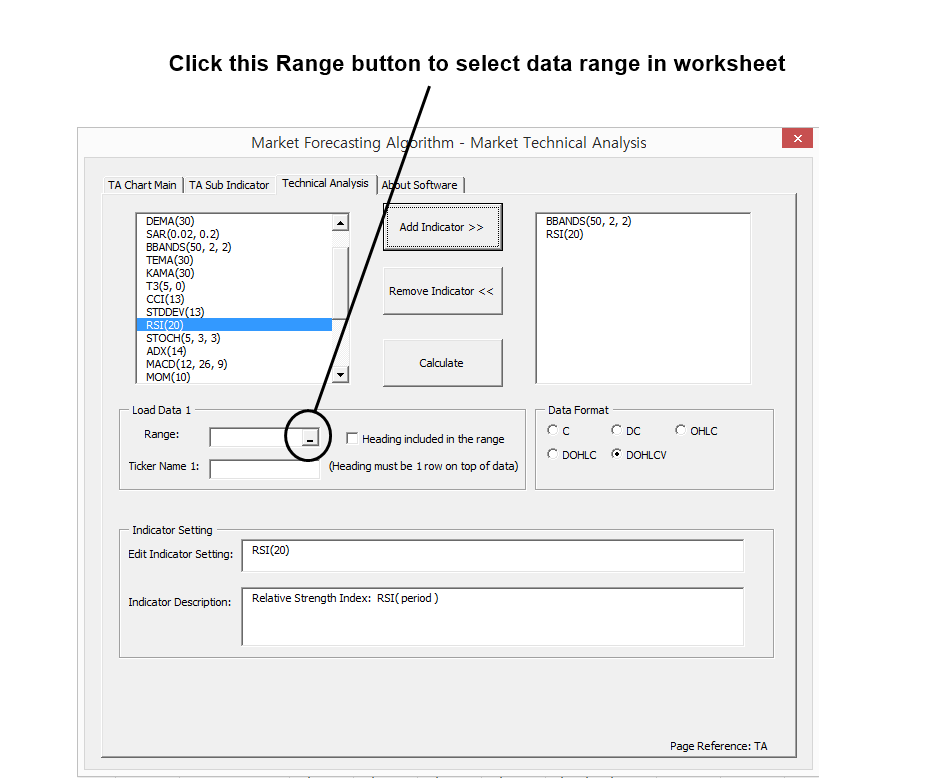
Figure 10-9: Select data range in the worksheet
In this example, we will use Microsoft stock data. Start the first cell in the top left corner in your data and then drag your mouse until you include the last cell in the bottom right corner.
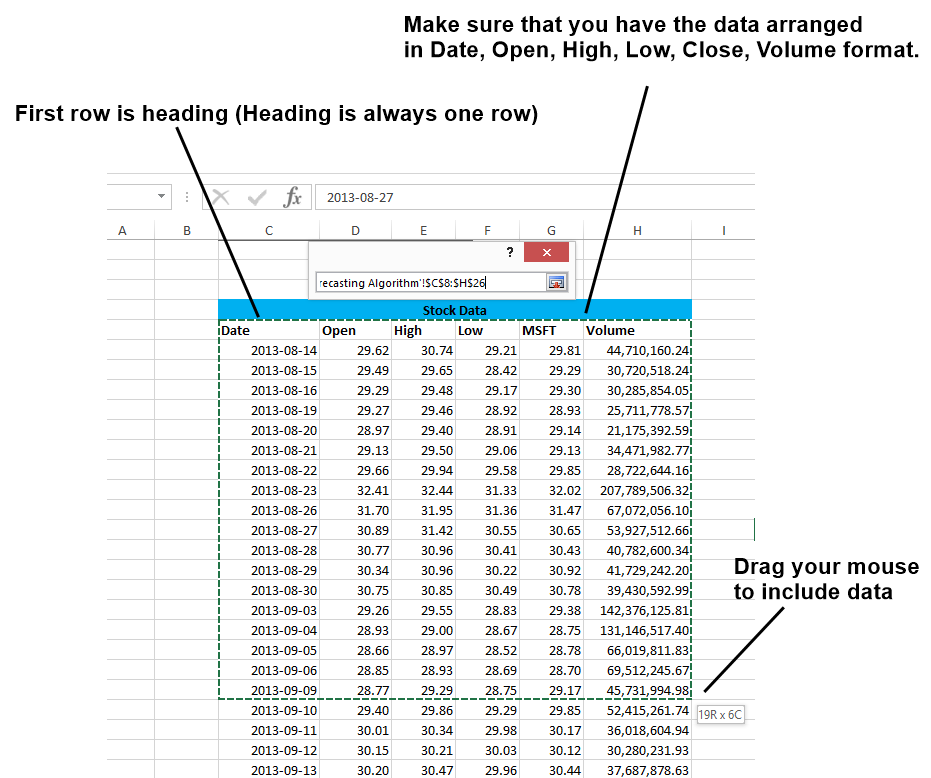
Figure 10-10: Drag your mouse from top left to bottom right of your data
After the data is selected, tick on the box “Heading included in the range”. Then check if you have chosen the right data format. For example, choose “DOHLCV” if your data is arranged in the order of Date, Open, High, Low, Close, and Volume. Finally, click on “Calculate” button. Now everything is done.
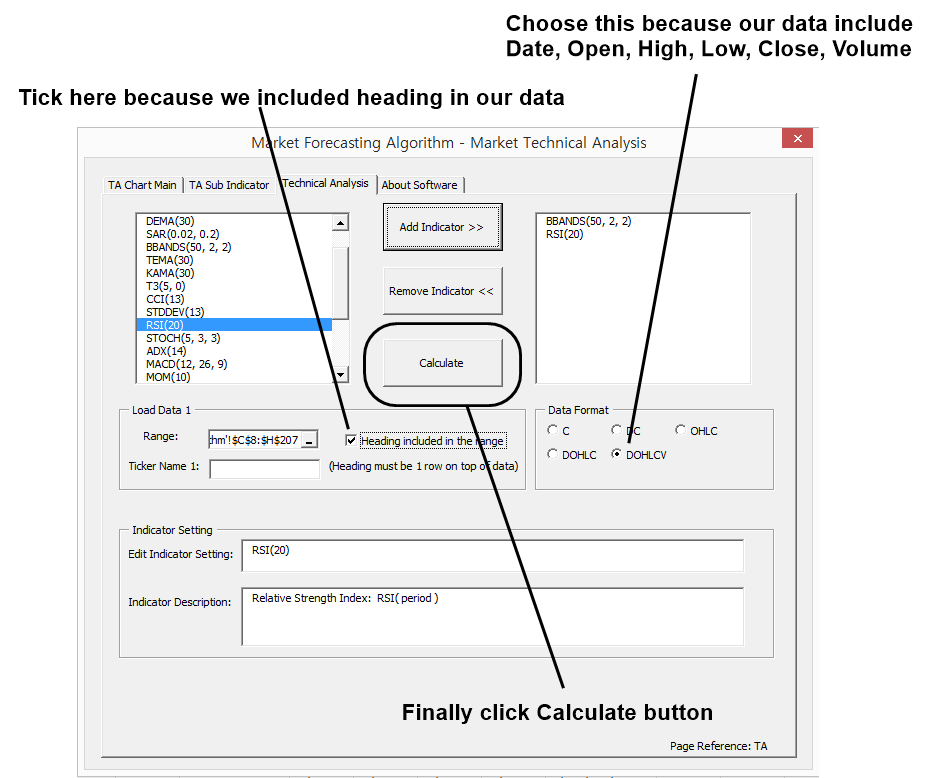
Figure 10-11: Click Calculate button
Now you will see the Bollinger Bands and RSI computed for Microsoft stock data. Now you might ask the question what happens if the data format is wrong. If you feed the data with wrong format, then the calculated value could be wrong too. Sometimes, it can throw error. In any case, we recommend keeping the data with the following order of Date, Open, High, Low, Close, and Volume (i.e. DOHLCV format). When volume is not available, you might just use Date, Open, High, Low, and Close (i.e. DOHLC format). However, some technical indicators can throw some errors if they require volume data in their calculation.

Figure 10-12: Chart with Bollinger Bands and Relative Strength Index
Market Forecasting Algorithm also provides the ZigZag algorithm in two different indicators. Firstly, you can use ZigZag indicator for the ZigZag line chart. Secondly, you can use the Peak Trough indicator for the peak trough detection. Both are based on the ZigZag algorithm. However, ZigZag indicator outputs the indicator values in one single column and peak trough indicator outputs the indicator values in two different columns, respectively for peaks and troughs. You can choose any of these two according to your needs.

Figure 10-13: ZigZag indicator and Peak Trough Indicator in the indicator List
As we have emphasized in many chapters of this book, Peak Trough analysis is the important gateway through many advanced techniques like Fibonacci Price Pattern, Elliott Wave Pattern, Harmonic Pattern, X3 Price Pattern, Support and Resistance. Without the Peak Trough Analysis, you are not able to start with these techniques, as the pattern detection process gets too complicated. Hence, you can use the Market Forecasting Algorithm to train yourself with these advanced techniques if you trade in either Forex or Stock market.
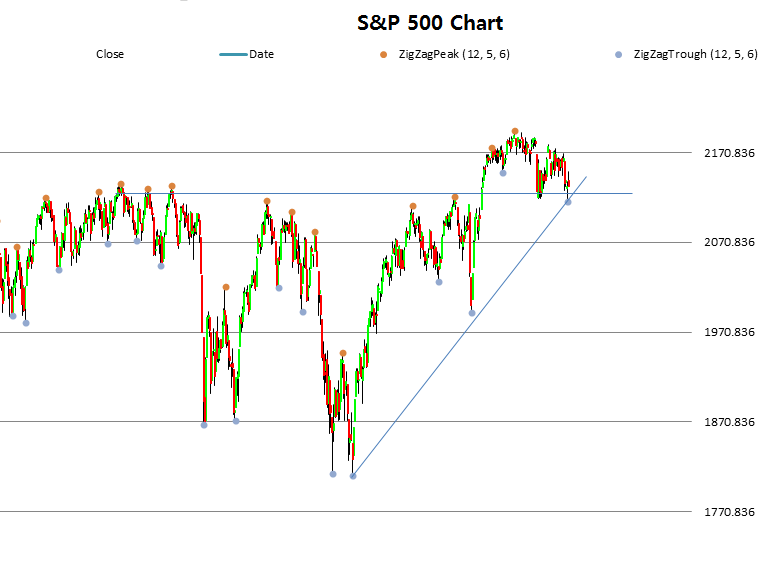
Figure 10-14: Peak Trough Indicator applied to S&P 500 index
As soon as you realized that market repeats themselves, you would appreciate the concept of Fractal Pattern and Fractal Wave for your trading. At that stage, you will notice that all the advanced trading techniques are merely derived from the concept of Fractal Pattern and Fractal Wave. Unfortunately, there is no shortcut to profitable trading. Practice and knowledge are the only viable option. Hence, we provide you the tools.

Figure 10-15: ZigZag Indicator applied to Microsoft Cooperation chart
Now, we covered the basics on how to use the Market Forecasting Algorithm. Here is four tasks you should perform to complete this tutorial. For each task, measure the time taken to complete the computation with stopwatch. Compare the computation time for these four tasks.
Task 1: Calculate Bollinger Bands with 200 data sets.
Task 2: Calculate Bollinger Bands with 800 data sets.
Task 3: Calculate Bollinger Banks, RSI, and CCI with 200 data set.
Task 4: Calculate Bollinger Banks, RSI, and CCI with 800 data set.
The Market Forecasting Algorithm Excel file provides more than 20 technical indicators. We added the 20 most popular technical indicators including Moving Average, Relative Strength Index, Commodity Channel Index, ZigZag indicator and so on. The training for these technical indicators is widely available on the internet. Hence, we will not cover how to use them in this article. For this tutorial, we also provide the data for Standard & Poor 500 index and EURUSD. You can always use some free data source like Yahoo Finance or Google Finance to get price data. If you want to perform your own analysis, then copy and paste those data in the order of Date, Open, High, Low, Close, and Volume. Make sure that heading row is placed on the top. Latest data should be placed on the bottom.
Next, we will move on to how to use the algorithm for the time series forecasting. The graphical user interface for the time series forecasting looks like below the screenshot. We provide the specific forecasting method called Exponential-smoothing methods. Exponential smoothing methods are the main workhorse in the forecasting industry. In the forecasting industry as in the demand forecasting and business forecasting, exponential smoothing is popular tools like the Moving average indicator and Relative strength index in the technical analysis. In addition, ARIMA (Autoregressive Integrated Moving Average) and GARCH (Generalized Autoregressive Conditional Heteroscedasticity) models are other popular tools widely used in practice. However, their theory tends to be more complex than the exponential smoothing methods. Neural Networks are often considered as the alternative forecasting method against these common forecasting methods.
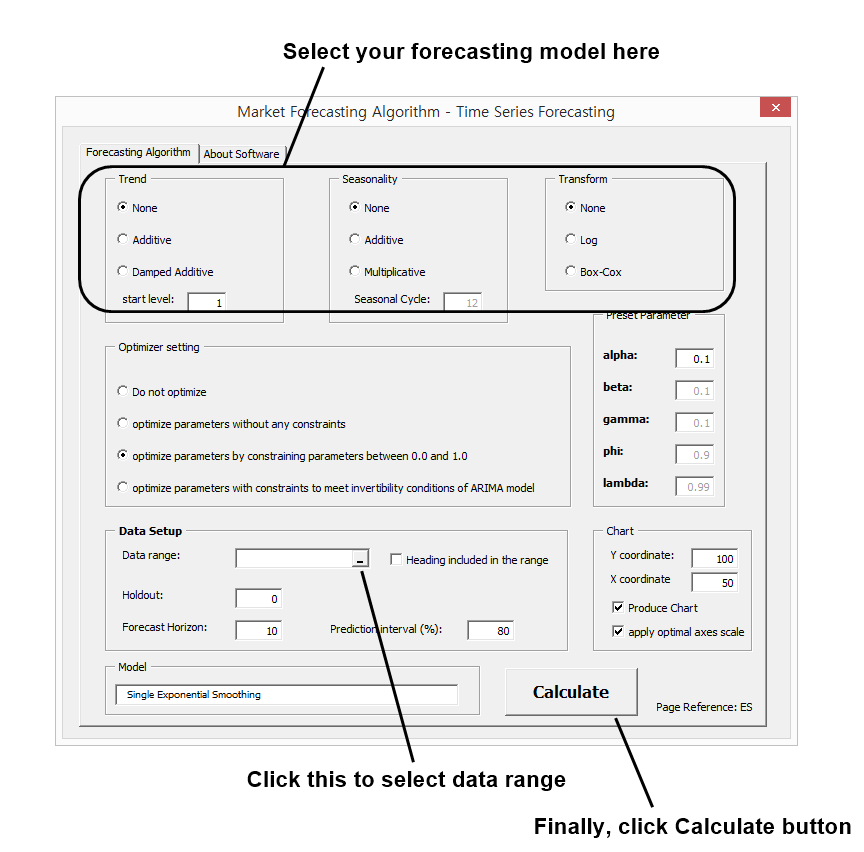
Figure 10-16: Graphical user interface for time series forecasting
In the model selection stage, you can choose nine different exponential smoothing forecasting models.
Model 1: No Trend, No Seasonality
Model 2: Additive Trend, No Seasonality
Model 3: Damped Additive Trend, No Seasonality
Model 4: No Trend, Additive Seasonality
Model 5: Additive Trend, Additive Seasonality
Model 6: Damped Additive Trend, Additive Seasonality
Model 7: No Trend, Multiplicative Seasonality
Model 8: Additive Trend, Multiplicative Seasonality
Model 9: Damped Additive Trend, Multiplicative Seasonality
The price patterns of these nine forecasting models are shown in Figure 10-17. Probably the price pattern table will provide you better understanding on these models. However, both price pattern table and the nine forecasting model names fit together logically.
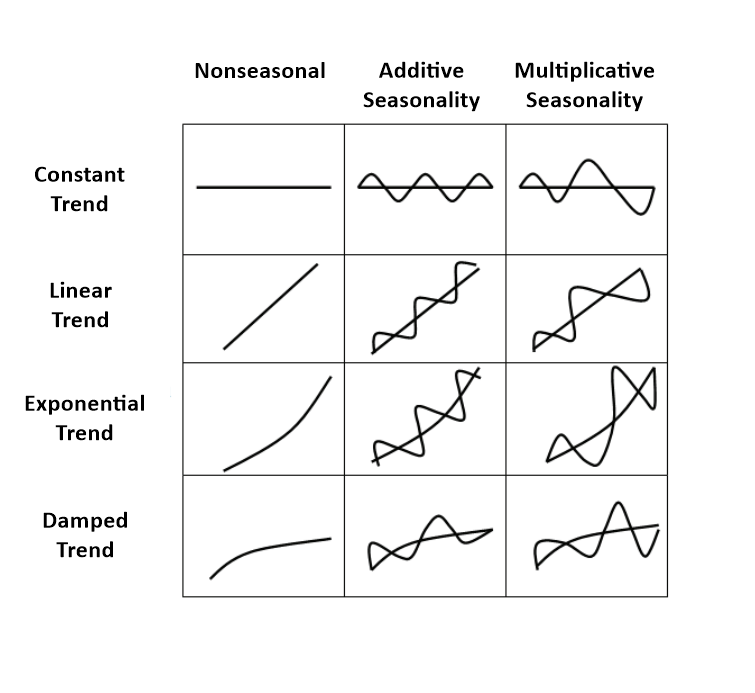
Figure 10-17: The original Gardner’s table to visualize the characteristics of different time series data (Gardner, 1987, p175)
Let us try to make forecasting for EURUSD close data. We will be using Damped Additive Model with no seasonality. The steps for time series forecasting is like below:
Step 1: choose forecasting model
Step 2: Select Data to forecast
Step 3: Finally, click on “Calculate” button
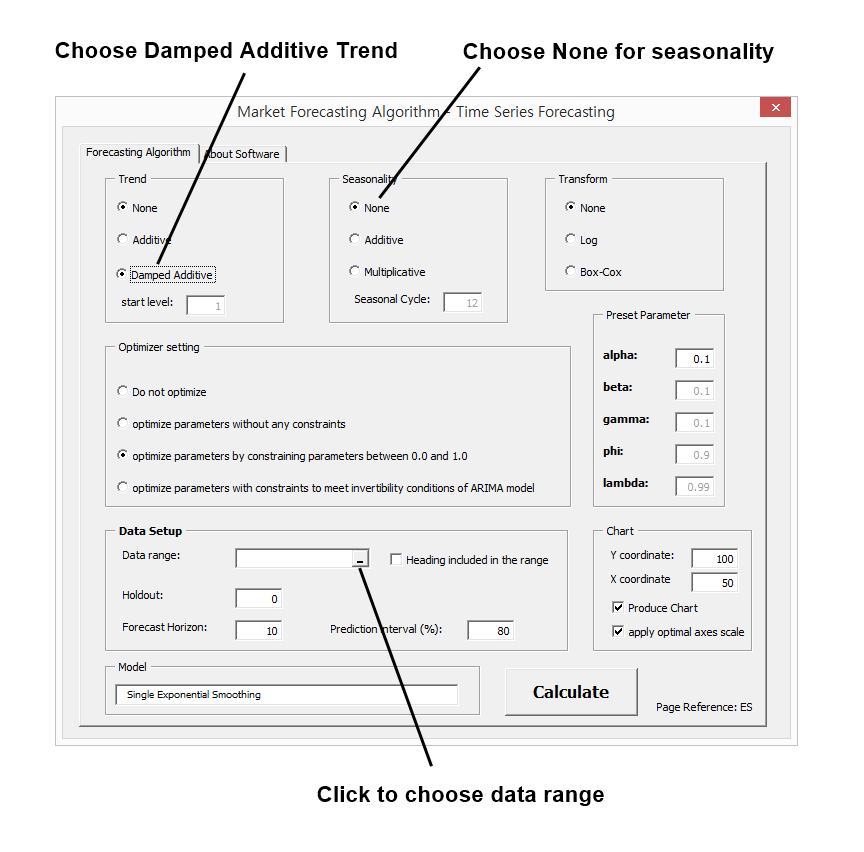
Figure 10-18: Choose right forecasting model for your data
After you have clicked on Data Range button, you need to select your data. Only include one colum since forecasting algorithm only requires one time series data. Never include more than one column. It will throw error. In fact, you can choose to forecast any data as long as they are time series data, recorded in the fixed time interval. With time series forecasting, you can even forecast Open price or Volume or Relative Strength Indicator, and so on if you wish. In this tutorial, we have chosen to forecase the Close price of EURUSD for simplicity.
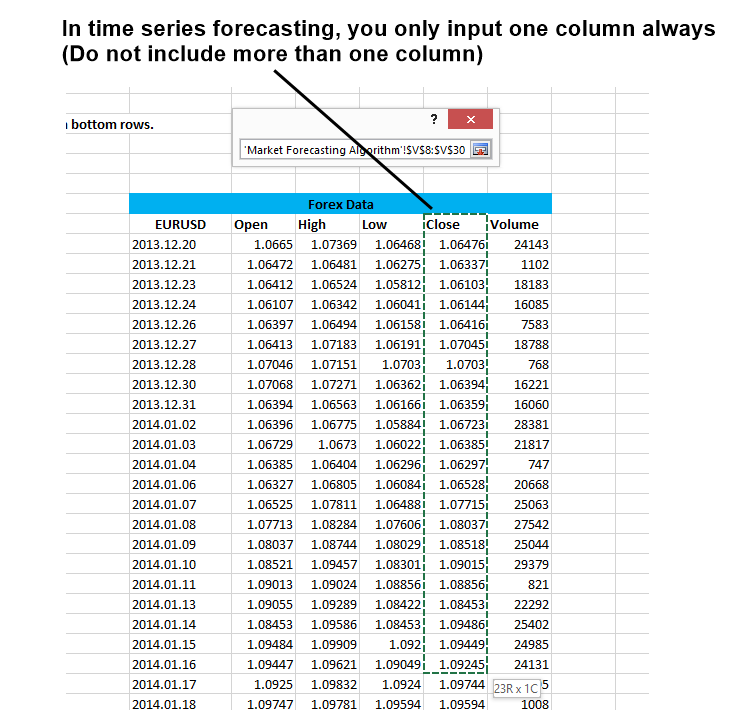
Figure 10-19: Select one column to forecast
Then tick on the box “Heading included in the range” because we included heading row. When you do not include heading row, then untick on the box “Heading included in the range”. If you do it the other way around, then it will throw error. Finally, click the “Calculate” button.
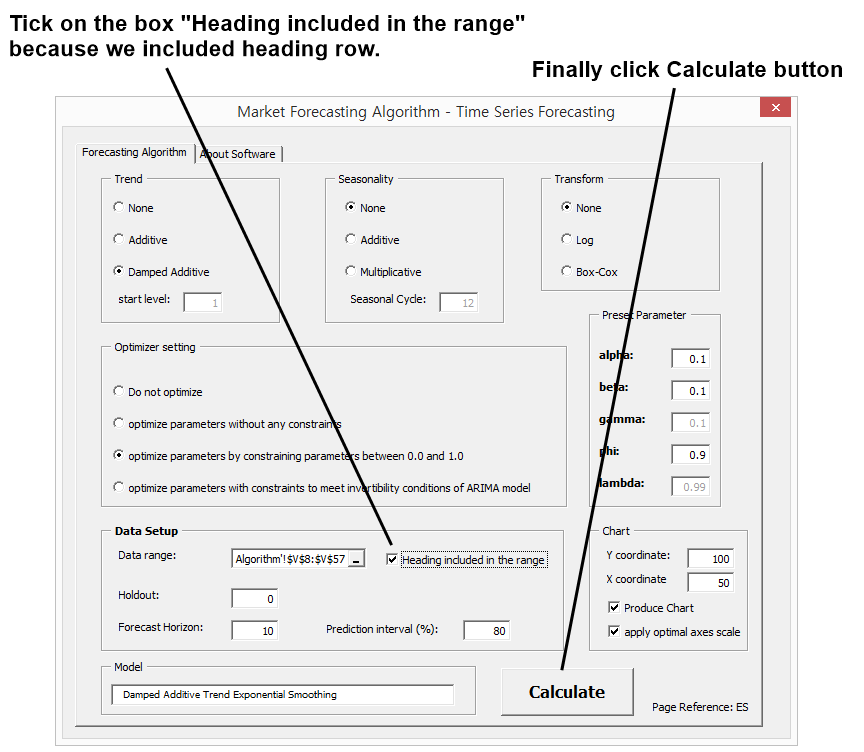
Figure 10-20: Click on Calculate button
If you have done everything correctly, then you will get the chart with forecasting with prediction interval. Please note that sometimes, you might have to change maximum and minimum scales of the price axis manually to fit the lines in the chart.
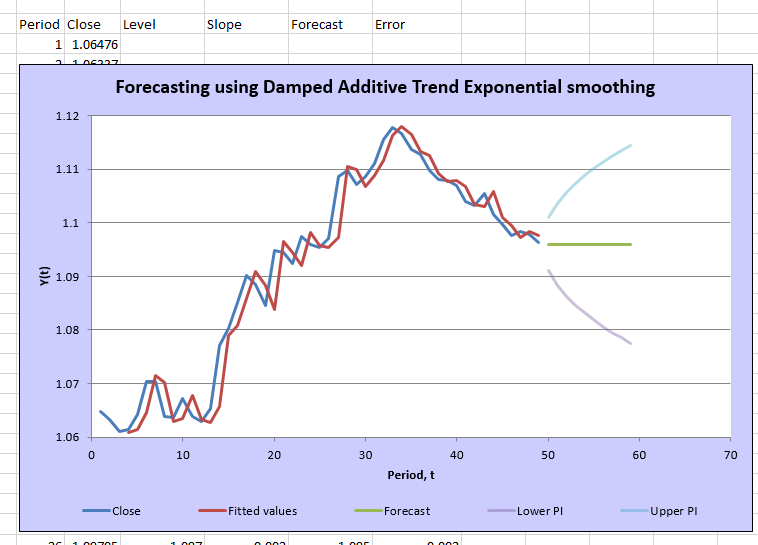
Figure 10-21: Forecasting with Damped Additive Trend Exponential smoothing model
In the next example, we will try to forecast the airline passenger data. Airline passenger data is the textbook example with seasonality and trend. Here is the screenshot for your information.
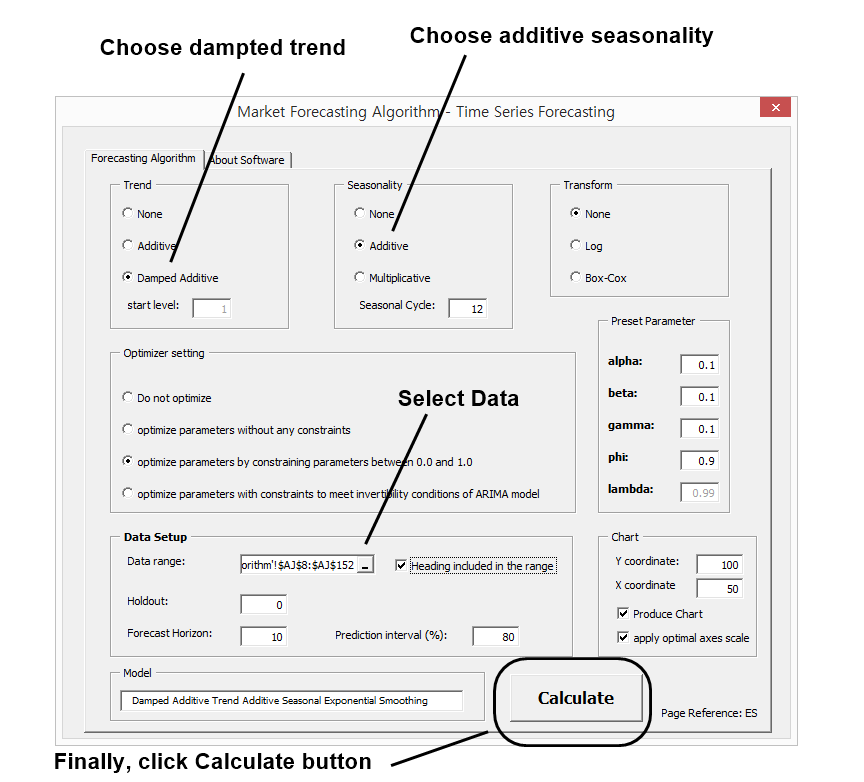
Figure 10-22: Steps to forecast with airline passenger data
If you have done everything correctly, then you will have a forecasting chart like this. This forecasting chart shows how the airline passenger data will look like in next 10 month. As you see, the forecasting model adapted the seasonal patterns in the data.
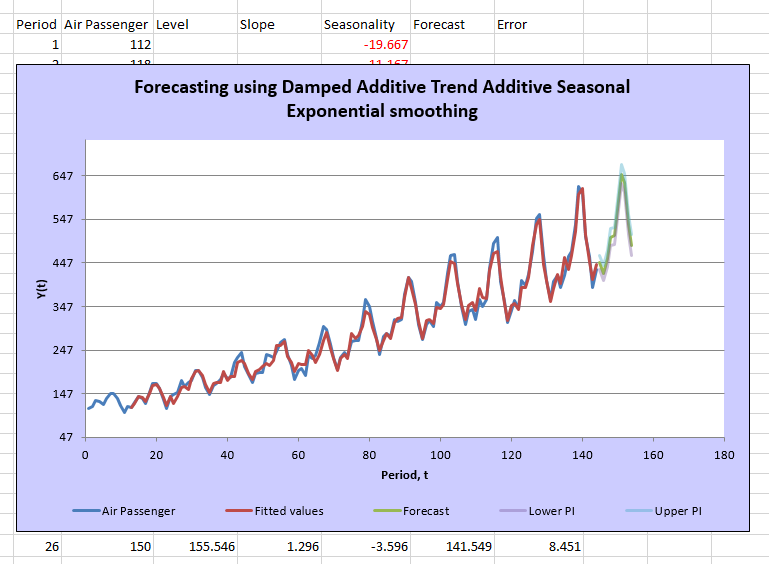
Figure 10-23: Forecasting with damped additive trend additive seasonal exponential smoothing model
Here are some tasks you should perform to complete this tutorial. Of course, measure the time taken to complete the computation for each task. For your information, Task 6 and 7 can take some time to complete the computation. Do not disturb the running macro until they are completed.
Task 5: Forecast EURUSD close data with 200 data sets using damped Trend model.
Task 6: Forecast EURUSD close data with 800 data sets using damped Trend model.
Task 7: Forecast EURUSD close data with 800 data sets using damped Trend model + Box-Cox transformation.
Compare the computation time for all seven tasks. You can answer the following questions. Question 5 may be skipped if you prefer.
Question 1: Which task provides the slowest computation time?
Question 2: Which task provides the fastest computation time?
Question 3: Why Task 4 is much faster than Task 6?
Question 4: Why do you think Task 6 and Task 7 have marginally different computation time?
Question 5: How slow or fast Artificial intelligence model, for example Deep Machine Learning, could be in comparison to Task 7 when the same amounts of data set are used?
One thing you should notice in this tutorial is that the algorithm for time series forecasting uses optimization. This is why it takes longer to complete the task. Solver Add-In does the optimization to estimate parameters of forecasting model. In the forecasting algorithm, we use the nonlinear GRG method, which is known for the “Generalized Reduced Gradient”. This is one of the convex optimizations, we have discussed. It is also possible to use genetic algorithm or simulated annealing instead of the nonlinear GRG method. However, the efficiency of optimization could be different marginally per each optimization method and per each mathematical model. Hence, you have to choose the right method if you want to save the computation time. Comparing to artificial intelligence model, the time series forecasting is light and fast. Hence, if you are going to use time series forecasting for financial market, the recommended practice is to make new forecasting model whenever new data is included. In artificial intelligence, they often retain the same model for reuse for some period. In time series forecasting, never retain old forecasting model for reuse. We will keep creating the latest forecasting with latest data available. This is the one of the benefit of time series forecasting methods due to its light and fast algorithm. In fact, time series forecasting is a comprehensive topic in the Applied Statistics. There are many practitioners of the time series forecasting across many different industries. For the choice of forecasting models, you might have to use some other forecasting textbook to cover the basics.
If you are looking for further tips to load TechnicalAnalysis.xll file, then please visit the link below:
This video below will be helpful in using the provided Market Forecasting Algorithm.
Must Read before using Market Forecasting Algorithm Add-Ins
If you were using Excel for simple data entry only, using Add-ins, User Defined Function, and VBA can be a huge jump in terms of your Excel Knowledge. Learning curve for installing Excel Add-ins and VBA use can be steep. Sometimes, it is impossible to figure it out on your own. We can not guarantee that this Excel Add-ins can run in your Excel smoothly without any proper education towards using Excel Add-ins and VBA. Fortunately, we provide the standalone Stock Market Prediction software (compatible with Forex market). You can download the Stock Market Prediction Software from the link below:
Stock Market Prediction software from link above is much easier to use. you can still access many technical indicator and you are capable to predict the financial market too. From above Stock Market Prediction software, you can also copy and paste many technical indicators to your Excel worksheet with simpler operation. The above software is free too. Please understand that we have released this Free Excel Add-ins after years of development work. We distribute it for being useful to the society at free cost. However, this Excel Add-ins may be not suitable for some people.
If you believe that you are not technical or you do not like Excel Add-ins or you have failed to install Excel Add-ins, then please use Stock Market Prediction application from above link instead of this Excel Add-ins. Please do so since Excel is not the easiest platform to use for the complex investment algorithm. In addition, we regret that we do not provide Excel and VBA course as we are not the certified course provider for Excel.
Some More Tips about Algorithm and Prediction for Artificial Intelligence, Time Series Forecasting, and Technical Analysis
Here’s some more tips about algorithms and prediction techniques in the context of artificial intelligence (AI), time series forecasting, and technical analysis:
1. Artificial Intelligence (AI)
AI involves using algorithms to simulate human intelligence. Key aspects of AI in prediction include:
Machine Learning Algorithms
Supervised Learning: Models are trained on labeled data. Examples include:
- Linear Regression: Predicts a continuous target variable.
- Logistic Regression: Predicts a binary outcome.
- Decision Trees and Random Forests: Tree-based methods for classification and regression.
- Support Vector Machines (SVM): Classification and regression using hyperplanes.
- Neural Networks: Complex models inspired by the human brain, capable of learning non-linear relationships.
Unsupervised Learning: Models find patterns in data without labeled responses. Examples include:
- K-means Clustering: Groups data into clusters based on similarity.
- Principal Component Analysis (PCA): Reduces dimensionality by transforming data into principal components.
Deep Learning
- Convolutional Neural Networks (CNNs): Primarily used in image recognition but also applied in other domains.
- Recurrent Neural Networks (RNNs): Suitable for sequential data; a specialized form, Long Short-Term Memory (LSTM) networks, are particularly useful for time series forecasting.
- Transformers: Modern architectures like BERT and GPT are used for natural language processing (NLP) and time series data.
2. Time Series Forecasting
Time series forecasting involves predicting future values based on previously observed values. Key techniques include:
Statistical Methods
- Autoregressive (AR) Models: Predict future values based on past values.
- Moving Average (MA) Models: Model the relationship between an observation and a residual error.
- ARMA and ARIMA Models: Combine AR and MA models; ARIMA includes differencing to make data stationary.
- Seasonal Decomposition: Decomposes time series into trend, seasonal, and residual components.
Machine Learning Methods
- Gradient Boosting Machines (GBM): Such as XGBoost and LightGBM, effective for time series with strong trends and seasonality.
- Support Vector Regression (SVR): Uses SVM principles for regression tasks.
- Neural Networks: Including LSTM and GRU, which are designed to handle sequential data effectively.
Advanced Techniques
- Prophet: Developed by Facebook, designed for business time series forecasting with strong seasonality.
- VAR and VECM: Vector autoregressive models for multivariate time series.
3. Technical Analysis
Technical analysis involves forecasting future price movements based on historical price data, primarily used in finance.
Common Techniques and Indicators
- Moving Averages: Including Simple Moving Average (SMA) and Exponential Moving Average (EMA), used to smooth out price data.
- Relative Strength Index (RSI): Measures the speed and change of price movements.
- MACD (Moving Average Convergence Divergence): Shows the relationship between two moving averages of a security’s price.
- Bollinger Bands: Uses standard deviation to plot bands above and below a moving average.
- Candlestick Patterns: Visual patterns in candlestick charts indicating market sentiment.
Pattern Recognition
- Trend Lines and Channels: Used to identify and confirm trends.
- Support and Resistance Levels: Indicate price points where the asset is expected to encounter buying or selling pressure.
- Chart Patterns: Such as Head and Shoulders, Flags, and Pennants, which are used to predict potential price movements.
Integrating AI with Technical Analysis
- Algorithmic Trading: Uses AI and machine learning to create trading algorithms based on technical indicators and patterns.
- Sentiment Analysis: Uses NLP to gauge market sentiment from news articles, social media, etc., and integrates this with technical analysis.
- Reinforcement Learning: Algorithms that learn trading strategies through trial and error to maximize returns.
Summary
- Artificial Intelligence (AI): Encompasses various machine learning and deep learning algorithms for prediction and classification tasks.
- Time Series Forecasting: Focuses on predicting future data points, leveraging statistical, machine learning, and advanced algorithms.
- Technical Analysis: Utilizes historical price data and technical indicators to forecast future market movements, often enhanced by AI techniques.
These fields often intersect, particularly in applications like algorithmic trading, where AI techniques are used to enhance time series forecasting and technical analysis to make more informed and accurate predictions.
About this Article
This article is the part taken from the draft version of the Book: Profitable Chart Patterns in Forex and Stock Market (Fibonacci Analysis, Harmonic Pattern, Elliott Wave, and X3 Chart Pattern). This article is only draft and it will be not updated to the completed version on the release of the book. However, this article will serve you to gather the important knowledge in financial trading. This article is also recommended to read before using Harmonic Pattern Plus, Harmonic Pattern Scenario Planner and Profitable Pattern Scanner, which is available for MetaTrader or Optimum Chart.
Below is the landing page for Harmonic Pattern Plus, Harmonic Pattern Scenario Planner and X3 Chart Pattern Scanner in MetaTrader. All these products are also available from www.mql5.com too.
https://algotrading-investment.com/portfolio-item/harmonic-pattern-plus/
https://algotrading-investment.com/portfolio-item/harmonic-pattern-scenario-planner/
https://algotrading-investment.com/portfolio-item/profitable-pattern-scanner/
Below is the landing page for Optimum Chart (Standalone Charting and Analytical Platform).
https://algotrading-investment.com/2019/07/23/optimum-chart/
Related Products


