Fibonacci Retracement and Expansion Patterns
A Fibonacci analysis is a popular tool among technical traders. It is based on the Fibonacci sequence numbers identified by Leonardo Fibonacci in the 13th century. Here are the Fibonacci sequence numbers:
0, 1, 1, 2, 3, 5, 8, 13, 21, 34, 55, 89,144, 233, 377, 610, 987, 1597, 2584, 4181, 6765, …………………
As the Fibonacci number become large, the constant relationship is established between neighbouring numbers. For example, every time, when we divide the former number by latter: Fn-1/Fn, we will get nearly 0.618 ratio. Likewise, when we divide the latter number by former: Fn/Fn-1, we will get nearly 1.618. These two Fibonacci ratio 0.618 and 1.618 are considered as the Golden Ratio. We can use these Golden ratios to start our Fibonacci analysis. However, many technical traders use additional Fibonacci ratios derived from the Golden ratio. Since the calculation of each Fibonacci ratio is well known, I have listed all the available Fibonacci ratio calculation in Table 1-1.
| Type | Ratio | Calculation |
| Primary | 0.618 | Fn-1/Fn of Fibonacci numbers |
| Primary | 1.618 | Fn/Fn-1 of Fibonacci numbers |
| Primary | 0.786 | |
| Primary | 1.272 | |
| Secondary | 0.382 | 0.382=0.618*0.618 |
| Secondary | 2.618 | 2.618=1.618*1.618 |
| Secondary | 4.236 | 4.236=1.618*1.618*1.618 |
| Secondary | 6.854 | 6.854=1.618*1.618*1.618*1.618 |
| Secondary | 11.089 | 11.089=1.618*1.618*1.618*1.618*1.618 |
| Secondary | 0.500 | 0.500=1.000/2.000 |
| Secondary | 1.000 | Unity |
| Secondary | 2.000 | Fibonacci Prime Number |
| Secondary | 3.000 | Fibonacci Prime Number |
| Secondary | 5.000 | Fibonacci Prime Number |
| Secondary | 13.000 | Fibonacci Prime Number |
| Secondary | 1.414 | |
| Secondary | 1.732 | |
| Secondary | 2.236 | |
| Secondary | 3.610 | |
| Secondary | 3.142 | 3.142 = Pi = circumference /diameter of the circle |
Table 1-1: Fibonacci ratios and corresponding calculations to derive each ratio.
In fact, Fibonacci analysis in financial trading is extremely popular. It is popular on its own. At the same time, it is also basis for many other popular technical analyses like harmonic pattern, Elliott wave pattern, etc. As with support resistance analysis, Fibonacci analysis is probably the most popular technical analysis among traders. There are two important techniques in Fibonacci analysis. First technique is Fibonacci retracement. Second technique is Fibonacci expansion. If you are looking at some other books, you might find some confusing description about retracement, extension, expansion, and projection. For example, the book might give two different names for the ratio over 100% and for the ratio below 100%. We are not using the confusing name practice here but we will stick with just retracement and expansion because it is simple. Both retracement and expansion will need two significant peak and trough to pick up in your chart. If you want to use mechanical setup with Fibonacci analysis, the best way to start is to use the Peak Trough Transformation using ZigZag indicator. Let us start with retracement. For simple example, we use 61.8% Golden ratio. For retracement, we can have two cases including Trough-Peak retracement and Peak-Trough retracement. In Trough-Peak retracement, 61.8% retracement level will act as a support level. Price will reverse in the correction phase to follow the previous bullish movement.
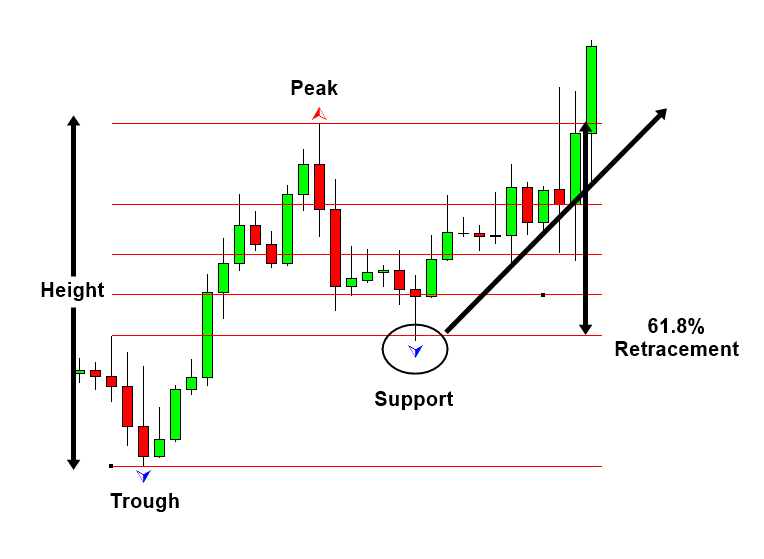
Figure 1-1: Trough-Peak Retracement Example on EURUSD H4 timeframe.
Likewise, in Peak-Trough retracement, 61.8% will act as resistance. Price will reverse in the correction phase to follow the previous bearish movement. In both case, the 61.8% retracement will be measured from end of correction phase to previous peak or trough. We have used percentage in this example. Some technical traders prefer to use the ratios in decimal places like 0.618. It is just your preferences. Using ratio or percentage does not affect the accuracy of trading. You can use other Fibonacci ratios like 0.382 or 1.618 in the exactly same way as 0.618.
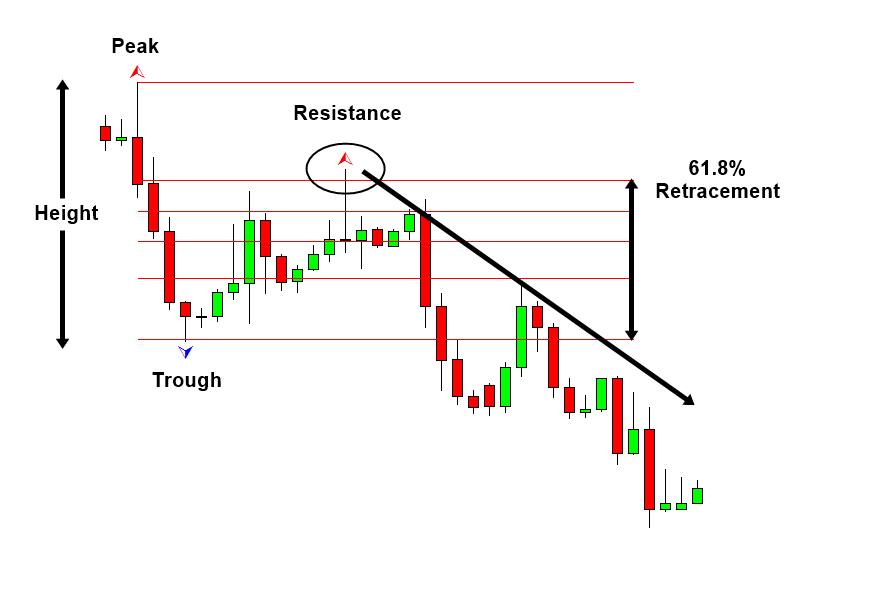
Figure 1-2: Peak-Trough Retracement Example on EURUSD H4 timeframe.
Fibonacci expansion is slightly more complicated than Fibonacci retracement. Still it is considered as the basic analysis among technical trader. As in retracement technique, we can have two cases including Trough-Peak expansion and Peak-Trough expansion. In Trough-Peak expansion, we will measure the expansion from where the correction ends to next peak. In the next peak, we will expect the bearish reversal in the same direction to the correction. In fact, the 100% Expansion level is act as the resistance in Figure 1-3. Likewise, in Peak-Trough expansion, we will expect the bullish reversal in the same direction to the correction. In Figure 1-4, 61.8% expansion level acts as the support.
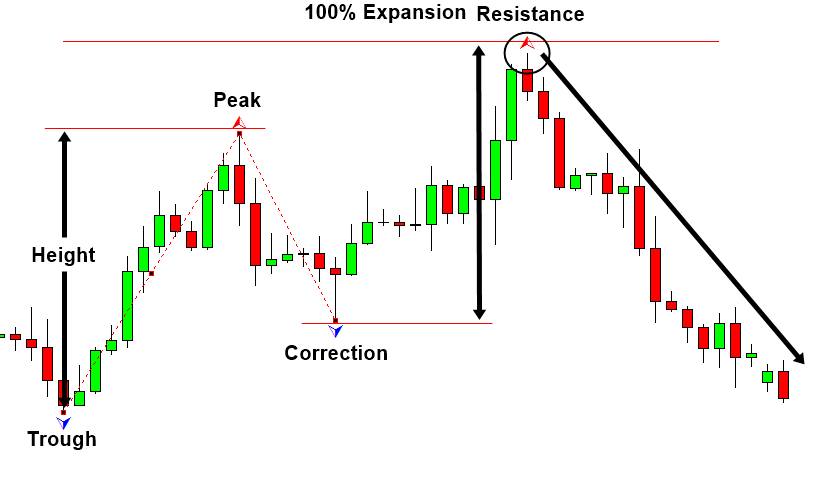
Figure 1-3: Trough-Peak Expansion Example on EURUSD H4 timeframe.
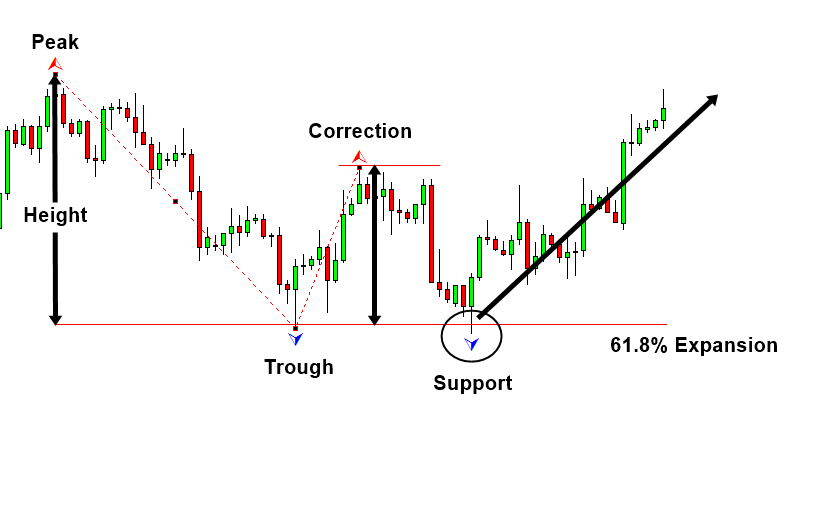
Figure 1-4: Peak-Trough Expansion Example on EURUSD H4 timeframe.
We have just given the technical description of Fibonacci retracement and expansion. The next thing we need to ask is what is the scientific relevance or justification behind these techniques. Unfortunately, it is hard to tell. People just used them for many decades without questioning any scientific relevance. I think most of people will use them in the future without questioning too. As I have mentioned, the very purpose of this book is to connect common technical analysis and trading strategy to the existing science. We really want to break the lack of communication between them. Therefore, we will give an answer to the question.
Connecting Fibonacci ratio to science is not overly complicated. We have already covered that the building block of fractal geometry in financial market is triangle known as equilibrium fractal wave. By drawing a triangle from trough, peak, and trough, we can simply demonstrate that Fibonacci retracement is the technique that predicting the shape ratio of the triangle. In our 61.8% retracement example, we are predicting that the shape ratio of triangle is 61.8%. As we have discussed, the loose-self similarity of equilibrium fractal wave will allow us to have any shape ratio from 0.01 to above 3.0. Our prediction of 61.8% could be wrong and the shape ratio of triangle could end up 123% or 152%, etc. Do we have any justification to predict 61.8% of the triangle? Yes, the justification is how often the shape ratio of 61.8% is repeating in history. If we have 61.8% shape ratio repeating more times than other shape ratio, then we can certainly justify our prediction. To check them, we have already introduced the measurement called Shape ratio index. It is calculated by dividing number of particular shape ratio by total number of peaks and troughs in the price series. In Figure 1-7 and Figure 1-8, we show the distribution of this Shape Ratio index for both EURUSD and GBPUSD daily timeframe. By looking at the distribution in Figure 1-7 and Figure 1-8, we can confirm that 61.8% shape ratio found 27.8% and 23.3% respectively for EURUSD and GBPUSD among all found peaks and troughs. It is certainly much better than 0% or 5%. Over 20% repeating is significant outcome even in statistical sense. However, in GBPUSD, 61.8% shape ratio is not as significant as 50.0% shape ratio. This suggests that 61.8% retracement is not optimal for some currency pairs and stock prices. Another finding is that individual currency pairs or stock price has their own preferred shape ratios.
Shape ratio of equilibrium fractal wave = current move in price units (Y2)/ previous move in price units (Y1).
Shape Ratio index = number of the particular shape of equilibrium fractal wave / total number of peaks and troughs in the price series.
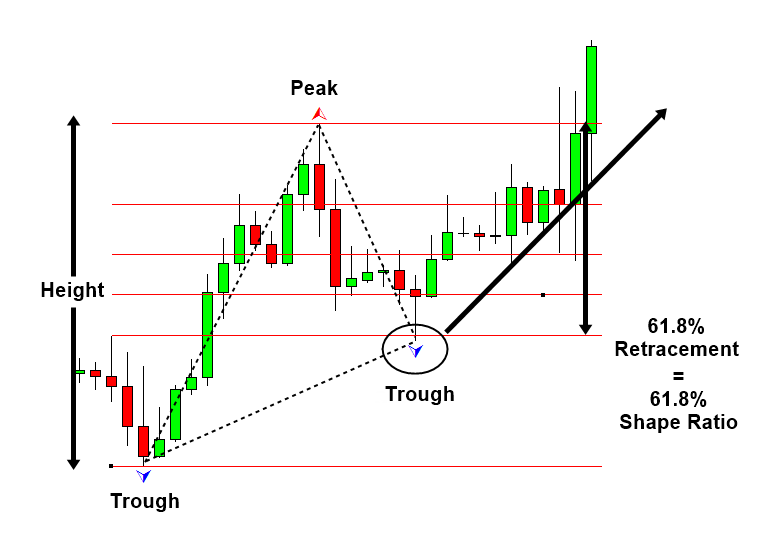
Figure 1-5: Trough-Peak retracement with a triangle drawn.
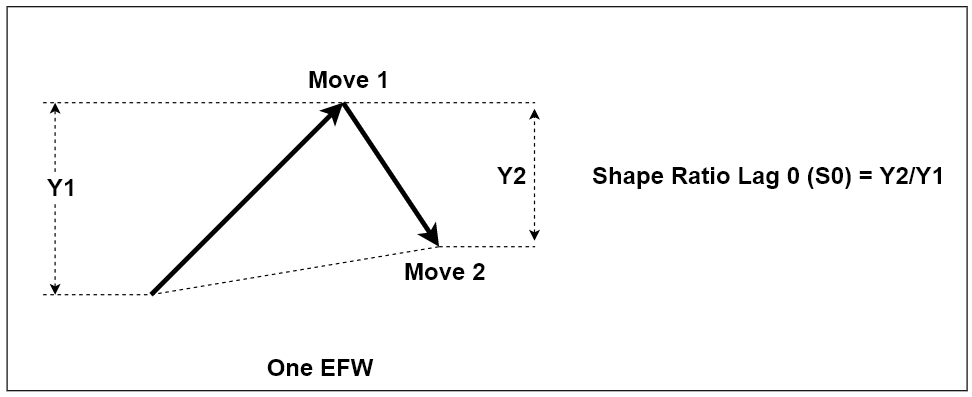
Figure 1-6: Structure of one triangle, equilibrium fractal wave. It is made up from two price movements (i.e. two legs).
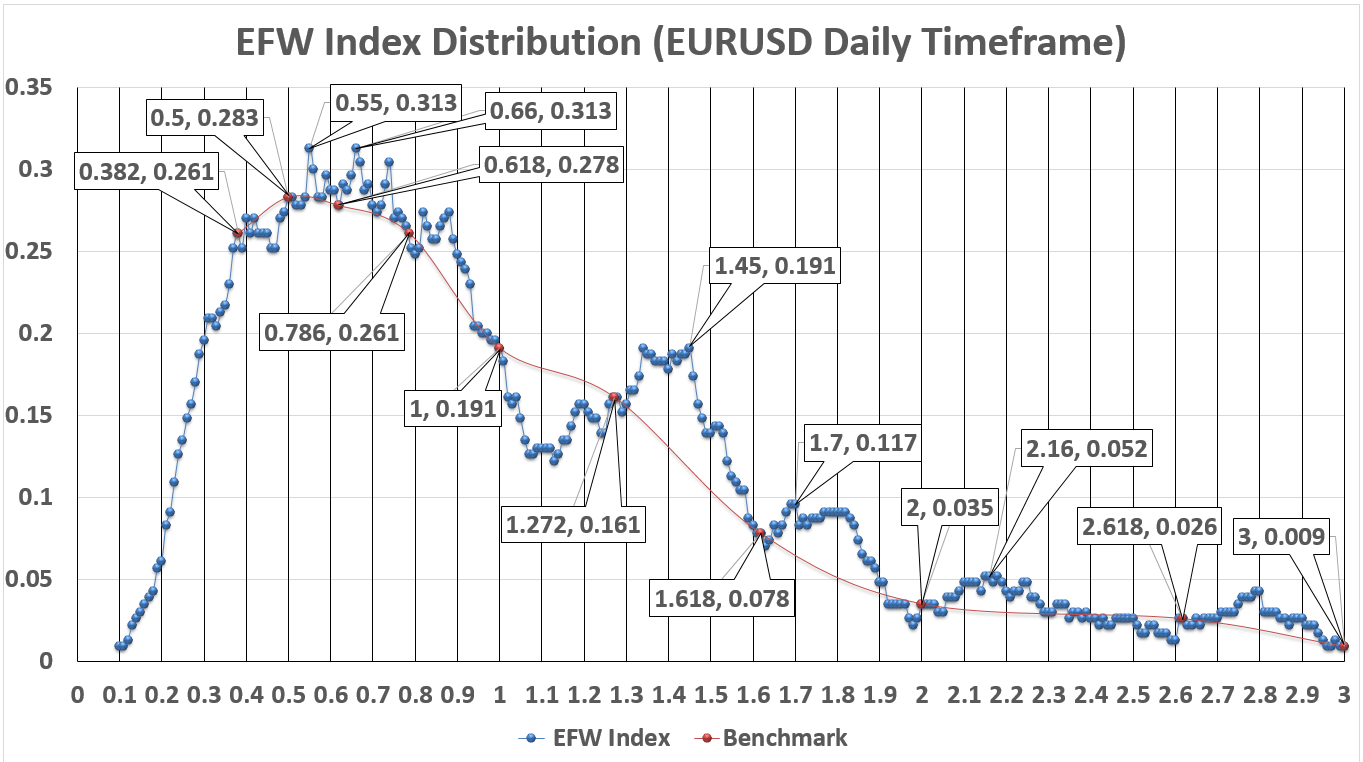
Figure 1-7: EFW Shape Ratio Distribution for EURUSD Daily Timeframe from 2009 09 02 to 2018 02 20 (Label inside callout box, left: Ratio, right: EFW Index, vertical axis: EFW index, horizontal axis: ratio from 0.1 to 3.0).
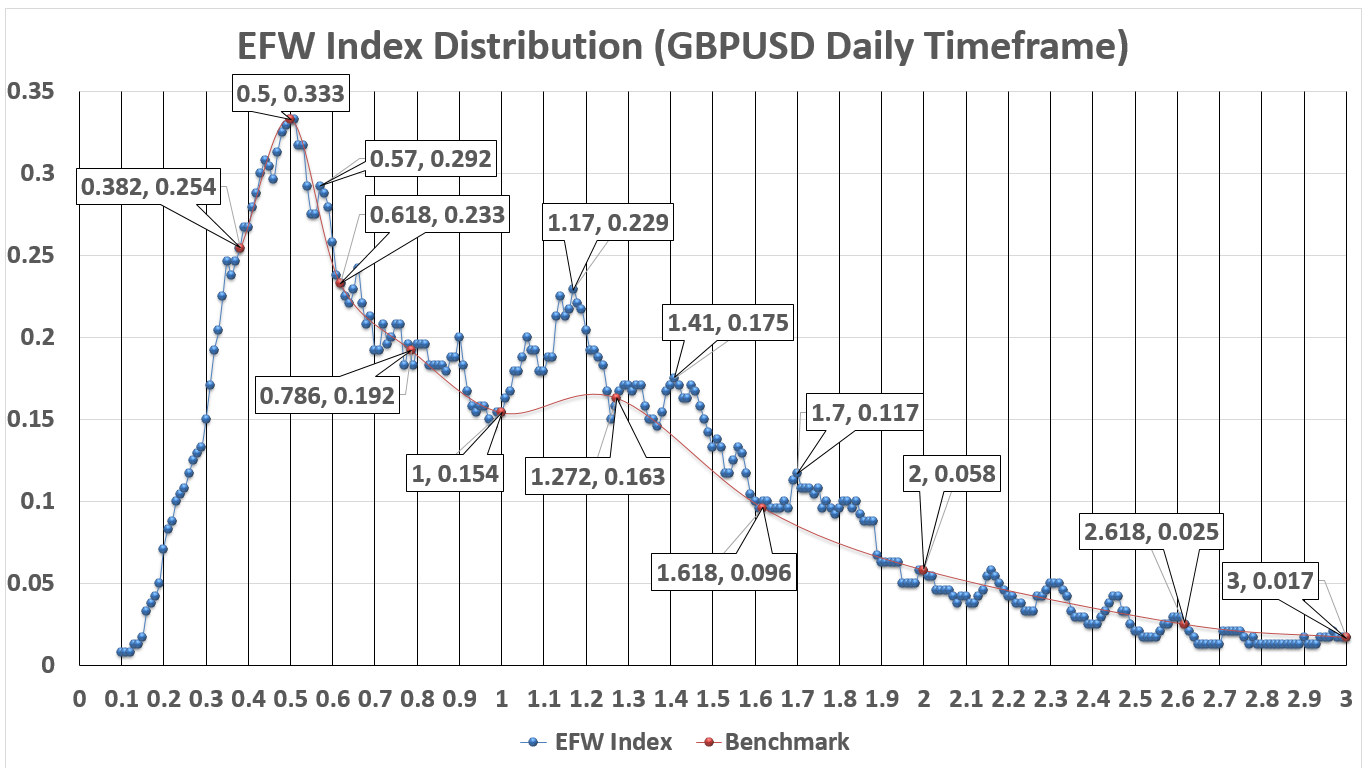
Figure 1-8: EFW Shape Ratio Distribution for GBPUSD Daily Timeframe from 2009 09 02 to 2018 02 20 (Label inside callout box, left: Ratio, right: EFW Index, vertical axis: EFW index, horizontal axis: ratio from 0.1 to 3.0).
Of course, we can find the scientific relevance for Fibonacci expansion technique too. To do so, we just need to create two triangles by connecting peak, trough, peak, and trough. In our 61.8% expansion example, we are predicting that the Momentum ratio of two adjacent triangles is 61.8%. The loose-self similarity will allow us to have any Momentum ratio from 0.01 to above 3.0. We could be wrong or right with our Momentum ratio prediction. To justify our choice over 61.8% expansion ratio, we just need to calculate the distribution of Momentum ratio index. Unfortunately, I do not have the calculated distribution for the case of Momentum ratio. However, I have provided you the equations in this book. You might attempt it by yourself.
Momentum ratio of equilibrium fractal wave = latest price move of current wave in price units (Y3)/ first movement of previous wave in price units (Y1) where Y3 and Y1 are in the same direction.
Momentum Ratio index = number of the particular Momentum ratio / number of peaks and troughs in the price series.
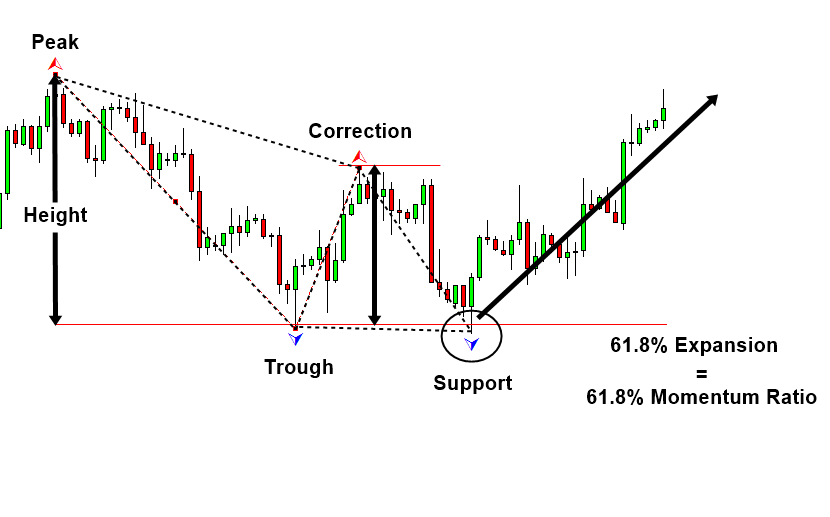
Figure 1-9: Peak-Trough Expansion Example with two triangles drawn.
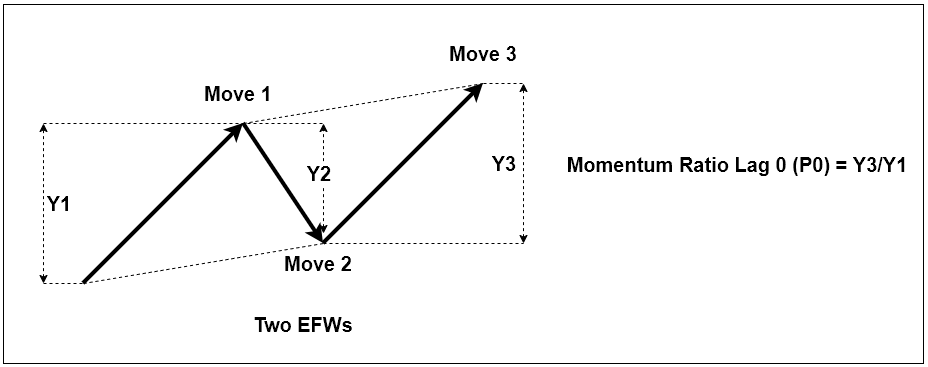
Figure 1-10: Momentum ratio for two ascending Equilibrium Fractal waves
Once again, we emphasize that the distribution of Shape Ratio index and Momentum Ratio index can reveal a lot about financial market. When I first created the distribution of Shape Ratio, I felt like that I found the oil reservoir in the Sahara Desert. There were many useful insights for both scientific and financial trading purpose. I do recommend further research on this in academic level too. Finally, it is important to note that Fibonacci ratio is the basis for many other advanced technical analyses including Shape Ratio trading, Harmonic pattern, and Elliott wave patterns. Therefore, it is important to understand how the Fibonacci analysis works before you proceeding to the next chapter of this book.
About this Article
This article is the part taken from the draft version of the Book: Scientific Guide to Price Action and Pattern Trading (Wisdom of Trend, Cycle, and Fractal Wave). Full version of the book can be found from the link below:
You can also use Harmonic Pattern Plus in MetaTrader to accomplish your technical analysis. Harmonic Pattern Plus is the advanced Fibonacci Analysis Indicator for your trading. Below are the Links to Harmonic Pattern Plus
https://www.mql5.com/en/market/product/4488
https://www.mql5.com/en/market/product/4475
https://algotrading-investment.com/portfolio-item/harmonic-pattern-plus/
Below is the landing page for Optimum Chart (Standalone Charting and Analytical Platform).
https://algotrading-investment.com/2019/07/23/optimum-chart/
Related Products


