Support and Resistance
As a trader, I can not emphasize enough about the importance of support and resistance in Forex and Stock Trading. Support and resistance is the most popular technical analysis tool in the world of trading. Furthermore, the concept of support and resistance are the basis of many advanced trading strategies too. In fact, many of the advanced trading strategies taught in this book including Harmonic Pattern and Elliott Wave are also partly based on the concept of support and resistance. If you do not have good understanding over the support and resistance, it is recommended staying away from the day trading. Many educational materials do mention about support and resistance but in brief. Different textbooks only discuss them in several different angles and it is difficult to find some unified language talking over the support and resistance. Many book will suggest that support and resistance consists of three or more points touching the same line. On the other hand, some book might mention that support and resistance are the respective levels that you should watch out for your trading. They are correct. However, comparing to its mega popularity, most of the textbook provide the very brief description only. As in the Fibonacci analysis, support resistance is another technique lacks with scientific relevance. In this book, we will use the concept of the Equilibrium Fractal-Wave to visualize the price action around the support and resistance. At the same time, the visualized price action can be further used to derive entry and exit for your trading. In addition, we will show you several important classes of support and resistance for your trading. To visualize the price action around the support and resistance, we use the Peak Trough Transformation with ZigZag indicator. We use the free Peak Trough Analysis tool from the website: www.algotrading-investment.com.
2.1 Horizontal Support and Resistance
Support and resistance techniques are one of the most popular trading strategy for many day traders. Support is the price level at which buying is stronger than selling. Hence, the declining of the price below the support levels is often refused. Typically, support level is located below the current market price. Likewise, resistance is the price level at which selling is stronger than buying. Hence, the rising of the price above the resistance level is often refused. Typically, the resistance level is located above the current market price of the instrument. In fact, several support and resistance techniques are the direct pattern recognition techniques to deal with the equilibrium fractal waves in the price series. However, trader should note that not all the support resistance techniques are the valid tool to deal with the equilibrium fractal waves. For example, the pivot levels derived from the pivot analysis can be used as support and resistance for your trading. In fact, many textbook will introduce the pivot analysis as the kind of the support and resistance tool. However, consider how to derive the pivot levels from the standard pivot calculation equations below:
• Pivot Point (P) = (High + Low + Close)/3
• Support 1 (S1) = (P x 2) – High
• Support 2 (S2) = P – (High – Low)
• Resistance 1 (R1) = (P x 2) – Low
• Resistance 2 (R2) = P + (High – Low)
, where High, Low and Close are the High, Low and Close of the previous candle bar.
As you can see, the median price, Pivot Point, of the previous candle bar is calculated first. Then the median price is used to derive the support and resistance 1 and 2. We can clearly see that this pivot analysis have nothing to do with any pattern recognition from your chart. It rather uses the concept of averaging and volatility from the centre of the pivot point. One can extend the standard pivot analysis using Fibonacci ratio. However, the extended pivot analysis is still not the direct pattern recognition either.
When we say the support and resistance as in the direct pattern recognition, we are talking about creating support and resistance levels by connecting peak to peak and by connecting trough to trough in your chart. By connecting three troughs in the chart, we could identify the important support level and we can project the level for the next point for our trading. When the price was approaching to the support level fourth time, the price made a reversal (turning point) movement on the support level. This is what happened at least on the surface. However, what is exactly going on behind the scene? In fact, the support levels are the manifest of the propagation of the Equilibrium Fractal Wave through the price. When the price touches the support level each time, new triangle is added to the price wave. The price can continue like this making few more touches on the support level. Sometimes, it is common to see the support with five or more touches. In general, when the vertexes of several non-overlapping triangles are aligned through a straight line below the market price, the straight line becomes the support level.
In our first support example, we have visualized the reversal price action around the support. However, it is possible that we can have the support predicting the breakout movement instead of the reversal. For example, the USDJPY in penetrated through the support making the breakout on its fourth touch. When the price breakout below the support level, we can see that the size of the last triangle was transformed to be bigger. This is the typical price action when the new equilibrium source is introduced to the market.
Now let us have a look at the resistance example. As before, we can identify the important resistance levels by connecting peak to peak. The price made a reversal (turning point) in its fourth touch on the resistance level. As in the support level, the resistance levels are formed when the vertexes of the several non-overlapping triangles are aligned near the same horizontal level. In this time, the horizontal levels will be located above the market price. As in the support example, it is possible to have a breakout through the resistance too. For example, the EURUSD in Figure 2-4 made a clean breakout on its seventh touch on the resistance level. In this example, the last triangle was transformed in its size as in the support example of Figure 2-2. By summarizing both support and resistances examples, we can identify four different horizontal support and resistance patterns for your trading as shown in Table 2-1.
Support and resistance, Price Action
Horizontal Support Reversal, Buy
Horizontal Support Breakout, Sell
Horizontal Resistance Reversal, Sell
Horizontal Resistance Breakout, Buy
Table 2-1: List of horizontal support and resistance patterns for your trading.
What is the main catchy behind the above support and resistance examples for our trading? In the practical trading with support and resistance levels, we are betting on the transformation of the last triangle, equilibrium fractal wave in fact. In another words, we are betting on the size of the last triangle. When you are trading with support and resistance levels, you are literally asking the questions like: Would the last triangle will transform in its size to make the breakout move? Or Would the last triangle will not transform in its size to make the reversal move? In our practical trading, how the size of the last triangle will end is the matter for our profit. If we are not using any other supplementary techniques to trade, then we can set a threshold level to trigger for buy and sell entry. Y Buy and Y Sell is the price level to trigger the buy and sell entry respectively. If the last triangle is transformed in its size, then the price will penetrate the threshold level for sell. If the last triangle is not transformed in its size, then the price will reverse back through the threshold level for buy. To measure the distance Y Buy and Y Sell, we can use few different methods. Firstly, we can define Y Buy and Y Sell in proportion of the height of the last triangle (Y Height).
For example, Y Buy and Y Sell can be expressed using the following formula:
Y Buy = Proportion (%) x Y Height and
Y Sell = Proportion (%) x Y Height, where Y Height = the height of the last triangle and Proportion is fraction of the height of the last triangle expressed in percentage.
The typical proportion to calculate Y Buy and Y Sell can range from 5% to 20%. When you choose the proportion, you might have to consider few points. If you choose to use small proportion, then you might experience the false signal frequently. In addition, you might be suffering from the price pull back due to the tight stop loss. If you choose to use large proportion, then you might be reducing your reward/risk ratio. Therefore, you have to win more frequently to maintain your profits.
Another method to set the buy and sell threshold level is using the Fibonacci ratio. Again, the Fibonacci threshold level will be calculated in terms of the height of the last triangle. For example, Y Buy and Y Sell can be expressed using the following formula:
Y Buy = Fibonacci Ratio x Y Height and
Y Sell = Fibonacci Ratio x Y Height, where Y Height = the height of the last triangle and Fibonacci ratio include the typical Fibonacci ratios like 0.236, 0.382, 0.500, and 0.618, etc.
Both the proportional threshold method and the Fibonacci threshold method are valid for your entry. You can pick up one between them according to your own preferences. Fibonacci threshold method tends to provide the entry with greater distance from the stop. Hence, it should be noted that the Fibonacci threshold method could reduce your rewards/risk ratio. However, if the size of the last triangle is too small, then you might prefer to use the Fibonacci threshold method because too tight stop loss can be hunted too easily. You can set your stop loss at the support or resistance level for your trading. However, it is possible that the price can come back to the support or resistance level for retesting. It is sensible to place your stop slightly greater than the support and resistance level. Hence, the support or resistance level can be only minimum stop for your trading. You should always set your stop loss slightly greater than the minimum stop level.
2.2 Diagonal Support and Resistance
In the financial market, we can observe the diagonal price patterns frequently. Diagonal support and resistance are the typical price patterns we can observe as the results of the combined effect of Equilibrium and Fractal Wave process. Diagonal support and resistance are not different from the horizontal support and resistance. When the connected peaks and troughs provide the diagonal slope rather than the horizontal line, then that slope can be considered as the diagonal support and resistance. However, there can be more variations comparing to the horizontal case. Firstly, we can have the ascending diagonal support and resistance. Secondly, we can also have the descending diagonal support and resistance. For your convenience, we have listed all the possible diagonal support and resistance patterns in Table 2-2. We have also listed the corresponding example for each pattern. How to trade diagonal support and resistance levels are the same as the horizontal support and resistance. You can apply the proportional threshold method and the Fibonacci threshold method for your entry for the case of diagonal support and resistance too. How to calculate the threshold level for Y Buy and Y Sell are identical to the case of horizontal support and resistance. As in the horizontal support and resistance, it is sensible to set your stop loss level greater than the minimum stop level.
Support and resistance, Price Action
Ascending Diagonal Support, Reversal Buy
Ascending Diagonal Support, Breakout Sell
Ascending Diagonal Resistance, Reversal Sell
Ascending Diagonal Resistance, Breakout Buy
Descending Diagonal Support, Reversal Buy
Descending Diagonal Support, Breakout Sell
Descending Diagonal Resistance, Reversal Sell
Descending Diagonal Resistance, Breakout Buy
Table 2-2: List of diagonal support and resistance patterns for your trading.
● Horizontal Support and Resistance
https://algotrading-investment.com/2020/06/04/horizontal-support-and-resistance/
● Diagonal Support and Resistance
https://algotrading-investment.com/2020/06/04/diagonal-support-and-resistance/
● Identification of Support and Resistance with the Template and Pattern Approach
Human Behavioral Aspects of Support and Resistance
In the context of Forex, support and resistance have different meanings compared to their use in human geometry recognition. In Forex trading, these terms refer to price levels on a chart, but there might be some conceptual crossover when considering how traders react to these levels, which could potentially be analyzed through human behavior and geometry recognition. Here’s how these concepts apply:
1. Support and Resistance in Forex Trading
- Support:
- Definition: A support level in Forex is a price point where a currency pair tends to stop falling. It is often seen as a “floor” that price does not easily break below. Traders look for these levels to identify where buying interest is strong enough to prevent further declines.
- Behavioral Aspect: When a currency reaches a support level, traders may react by buying, expecting the price to rebound.
- Resistance:
- Definition: A resistance level is a price point where a currency pair tends to stop rising. It acts like a “ceiling” that the price struggles to break above. Traders look at these levels to identify where selling pressure is strong enough to prevent further gains.
- Behavioral Aspect: When a currency reaches a resistance level, traders might react by selling, expecting the price to fall back down.
2. Geometry Recognition of Human Behavior in Trading
- Human Reactions to Support and Resistance:
- The way traders react to these key price levels could potentially be analyzed using geometry recognition, which is more about understanding physical movements and emotional cues.
- Facial and Posture Recognition: Analyzing the physical cues of traders, such as tension in facial muscles or body posture, might indicate their confidence or hesitation when prices approach support or resistance. For instance, traders may lean in or sit up straighter when a price reaches a critical level, signaling attention and anticipation.
- Eye Movement: Traders’ eye movements could be tracked to see how closely they monitor price action near support and resistance. Rapid eye movements might indicate scanning for quick opportunities, while focused gazes may show intense analysis at these critical levels.
- Use of Technology:
- Machine Learning & AI: In trading firms, AI might be employed to recognize patterns not just on the charts but also in trader behavior, which could include reading physical cues. By identifying how traders physically react to key levels, algorithms might make predictions about market sentiment.
- Behavioral Finance: This field studies how psychological factors influence trading decisions. Combining this with geometry recognition could lead to insights on how human emotions manifest during trading, especially around significant price points like support and resistance.
Practical Applications in Trading
- Automated Trading Systems: Advanced trading algorithms could incorporate not just price data but also human behavioral data to make more accurate predictions. If physical cues suggest heightened anxiety or confidence, it could be an additional input for trading decisions.
- Trader Performance Analysis: Geometry recognition of a trader’s movements and expressions could be used to understand how they handle stress and make decisions under pressure, especially when trading around key price levels. This could lead to improved training programs.
In conclusion, while support and resistance in Forex refer specifically to price action, there’s an interesting potential for combining these concepts with human geometry recognition. Understanding how traders physically react to these key levels could enhance trading strategies, risk management, and even automated trading systems.
About this Article
This article is the part taken from the draft version of the Book: Scientific Guide to Price Action and Pattern Trading (Wisdom of Trend, Cycle, and Fractal Wave). Full version of the book can be found from the link below:
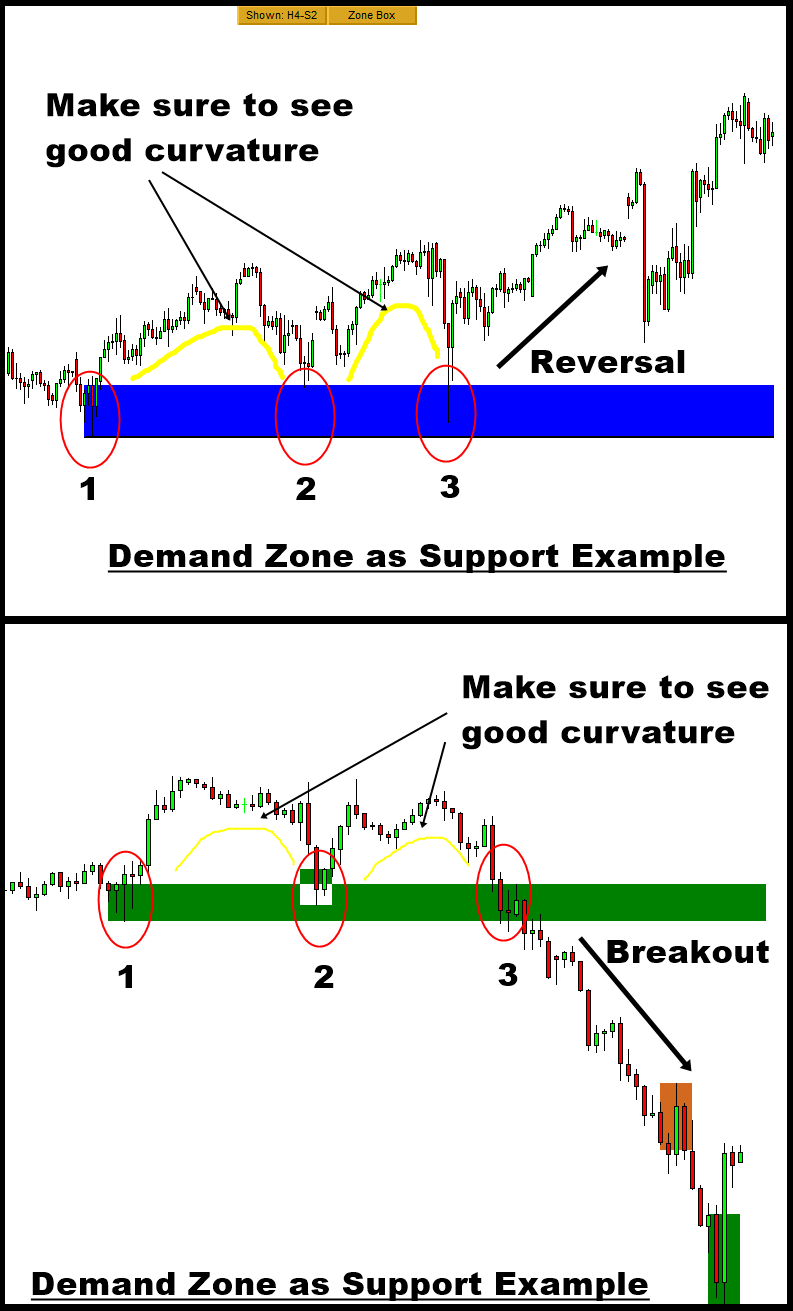
You can also use Ace Supply Demand Zone Indicator in MetaTrader to accomplish your support resistance analysis. Ace Supply Demand Zone indicator is non repainting and non lagging indicator with a lot of powerful features built on. Especially, you can use it like the horizontal support and resistance for your trading as well as the direction prediction trading strategy.
https://www.mql5.com/en/market/product/40076
https://www.mql5.com/en/market/product/40075
https://algotrading-investment.com/portfolio-item/ace-supply-demand-zone/
Turning Point Probability and Trend Probability can be measured with Fractal Pattern Scanner at every price action in your chart. The turning point probability can improve the accuracy of trading with horizontal support and resistance. You can watch this YouTube video how you can turn the support resistance into the killer strategy with the turning point probability in Fractal Pattern Scanner.
Below is the landing page to Fractal Pattern Scanner in MetaTrader 4 and MetaTrader 5.
https://www.mql5.com/en/market/product/49170
https://www.mql5.com/en/market/product/49169
https://algotrading-investment.com/portfolio-item/fractal-pattern-scanner/
Related Products


