Introduction to the Wave Principle

Ralph Nelson Elliott was one of very first person who believed that he could predict the stock market by studying the repeating price patterns in the price series. The Wave Principle from Elliott states that the wave patterns in different scales are repeating and superimposing on each other forming complex wave patterns. If harmonic pattern directly focuses on the short patterns made up from five points, the Wave Principle, developed by Ralph Nelson Elliott, describe how the financial market evolve to meet the equilibrium with the repeating wave patterns, equilibrium fractal waves. The advantage of Elliott Wave theory is that it is comprehensive as the theory provides multiple trading entries on different market conditions. With Elliott Wave theory, traders can perform both momentum trading and mean reversion trading. The disadvantage of Elliott Wave theory is that it is more complex comparing to other trading techniques. In addition, there are still some loose ends in detecting Elliott wave patterns. For this reason, many traders heavily criticize the lack of scientific methods of counting Elliott Waves.

Elliott Wave theory received good attention from many traders and investors for several decades. Elliott Wave theory is a useful technique to deal with the financial market with the dominating Equilibrium Fractal-Wave process. For the financial market with strong Equilibrium Wave process (2nd, 3rd and 4th columns in the Price Pattern Table), traders must use alternative methodology over Elliott Wave techniques because Elliott Wave Theory is not meant to deal with Wave process. Seasonality or other cyclic fluctuations can be dealt better with other techniques.  For example, Seasonal Exponential Smoothing, Fourier Transform, Principal Component Analysis or Wavelet Transformation might do better job for such a case. Some literature review and empirical research can yield helpful insight on which market trader can trade better with Elliott Wave Theory. In our Book, we will introduce the fundamentals of the Wave Principle. At the same time, we will introduce the template and pattern approach towards more scientific wave counting for traders.

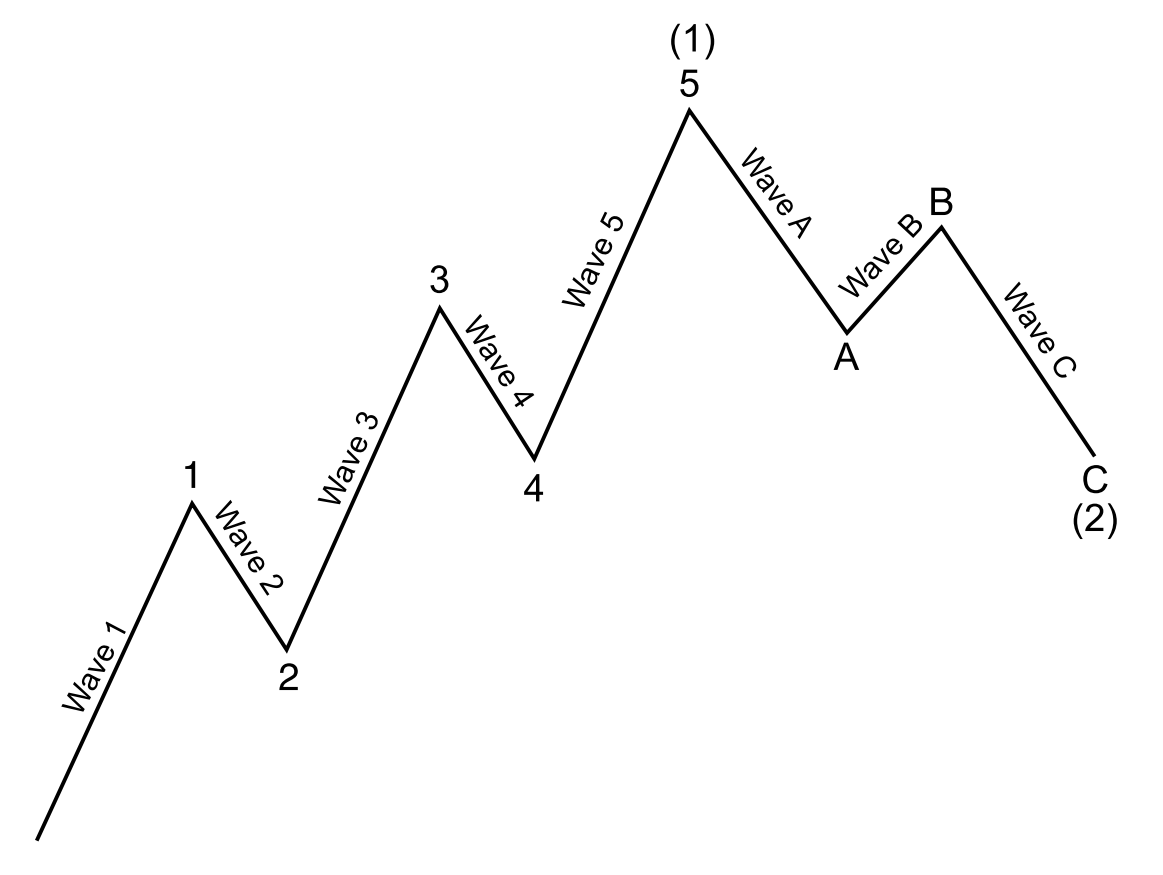
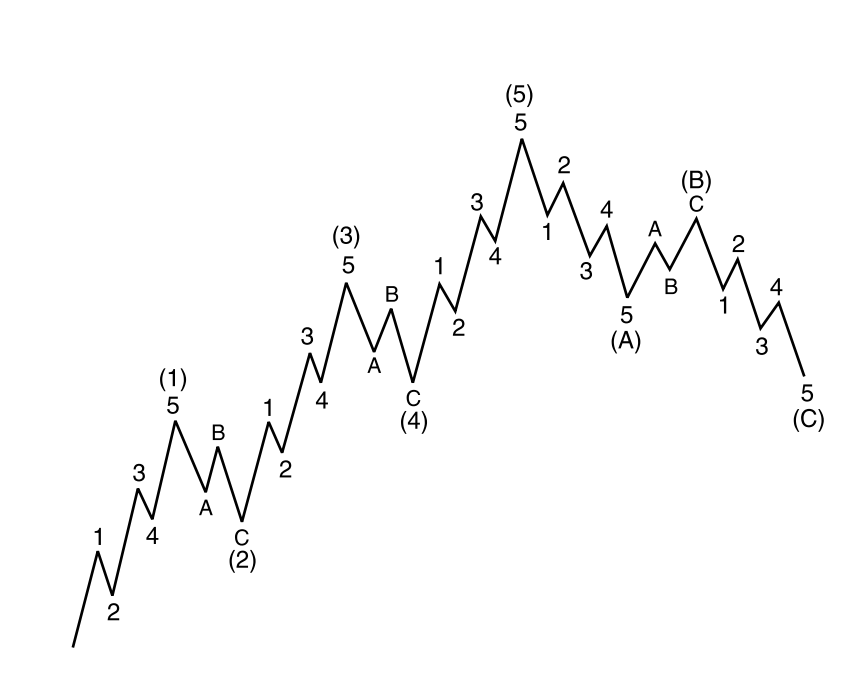
The Wave Principle states that the crowd or social behaviour follows a certain wave patterns repeating themselves. The Wave Principle identifies two wave patterns. They are impulse and corrective wave. Often, the term impulse wave is interchangeably used with the motive wave. Two terms are identical. Both motive and impulse wave progress during the main trend phase whereas the corrective wave progress during the corrective phase against the main trend. In general, the Impulse Wave has a five-wave structure, while the Corrective Wave have a three-wave structure (Figure 5-1). It is important to understand that these wave structures can override on smaller wave structure to form greater wave cycle (Figure 5-2). Elliott Wave theory is useful in identifying both trend market and correction market. As the Elliott Wave Theory already assumes that price progresses in the Fractal-Wave form, they do not suffer from lagging of price like the smoothing algorithm based technical indicators do.

Figure 5-1: Illustrative example of five impulse wave and three corrective wave structure.

Figure 5-2: Lesser Impulse and corrective wave forming more complex wave patterns.


Some More Tips about the Elliott Wave Principle

The Elliott Wave Principle is a form of technical analysis that traders and investors use to analyze financial market cycles and predict future market movements. It is based on the idea that market prices unfold in specific patterns or waves, which are driven by collective investor psychology, or sentiment, as it oscillates between optimism and pessimism.

Core Concepts of Elliott Wave Principle

1. Wave Structure

According to the Elliott Wave Principle, market prices move in waves that can be categorized into two main types:

A. Impulsive Waves

  • Structure: Impulsive waves consist of five sub-waves that move in the direction of the larger trend. These are labeled as Waves 1, 2, 3, 4, and 5.
  • Characteristics:
    • Wave 1: The initial move in the direction of the trend.
    • Wave 2: A corrective wave that retraces some of Wave 1.
    • Wave 3: Often the longest and strongest wave, continuing the trend.
    • Wave 4: A corrective wave, usually shallower than Wave 2.
    • Wave 5: The final wave in the direction of the trend, often accompanied by decreased momentum.

B. Corrective Waves

  • Structure: Corrective waves consist of three sub-waves (A, B, and C) that move against the trend. These are typically labeled as Waves A, B, and C.
  • Characteristics:
    • Wave A: An initial move against the main trend.
    • Wave B: A counter-move that retraces Wave A.
    • Wave C: The final move in the correction, usually extending beyond the end of Wave A.

2. Wave Degrees

Waves exist on different scales, or “degrees,” and each wave can be broken down into smaller waves of the same structure:

  • Grand Supercycle: Lasts several centuries.
  • Supercycle: Lasts several decades.
  • Cycle: Lasts one year to several years.
  • Primary: Lasts a few months to a couple of years.
  • Intermediate: Lasts a few weeks to a few months.
  • Minor: Lasts a few weeks.
  • Minute: Lasts a few days.
  • Minuette: Lasts a few hours.
  • Sub-Minuette: Lasts a few minutes.

3. Wave Patterns

Elliott identified a variety of wave patterns that can occur in the market. These patterns help traders identify the current wave count and anticipate future price movements.

A. Impulsive Patterns

  • Basic Impulse: The standard five-wave structure in the direction of the trend.
  • Diagonal Triangle: A converging or diverging pattern that appears as Wave 5 in an impulse or as Wave C in a correction.

B. Corrective Patterns

  • Zigzag (5-3-5): A sharp correction that subdivides into a five-wave pattern (Wave A), a three-wave pattern (Wave B), and another five-wave pattern (Wave C).
  • Flat (3-3-5): A sideways correction where Wave B retraces nearly all of Wave A, and Wave C typically does not extend far beyond Wave A.
  • Triangle (3-3-3-3-3): A converging or diverging pattern that typically occurs in a fourth wave position, preceding the final wave in the sequence.
  • Complex Corrections: Combinations of the above patterns, such as double and triple zigzags.

4. Fibonacci Relationships

Elliott Wave patterns are often linked to Fibonacci ratios, which help in predicting the length and target of waves:

  • Wave 2: Typically retraces 38.2% to 61.8% of Wave 1.
  • Wave 3: Often extends to 161.8% of Wave 1.
  • Wave 4: Usually retraces 23.6% to 38.2% of Wave 3.
  • Wave 5: Can extend to 100% or 161.8% of the length of Wave 1.

5. Rules and Guidelines

The Elliott Wave Principle is governed by a few strict rules and several guidelines that help in determining the correct wave count:

  • Rule 1: Wave 2 cannot retrace more than 100% of Wave 1.
  • Rule 2: Wave 3 cannot be the shortest among Waves 1, 3, and 5.
  • Rule 3: Wave 4 cannot enter the price territory of Wave 1.

6. Market Psychology

The Elliott Wave Principle is deeply rooted in the psychology of market participants:

  • Optimism and Pessimism: Waves reflect the natural ebb and flow of investor sentiment.
  • Fractals: Market patterns repeat on various time scales, reflecting the fractal nature of market psychology.

Practical Application

1. Identifying the Trend

Traders use Elliott Wave Theory to identify the current market trend by analyzing the wave structure. An impulse wave suggests that the trend is continuing, while a corrective wave indicates a counter-trend movement.

2. Forecasting Future Price Movements

By identifying the current wave count, traders can anticipate the likely direction and extent of future price movements. For example, if a trader identifies the market in Wave 2 of an impulse, they might expect a strong move in the direction of the trend as Wave 3 develops.

3. Risk Management

Elliott Wave Theory helps traders set stop-loss levels based on wave rules. For example, knowing that Wave 2 should not retrace more than 100% of Wave 1, a trader might set a stop-loss just below the start of Wave 1.

4. Combining with Other Technical Tools

Elliott Wave analysis is often combined with other technical tools, such as moving averages, oscillators, and trendlines, to improve accuracy and confirm wave counts.

Example: Elliott Wave in Action

Scenario: Trading EUR/USD on a Daily Chart

  1. Identify Wave 1: An upward move from 1.1000 to 1.1500.
  2. Identify Wave 2: A retracement to 1.1200, adhering to the 38.2% Fibonacci level.
  3. Identify Wave 3: A strong move up to 1.2000, extending 161.8% of Wave 1.
  4. Identify Wave 4: A correction down to 1.1800, staying above the territory of Wave 1.
  5. Identify Wave 5: A final move up to 1.2200.

Trading Strategy

  • Entry: Enter a long position at the end of Wave 2.
  • Stop-Loss: Place a stop-loss just below 1.1000 (start of Wave 1).
  • Target: Target the 1.2000 level for Wave 3, then reassess for Wave 5.

Conclusion

The Elliott Wave Principle provides a comprehensive framework for understanding market movements and making informed trading decisions. By identifying wave patterns, adhering to rules, and leveraging Fibonacci relationships, traders can gain insights into the market’s direction and potential price targets, improving their chances of successful trades.


About this Article

This article is the part taken from the draft version of the Book: Scientific Guide to Price Action and Pattern Trading (Wisdom of Trend, Cycle, and Fractal Wave). Full version of the book can be found from the link below:

https://algotrading-investment.com/portfolio-item/scientific-guide-to-price-action-and-pattern-trading/

Elliott Wave Trend is the most advanced Elliott Wave Trading software, which helps you to trade with various Elliott Wave patterns like Wave .12345 pattern and Wave .ABC and Wave .ABCDE, and so on. Elliott Wave Trend was built on the concept of Precision Trading with Elliott Wave Structure Score. Our Elliott Wave Trend is professional tool for professional trader. Elliott Wave Trend is available in both MetaTrader 4 and MetaTrader 5 platform.

YouTube Link: https://youtu.be/Oftml-JKyKM

Our Elliott Wave Trend is available in both MetaTrader 4 and MetaTrader 5 version. Here are the links to Elliott Wave Trend.

https://algotrading-investment.com/portfolio-item/elliott-wave-trend/

https://www.mql5.com/en/market/product/16472

https://www.mql5.com/en/market/product/16479

EFW Analytics provide the graphic rich and fully visual trading styles. In default trading strategy, you will be looking at the combined signal from Superimposed pattern + EFW Channel or Superimposed pattern + Superimposed Channel. In addition, you can perform many more trading strategies in a reversal and breakout mode. You can also run two different timeframes in one chart to enforce your trading decision. Sound alert, email and push notification are built inside the indicator.

Below is the link to the EFW Analytics:

https://algotrading-investment.com/portfolio-item/equilibrium-fractal-wave-analytics/

https://www.mql5.com/en/market/product/27703

https://www.mql5.com/en/market/product/27702

Related Products